2
photocatalysts
Rita Ruivo Neves Marques
Dissertation presented for the Master Degree in the
Chemical Engineering Department at the Faculty of Engineering,
University of Porto, Portugal
Supervisors:
Prof. Joaquim Luís Bernardes Martins de Faria
Dr. Adrián Manuel Tavares da Silva
LCM - Laboratory of Catalysis and Materials Associated Laboratory LSRE/LCM
Department of Chemical Engineering Faculty of Engineering
University of Porto Portugal
Agradecimentos
A realização deste trabalho só foi possível com a contribuição de várias pessoas a quem gostaria de agradecer.
Em especial ao Professor Doutor Joaquim Faria pela supervisão deste trabalho, em particular pela preciosa ajuda na discussão científica e algumas vezes filosófica dos meus resultados. Também pelo espírito de equipa que fomenta dentro do grupo.
Ao meu co-orientador, o Doutor Adrián Silva, pelo empenho incondicional no meu trabalho e por todos os ensinamentos humanos que vão muito para além da investigação científica e que tanto para ela contribuem.
Ao Professor Doutor José Luís Figueiredo por ter disponibilizado todos os recursos técnicos do Laboratório de Catálise e Materiais, do qual é director.
A todos os meus colegas de laboratório, em especial ao Doutor Bruno Machado pela incansável ajuda em muito do que envolve a elaboração desta tese.
Aos meus colegas das Faria Sessions pelo seu contributo na discussão dos meus resultados: Cristina, João, Sónia e Wang.
Ao Doutor Rui Boaventura por ter disponibilizado o equipamento com o qual determinei o carbono orgânico total de algumas amostras. À Liliana pela sempre voluntariosa ajuda nessas análises.
Ao Doutor Goran Dražić pela realização das análises de HRTEM.
"The financial support under the Clean Water project is acknowledged. Clean Water is a Collaborative Project (Grant Agreement number 227017) co-funded by the Research DG of the European Commission within the joint RTD activities of the Environment and NMP Thematic Priorities."
Finalmente, à minha mãe e ao meu pai, Judite e Fernando, ao meu irmão João e à minha avó Lucília. Por tudo, sempre!
Abstract
Carbon nanotubes (CNT) have been widely used in catalytic applications due to their interesting and unique physical and chemical properties, such as high mechanical and thermal resistance. Synthesis of titanium dioxide with incorporation of CNT yields photocatalytic materials capable of absorbing visible light. This behaviour is of great interest since TiO2 absorbs preferentially on the UV region, which merely represents 3-6 % of solar radiation. Hence, the use of CNT/TiO2 composite materials in photocatalytic processes can result in a better usage of the sun, as it is a natural source of light. In the present work, Single-Walled Carbon Nanotubes (SWCNT) are chemically modified to be incorporated on TiO2 matrix for further development of hybrid SWCNT/TiO2 composites.
The surface chemistry of SWCNT is finely tailored by a HNO3 hydrothermal method. Temperature Programmed Desorption analysis is used to determine the nature and amount of different oxygenated functionalities, which are introduced in a controlled mode, being correlated with HNO3 concentration by a mathematical function. Operating temperature and HNO3 concentration are key parameters in the modification of the SWCNT surface chemistry. The effect of the HNO3 hydrothermal functionalization strongly depends on the texture of the carbon materials that are used.
Bare TiO2 and different SWCNT/TiO2 composites are synthesized by an acid-catalyzed sol-gel method and some selected materials are modified by means of a hydrothermal treatment. Diffuse reflectance UV-Vis spectroscopy and BET surface area measurements are used to characterize all the prepared materials which are further used in the photocatalytic oxidative degradation of two probe organic molecules (p-Methoxyphenol and p-Cyanophenol). The photocatalytic performance of SWCNT/TiO2 composites seems to be affected by previous functionalization of SWCNT. The hydrothermal treatment improves visible light response in photocatalysis but the characterization methods used in the present study are not sufficient to explain the obtained results. Further studies are needed to optimize the development of hybrid SWCNT/TiO2 catalysts. Suggestions to future work on SWCNT functionalization, materials preparation and photocatalytic tests are given.
Keywords: carbon nanotubes, surface chemistry, hydrothermal treatment, titania based composites, photocatalysis.
Resumo
Os nanotubos de carbono têm sido amplamente utilizados no domínio científico da catálise devido às características singulares que apresentam, tais como elevadas resistências mecânica e térmica. A síntese de dióxido de titânio (TiO2) com incorporação de nanotubos na sua matriz resulta na obtenção de materiais activos em fotocatálise com absorção de luz na região do visível (Vis). Esta particularidade é de grande interesse prático uma vez que o TiO2 absorve preferencialmente na região do ultravioleta (UV), o que representa apenas 3-6 % da radiação solar. Por este motivo, a utilização de materiais compósitos do tipo CNT/TiO2 em processos fotocatalíticos pode resultar num melhor aproveitamento da radiação solar como fonte natural de luz. Nesta tese, nanotubos de carbono de parede única (Single-Walled
Carbon Nanotubes – SWCNT) são modificados quimicamente e posteriormente incorporados
numa matriz de TiO2, formando materiais compósitos do tipo SWCNT/TiO2.
A química de superfície dos SWCNT é modificada de uma forma controlada através de um tratamento hidrotérmico com ácido nítrico, sendo a natureza e quantidade dos grupos oxigenados introduzidos determinadas por desorção a temperatura programada. A quantidade de grupos introduzidos na superfície dos SWCNT é correlacionada com a concentração de ácido nítrico por uma função matemática. Neste estudo, conclui-se que os parâmetros chave para a modificação controlada da química de superfície dos SWCNT são a temperatura de operação e a concentração de ácido nítrico. Conclui-se também que a funcionalização de um material de carbono por tratamento hidrotérmico com ácido nítrico é fortemente influenciado pela sua morfologia.
A preparação de TiO2 e de compósitos do tipo SWCNT/TiO2 é feita com base num método sol-gel catalisado em meio ácido. Alguns destes materiais foram seleccionados e sujeitos a um tratamento hidrotérmico. Todos estes catalisadores são caracterizados por espectroscopia de reflectância difusa na região do UV-Vis e pela área específica BET, sendo posteriormente utilizados na fotodegradação oxidativa de duas moléculas orgânicas (Methoxyphenol e p-Cyanophenol). A funcionalização prévia dos SWCNT parece ter influência no comportamento fotocatalítico dos compósitos SWCNT/TiO2. Verifica-se também que o tratamento hidrotérmico aumenta a resposta fotocatalítica na região do visível. No entanto, os métodos de caracterização utilizados neste estudo não são suficientes para explicar os resultados obtidos. São necessários estudos posteriores para a optimização dos catalisadores SWCNT/TiO2. Nesse sentido, são apresentadas sugestões de trabalho futuro no âmbito da funcionalização dos SWCNT, da preparação de materiais e dos ensaios de fotocatálise.
Palavras-chave: nanotubos de carbono, química de superfície, tratamento hidrotérmico, compósitos de TiO2, fotocatálise.
Table of Contents i
Table of Contents
Table of Contents ... i
List of Figures ... ii
List of Tables ... iii
Glossary ... iv
Aim of the work and thesis outline ... 1
1 Introduction ... 2
1.1 Photocatalysis and CNT/TiO2 composite catalysts ... 2
1.2 CNT and surface chemistry ... 5
2 Experimental ... 7
2.1 Functionalization of SWCNT ... 7
2.1.1 HNO3 Hydrothermal Oxidation ...7
2.1.2 SWCNT Characterization ...8
2.2 Preparation and characterization of bare TiO2 and hybrid SWCNT/TiO2 photocatalysts ... 8
2.2.1 Acid-catalyzed Sol-Gel Method ...9
2.2.2 Hydrothermal Treatment ...9
2.2.3 Photocatalysts Characterization...9
2.3 Photocatalytic Oxidative Degradation of Organic Pollutants ... 10
3 Results and Discussion ... 12
3.1 Functionalization of SWCNT ... 12
3.2 Characterization of hybrid SWCNT/TiO2 photocatalysts ... 26
3.3 Photocatalytic Oxidative Degradation of Organic Pollutants ... 27
3.3.1 Heterogeneous photocatalysis of p-Methoxyphenol aqueous solutions ... 27
3.3.2 Heterogeneous photocatalysis of p-Cyanophenol aqueous solutions ... 30
4 Conclusions ... 32
5 Future Work ... 33
List of Figures ii
List of Figures
Figure 1.1- Crystal structures of anatase (a) rutile (b) and brookite (c) ...3 Figure 1.2 - MWCNT acting as photosensitizer in the composite catalyst: (a) following photon
absorption, an electron is injected into the CB of TiO2 semiconductor; (b) the electron is
back-transferred to MWCNT with the formation of a hole in the VB of TiO2 semiconductor and reduction of
the so formed hole by adsorbed OH— ...4
Figure 2.1 - Autoclave and temperature controller used in the functionalization of the SWCNT. ...7 Figure 2.2 - Photoreactor employed on the photocatalytic experiments with the lamp (a) off and (b) on.10 Figure 2.3 - Radiation flux of Heraeus TQ 150 immersion lamp and transmission Spectrum of the
DURAN 50 filter ... 11
Figure 3.1 - HRTEM micrographs of (a) the pristine SWCNT sample and after treatment with (b) 0.1
mol L-1 and (c) 0.3 mol L-1 of HNO
3. ... 12
Figure 3.2 - TPD spectra for the pristine SWCNT and treated under different HNO3 concentrations at
473 K: (a) CO release; (b) CO2 release. ... 14
Figure 3.3 - Evolution of the amount of CO and CO2 with HNO3 concentration: open symbols – 393 K; full
symbols – 473 K (mathematical correlations: [HNO3] must be inserted in mol L-1 for a [COx] in
mol g-1). 16Figure 3.4 - Deconvolution of TPD spectra for the SWCNT treated with 0.3 mol L-1 of HNO
3 at 473 K:
(a) CO spectrum; (b) CO2 spectrum. ... 18
Figure 3.5 - Evolution of the concentration of specific oxygenated groups created at the surface of
SWCNT under HNO3 treatment at 473 K, released as (a) CO and (b) CO2. ... 19
Figure 3.6 - Amount of volatiles (determined by TGA) and molecular O2 (determined base on TPD
spectra) present at the surface of SWCNT treated with different HNO3 concentrations at 473 K
(mathematical correlations: [HNO3] must be inserted in mol L-1)... 21
Figure 3.7 - WL observed after the HNO3 treatment at different concentrations: open symbols – 398 K;
full symbols – 473 K (mathematical correlations: [HNO3] must be inserted in mol L-1). ... 22
Figure 3.8 - TPD spectra for different SWCNT loads and treated at three different HNO3
concentrations: bold lines – 0.2g; non bold lines – 0.5g. Release of (a) CO and (b) CO2. ... 24
Figure 3.9 - Weight % O2 determined by TPD for the SWCNT treated at 473 K as a function of
[HNO3]/mSWCNT (mathematical correlation: [HNO3] must be inserted in mol L-1). ... 25
Figure 3.10 - Diffused reflectance UV-Vis spectra of the different catalysts. ... 26 Figure 3.11 - Dimensionless concentration profiles of p-MPh during photocatalytic oxidation reactions
using different catalysts. ... 28
Figure 3.12 - Absorption UV-Vis spectra of 10 mg L-1 solutions of p-MPh and p-CNPh. ... 29
Figure 3.13 - Dimensionless concentration profiles of p-CNPh during photocatalytic oxidation
List of Tables iii
List of Tables
Table 3.1 - Total amount of CO and CO2 calculated from the TPD spectra obtained for different HNO3
concentrations (393 and 473 K). ... 15
Table 3.2 - Quantification of volatiles, ash content (determined by TGA) and %O2 (determined by TPD)
for the SWCNT treated at different HNO3 concentrations (393 and 473 K)... 20
Table 3.3 - Total amount of CO and CO2 calculated from the TPD spectra and respective %O2 as
function of [HNO3]/mSWCNT and HNO3 concentration at 473 K. ... 23
Table 3.4 - Specific surface area (SBET) determined for the prepared materials and for P25. ... 27
Table 3.5 - TOC and p-MPh conversions at the end of irradiation (180 min). ... 29 Table 3.6 - TOC and p-CNPh conversions at the end of irradiation (180 min) and the pH of the final
Glossary iv
Glossary
NotationsC Pollutant concentration mol L-1
C0 Initial pollutant concentration mol L-1
SBET Specific Surface Area m2/g
TOC Total Organic Carbon mg L-1
Acronyms
CB Electronic Conduction Band
CNT Carbon Nanotubes
CVD Chemical Vapor Deposition
DR UV-Vis Diffuse Reflectance of UV-Vis
EDXS Energy-Dispersive X-ray Spectrometer analysis HPLC High Performance Liquid Chromatography
HRTEM High Resolution Transmission Electron Microscopy
HT Hydrothermal Treatment
KM Kubelka-Munk units
MWCNT Multi-Walled Carbon Nanotubes SAED Selected Area Electron Diffraction
SG Sol-Gel
SWCNT Single-Walled Carbon Nanotubes
TGA Thermogravimetric Analysis
TOC Total Organic Carbon
TPD Temperature Programmed Desorption
UV Ultra Violet Radiation
VB Electronic Valence Band
Vis Visible Radiation
Aim of the work and thesis outline 1
Aim of the work and thesis outline
Over the past 30 years, the number of people affected by droughts and water scarcity in Europe has increased about 20%. Higher standards of living are resulting in a growing consumption of water and, simultaneously, water quality concerns. The development of new clean technologies in this domain is becoming mandatory. Due to the fast advances on light related technologies, heterogeneous photocatalysis is being positioned as one of the most popular oxidation techniques in waste water treatment. Titanium dioxide (TiO2) is the most used catalyst in photocatalysis due to its high efficiency in oxidative degradation under UV light. However, TiO2 response in the visible range of the spectrum is limited because of its natural band-gap. This behaviour is truly a drawback when intending to use natural solar radiation in photocatalytic processes, since merely ca. 3-6 % of solar radiation consists of UV light. A possible solution is to modify TiO2, in order to obtain composite photocatalysts with an overall narrower band gap, thus taking benefit of the sun, as it is a natural source of light for the photocatalytic process. In fact, it has been reported in literature that TiO2 composites containing a carbon phase, in particular carbon nanotubes (CNT), can show visible response in photocatalysis. Ballistic transport properties of Single-Walled Carbon Nanotubes (SWCNT) can be especially advantageous by reducing the electron /hole (e—/h+) recombination rate in the photocatalytic process. In this context, the investigation undertaken for this thesis is focused on a first particular step of the development of SWCNT/TiO2 composite photocatalysts, which is the controlled modification of the SWCNT surface chemistry. The latter is thought to be important in the further integration of SWCNT on TiO2 matrices. Some composite materials are prepared and preliminary tests are performed on the photocatalytic oxidative degradation of two organic probe molecules (p-Methoxyphenol and p-Cyanophenol). It is worth to note that this work is at the starting point of a broader European project and the research will progress with further optimization of several parameters.
This thesis includes 5 mains sections, being the first one an introduction to the main topics: photocatalysis and composite CNT/TiO2 photocatalysts and functionalization of SWCNT. Section 2 describes the experimental procedure, characterization methods and analytical techniques employed on functionalization of SWCNT, preparation of the SWCNT/TiO2 composites and photocatalytic tests. The results obtained are presented and discussed on section 3. Sections 4 and 5 are respectively dedicated to the final conclusions and suggestions for future work.
Introduction 2
1 Introduction
1.1 Photocatalysis and CNT/TiO
2composite catalysts
Growing water quality concerns have been resulting in strictly legislation on the emission of several harmful substances to water courses. The EU Commission Services have recently proposed a directive defining new Environmental Quality Standards (EQS) for hazardous priority substances [1]. Consequently, new clean technologies have been developed in the context of waste water treatment. Heterogeneous photocatalysis is earning a growing relevance amongst several oxidation techniques, due to the last advances in light related technologies [2-4].
The photocatalytic degradation of an organic pollutant is a chemical process in which various components take part: a reactant, a photon with the appropriated energy, a catalyst surface (normally a semiconductor) and a strong oxidizing agent [5]. Some misconceptions are involved around photocatalysis like the role of light in the reaction mechanism. It is worth to emphasize that light acts as a reactant and not as a catalyst. Heterogeneous photocatalysis is a catalytic process which includes several sequential steps: diffusion of the reactants from the bulk phase to the catalyst surface, adsorption of at least one of the reactants, reaction in the adsorbed phase and desorption of the products from the catalyst surface [5]. When photons are firstly absorbed by the substrate molecule, the process is named as photocatalytic reaction or catalyzed photoreaction. On the other hand, if the irradiated light is absorbed firstly by the catalyst, the process is referred as sensitized photoreaction [6]. The interest on searching for the optimum catalyst in photocatalytic applications requires that the process occurs under a photosensitized reaction, with no caption of light by the substrate molecule. The intensity of the light irradiated must be enough to overcome the energy of the band gap of the catalyst. Since the catalyst is irradiated with higher energy than that of the band gap, the electrons become excited from the valence band (VB, Highest Occupied Molecular Orbital - HOMO) to the conduction band (CB, Lowest Unoccupied Molecular Orbital - LUMO) generating electron/hole (e—/h+) pairs. These agents will get involved in a sequence of redox reactions generating highly oxidizing species like hydroxyl radicals (HO) and superoxide
radicals (O2 —).
Titanium dioxide (TiO2) is the preferred catalyst to be used in photocatalysis not just because of its high efficiency producing e—/h+ pairs under UV light but also for other important reasons: it is a chemically stable and a low cost material. Photocatalytic active TiO2 powders can be easily synthesized by means of the sol-gel method [7, 8]. This preparation technique
Introduction 3
involves the use of a metal alkoxide as a precursor which is dissolved in an alcohol. The alkoxide is hydrolyzed and then the condensation of the polymeric chains takes place. The resulting gel is allowed to dry under ambient or supercritical conditions forming a xerogel or an aerogel, respectively. Further calcination helps to eliminate the remaining solvent and, at different calcination temperatures, distinct crystalline phases can be attained. Very homogeneous materials are obtained using the sol-gel synthesis procedure and the possibility to include other phases in the titania matrix is an additional advantage. There are three polymorphs of TiO2 that can be found in nature: anatase (Fig. 1.1a), rutile (Fig. 1.1b) and brookite (Fig. 1.1c).
Figure 1.1- Crystal structures of anatase (a) rutile (b) and brookite (c) [9].
The commercial TiO2 most used in photocatalytic applications is AEROXIDE® P25 which is not pure anatase but a mixture of ca. 80% of anatase and 20% of rutile crystalline phases. The photoefficiency of a certain material is attributed not just to the crystalline phase composition. It must be pointed out that thin films of amorphous TiO2 have also shown to be photocatalytic active [10]. Other characteristics like particle size are also relevant [11]. Bare TiO2 is broadly used as photocatalyst. Notwithstanding, its band gap energy of 3.2eV is such high that merely UV light is able to excite the electrons from the VB to the CB to form the e—/h+ pairs. Considering that UV light is merely ca. 3-6 % of sun radiation, the band gap energy of TiO2 appears to be a drawback when the objective is to use the sun light in photocatalytic applications [12]. The development of TiO2-based catalysts with an overall narrower band gap appears to be an interesting issue, reducing the operating costs of the process by using sun radiation, as it is a natural source of light.
Some previous investigations reported in literature have already demonstrated that TiO2 composites using carbon materials, such as CNT, have, in fact, visible response in the photocatalytic oxidative degradation of organic pollutants [13-15]. Besides the photosensitizer effect of CNT on CNT/TiO2 composites, these materials can also act as a
Introduction 4
dispersing agent of TiO2 particles and enhance the specific surface area of the resulting composite.
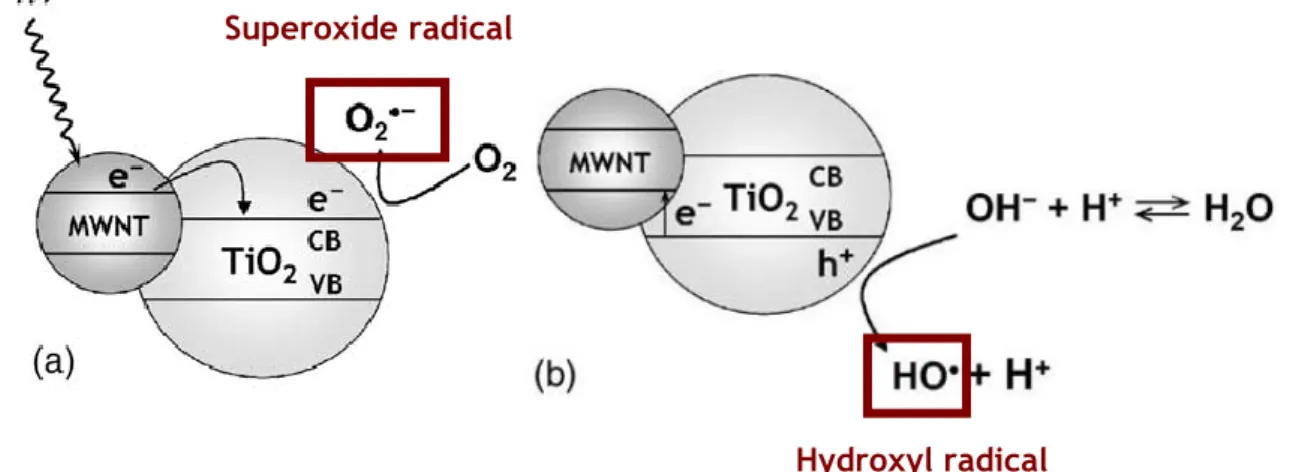
The mechanism that is believed to operate in a sensitized photoreaction with CNT/TiO2 composites is partially represented in the schemes of Fig. 1.2a and 1.2b. It must be noticed that the schemes does not show all the reactions involved, but just intends to illustrate the generation of the superoxide (a) and hydroxyl (b) oxidizing agents. The composite catalyst here represented uses Multi-Walled Carbon Nanotubes (MWCNT), instead of SWCNT, but the general idea is the same.
Figure 1.2 - MWCNT acting as photosensitizer in the composite catalyst: (a) following photon absorption, an electron is injected into the CB of TiO2 semiconductor; (b) the electron is back-transferred to MWCNT with the formation of a hole in the VB of TiO2 semiconductor and reduction of the so formed hole by adsorbed OH— (adapted from [13]).
The mechanism begins with the absorption of visible light by CNT and the excited electrons are transferred to the CB of TiO2. If the diffusion of the e—/h+ pairs to the photocatalyst surface is more effective than e—/h+ recombination and molecular oxygen present in the reaction medium is abundant, it will be reduced by the excited e— at the surface of TiO
2 to form the superoxide radical. On the other hand, electrons on the VB of TiO2 can migrate to the surface of CNT generating positive holes which will oxidize the hydroxide anions to form hydroxyl radicals. The formed oxidizing agents will initiate the photodegradation of organic pollutants.
It is believed that the chemical interaction between CNT and TiO2, and subsequent photocatalytic activity, depends on the surface chemistry of CNT during the preparation of CNT/TiO2 composites. In this context, the next section is focused on CNT and their surface chemistry.
Superoxide radical
Introduction 5
1.2 CNT and surface chemistry
CNT are structures of the highest interest due to their unique properties, such as highly mechanical resistance and thermal stability under oxidizing atmosphere conditions [16, 17]. Depending on the way in which the graphene layers are rolled up, CNT have metallic features or electrical semiconductive properties [18]. Since 1991, the investigation on these materials became recurrent with the first steps on the synthesis of MWCNT by Iijima [19]. Single-shell structures were required to finely understand their properties and two years latter, the successful synthesis of SWCNT by Arc-Discharge was reported by both Iijima et al. [20] and Bethune et al. [21].
Numerous studies have been oriented to the application of CNT as support materials in catalysis, namely in hydrogenation reactions, hydrocarbons decomposition or development of fuel cell electrocatalysts [17]. Several other applications have been reviewed [22] and some examples are energy storage, sensors, conductive and high-strength composites.
Ideal CNT are made of one (SWCNT) or more (MWCNT) graphene sheets with hexagonal display of sp2 hybridized carbon atoms. However, CNT are not such perfect structures as they were thought to be. Several properties, which were studied for ideal CNT, depending mainly on their diameter and chirality are also hardly affected by the presence of defects such as pentagons, heptagons, vacancies or dopant species [23]. New potential applications are being investigated by introducing defects and modifying the surface chemistry of CNT [24, 25]. Depending on the required application, several chemical agents can be introduced at the surface of CNT like alkali metals [26], salen complexes [27] or amines to form aniline composites [28]. Notwithstanding, since CNT are considered as almost inert substrates, they are previously subjected to oxidizing treatments and, depending on the conditions and the oxidizing agents used, unlike resulting surface chemistry and structural integrity modifications on distinct levels are observed [28-33].
The chemical surface modification of carbon materials using nitric acid (HNO3) is not a recent issue [34-41]. It has been performed over distinct carbon materials like activated carbons [40, 41], carbon xerogels [42, 43], graphite [44] or ordered mesoporous carbons (OMC) [45, 46]. CNT are often functionalized using oxidative liquid phase treatments with HNO3 [47] to introduce oxygenated functionalities (carboxylic acids, lactones, anhydrides, phenols, carbonyls or quinones) resulting in much higher reactive substrates than pristine CNT.
The introduction of oxygen-containing groups on the surface of CNT enhances their solubility in aqueous or organic solvents and can reduce the van der Waals interactions between distinct CNT, promoting the separation of nanotube bundles into individual tubes. In addition,
Introduction 6
HNO3 is known to be selective on the oxidation of amorphous carbon [48] and can be used as a pre-treatment to provide CNT with a homogeneous surface.
Studies performed over SWCNT, seeking for the effect of chemical oxidation on their structure, show that functionalization by means of HNO3 causes the opening of the tube caps but basically retain their pristine electronic and mechanical properties. No significant defects are additionally produced, thus the chemical modification mostly occurs at the opened caps and at the already existing defects along the sidewall of SWCNT [25].
HNO3 treatments have been extensively used at very high concentrations using boiling methods [29], which are very efficient for the introduction of a high density of oxygen-containing groups. Nevertheless, it is worth to say that usually they are not applied in a controlled mode, since correlations between the degree of functionalization and the conditions used are missing. Given the relevance of the functionalization step in the preparation of different carbon based materials for numerous applications, the development of methods for the controlled modification of their surface chemistry is required.
Recently, a new methodology was developed in our group for the controlled functionalization of carbon xerogels based on HNO3 hydrothermal oxidation [49]. In the present work, the surface functionalization of SWCNT is drawn to tailor the introduction of oxygenated functionalities using the same HNO3 hydrothermal oxidation procedure. Both type of preferential groups formed and changes on textural properties are assessed under different HNO3 concentrations (0.01 – 0.3 mol L-1) and at two temperatures (393 and 473 K). A comparison between structural and chemical modifications observed for SWCNT and those presented by Silva et al. [49] for carbon xerogels is addressed.
The controlled functionalization of CNT is the primary step for the further preparation and optimization of SWCNT/TiO2 photocatalysts since the chemical interaction between both materials is expected to be enhanced during the formation of the composite.
Experimental 7
2 Experimental
2.1 Functionalization of SWCNT
Pristine SWCNT synthesized by Chemical Vapor Deposition (CVD) were purchased from Shenzhen Nanotechnologies Co. Ltd. (NTP) with the following manufacturer data: purity of CNT > 90%, purity of SWCNT > 50%, main range of diameter < 2 nm, length = 5 – 15 μm, amorphous carbon < 5%, ash content 2 wt%. The as received material is referred as pristine SWCNT in this work. It is important to note that the sample is mostly constituted by SWCNT but the exact amount of SWCNT is unknown since it was not provided by the manufacturer. The surface chemistry of these SWCNT was modified by introducing different oxygenated functionalities through the HNO3 hydrothermal oxidation approach.
2.1.1 HNO3 Hydrothermal Oxidation
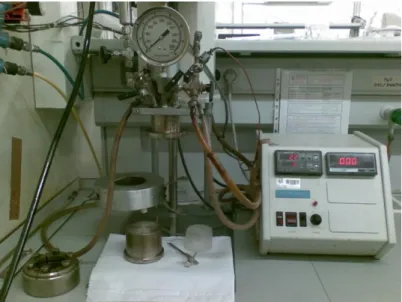
The functionalization of SWCNT followed an experimental procedure described elsewhere [49]. Accordingly, a 160 mL autoclave (Parr Instruments, USA Mod. 4564) equipped with a temperature controller and a turbine-type agitation system was used (Fig. 2.1).
Figure 2.1 - Autoclave and temperature controller used in the functionalization of the SWCNT.
75 mL of a HNO3 solution (concentrations ranging from 0.01 to 0.3 mol L-1) prepared from HNO3 65 wt % (Fluka) were transferred to the vessel and a certain amount of pristine SWCNT was added (0.2 or 0.5 g). The autoclave was sealed and the solution was flushed with nitrogen for 5 min to ensure removal of dissolved oxygen. The system was further pressurized with
Experimental 8
0.5 MPa of N2, stirred at 300 rpm, and heated until the desired temperature (393 or 473 K) at autogeneous pressure. After 2h of operation, the autoclave was allowed to cool until ambient temperature and then depressurized. The recovered SWCNT were washed several times with distilled water until a neutral pH was attained and dried over night at 393 K. Additionally, a blank test with distilled water instead of the HNO3 solution was performed.
2.1.2 SWCNT Characterization
Temperature Programmed Desorption (TPD) analysis was carried out using an AMI-200 Catalyst Characterization Instrument (Altamira Instruments) equipped with a quadruple mass spectrometer (Ametek, Mod. Dymaxion). The sample (0.1 g) was placed in a U-shaped quartz tube and heated at 5 K min-1 in an electrical furnace under a constant flow of 25 cm3 min-1 (STP) of helium, used as carrier gas. The concentration of CO and CO2 released was determined using the calibration performed at the end of each analysis.
The amount of volatiles, fixed carbon and ash content was assessed for each sample by Thermogravimetric Analysis (TGA) using a Mettler M3 balance. Firstly, humidity was removed at a constant temperature of 383 K under N2. Then, the samples were heated at 25 K min-1 until reach the temperature of 1173 K. The weight change observed during this stage allows the calculation of the amount of volatile compounds at the surface. When a constant weight was established, the amount of fixed carbon was determined and the gas feed was turned to O2 until a new stable weight was reached. At these conditions, the entire organic fraction of the sample is burned and the remaining material corresponds to the ash content.
The specific surface area (SBET) of the materials was determined by multipoint analysis of N2 adsorption isotherms at 77 K in the relative pressure range from 0.05 to 0.3 using BET method, with a Quantachrome NOVA 4200e multi-station apparatus. Each sample was firstly degassed for 6 h at 573 K.
A JEOL 2010F analytical electron microscope, equipped with a Schottky field-emission gun (FEG) was used for high-resolution transmission electron microscopy (HRTEM) investigations. The samples for HRTEM were prepared from the diluted suspension of nanoparticles in ethanol. A drop of suspension was placed on a lacey carbon-coated Ni grid and allowed to dry in air.
2.2 Preparation and characterization of bare TiO
2and hybrid
SWCNT/TiO
2photocatalysts
The prepared materials to be used in photocatalytic experiments were synthesized by means of a modified sol-gel method. Some of these materials were further subjected to a hydrothermal treatment at 473 K using a 0.1 mol L-1 HNO
Experimental 9
2.2.1 Acid-catalyzed Sol-Gel Method
The preparation of TiO2 and SWCNT/TiO2 composite photocatalysts followed an experimental procedure described elsewhere [50]. The method consists in a modified acid-catalyzed sol-gel method (hereafter referred as SG) using an alkoxide precursor: 0.0125 mol of Ti(OC3H7)4 (Aldrich, 97%) was dissolved in 25 mL of ethyl alcohol (Panreac, 99.5%) and the solution was stirred magnetically for 30 min; at this time, 0.2 mL of HNO3 (Fluka, 65 wt.%) was added. In particular for SWCNT/TiO2 composites, 2.5 mg of SWCNT were introduced into the Ti(OC3H7)4 ethanol solution. The mixture was loosely covered and kept stirring until the homogeneous gel formed. The gel was aged in air for several days. Then the xerogel was crushed into a fine powder and dried at room temperature. The powder was calcined at 673 K in a flow of nitrogen for 2 h to obtain pure anatase crystalline phase. SWCNT were used both as received and functionalized with 0.1 mol L-1 of HNO
3. The composites that were synthesized with functionalized SWCNT are labeled as 0.1SW/TiO2 and SW/TiO2 is for composites when pristine SWCNT were used.
2.2.2 Hydrothermal Treatment
Some selected materials were subjected to a hydrothermal treatment (hereafter referred as HT) in the same autoclave used to functionalize the SWCNT. One gram of TiO2 previously prepared by the SG method was introduced into the autoclave together with 2.5 mg of SWCNT. 75 mL of a 0.1 mol L-1 HNO
3 solution were transferred to the vessel. The treatment was performed exactly in the same conditions that were applied in the SWCNT functionalization (section 2.2.1). It can be considered that the HT comprised the in situ functionalization of the SWCNT with HNO3. For comparison purposes, a composite was prepared using the commercial AEROXIDE® TiO
2 P25 instead of the TiO2 prepared by SG, using the same experimental procedure for the hydrothermal treatment. The two different materials are hereafter labeled as SW/TiO2 – HT and P25/TiO2.
2.2.3 Photocatalysts Characterization
The diffuse reflectance UV-Vis (DR UV-Vis) spectrum (200 – 800 nm) of all the materials was recorded on a JASCO V-650 UV-Vis spectrophotometer, with a double monochromator, double beam optical system. The spectrophotometer is equipped with an integrating sphere attachment (JASCO ISV-469). The reflectance spectra were converted by the equipment software (JASCO) to equivalent absorption Kubelka–Munk units which are linearly related to the concentration of a diluted sample of infinite tickness (i.e., a sample for each no appreciable changes in spectrum are observed if the thickness is increased). To avoid a decrease on the measured absorbance, the powders were not diluted in any matrix.
Experimental 10
The SBET of P25 and the obtained materials prepared both by SG and HT was assessed using the same analytical procedure described in section 2.2.2.
2.3 Photocatalytic Oxidative Degradation of Organic Pollutants
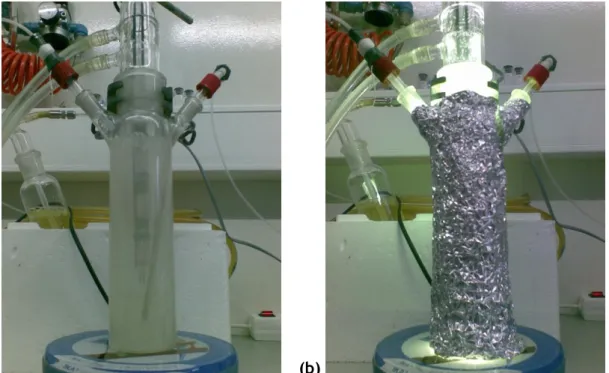
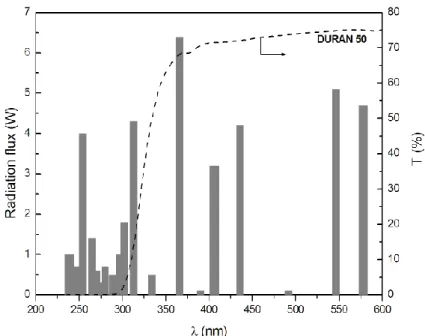
The photocatalytic experiments were conducted in a glass-immersion photochemical reactor equipped with a UV–Vis Heraeus TQ 150 medium pressure mercury vapor lamp located axially and held in a quartz immersion tube and a DURAN 50 glass jacket (Fig. 2.2).
(a) (b)
Figure 2.2 - Photoreactor employed on the photocatalytic experiments with the lamp (a) off and (b) on.
The DURAN 50 glass jacket acts as an optical cut-off of UVB and UVC radiation. The main
resulting emission lines are 316, 366, 405, 436 nm and above (Fig. 2.3). Inside the glass jacket there was water circulating to cool the irradiation source and cancel the infrared stray radiation, preventing any heating of the suspension.
Two different pollutants were tested for the photocatalytic oxidative degradation: p-Methoxyphenol (p-MPh) and p-Cyanophenol (p-CNPh). Substituted phenols are commonly present in many industrial wastewaters including those coming from pesticides, dyes, pharmaceuticals and petrochemical industries. The absorption UV-Vis spectra (250 – 500 nm) of 10 mg L-1 solutions of both p-MPh and p-CNPh were recorded in the same spectrophotometer used in the photocatalysts characterization (section 2.2.3).
Experimental 11
Figure 2.3 - Radiation flux of Heraeus TQ 150 immersion lamp and transmission Spectrum of the DURAN 50 filter (manufacturer data).
A 200 mL min-1 oxygen/argon (20 vol.% of oxygen) stream was continuously supplied to the reactor, previously charged with 250 mL of the model pollutant solution (100 mg L-1) and with a fixed amount of TiO2 in the catalytic tests (1 g L-1). Before turning on the lamp, the suspensions were magnetically stirred for 30 min to establish an adsorption–desorption equilibrium and the reaction was carried out during the next 180 min. Samples were periodically withdrawn and centrifuged prior to analysis to compound conversion, in order to separate any suspended solids.
These samples were then analyzed by High Liquid Performance Chromatography (HPLC) using a Hitachi Elite LaChrom instrument equipped with a Diode Array Detector (L-2450) and a solvent delivery pump (L-2130) at a flow rate of 1 mL min-1. The stationary phase consisted in a Hydrosphere C18 column (250 mm x 4.6 mm, 5 m particles) with a gradient method. At first, the column was equilibrated with a A:B (70:30) mixture of 20 mmol L-1 NaH
2PO4 at pH=2.8 (A) and acetonitrile (B), followed by a linear gradient run to A:B (30:70) in 13 min and finally with isocratic elution during 2 min.
Results and Discussion 12
3 Results and Discussion
3.1 Functionalization of SWCNT
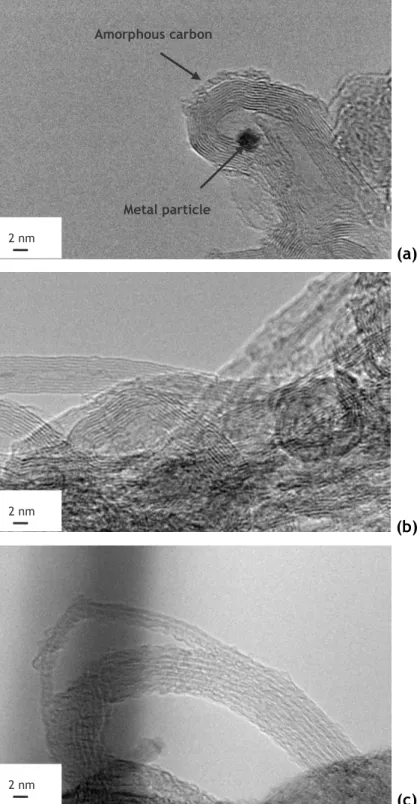
A representative HRTEM micrograph of the pristine SWCNT sample is shown in Fig. 3.1. Both SWCNT and MWCNT were observed and it seems that the SWCNT tends to exist as bundles, which is in accordance with what is reported in literature [20].
(a)
(b)
(c)
Figure 3.1 - HRTEM micrographs of (a) the pristine SWCNT sample and after treatment with (b) 0.1 mol L-1 and (c) 0.3 mol L-1 of HNO
3. 2 nm 2 nm Amorphous carbon Metal particle 2 nm
Results and Discussion 13
Metal particles with ca. 2 nm left from the CNT catalytic synthesis can be observed. The presence of this inorganic material contributes for the ash content of the samples. Also some amorphous carbon is visible at the surface of the nanotubes.
Fig. 3.1b shows a HRTEM micrograph of the sample treated with 0.1mol L-1 of HNO
3 at 473 K. In general, HNO3 treatment seems to clean, to some extent, both amorphous carbon and inorganic material.
Stronger oxidizing conditions affect the structural integrity of these nanotubes, as can be observed in Fig. 3.1c. This is intrinsic of the functionalization process, since oxygenated functionalities can only be introduced if some defects are present over the graphite surface. Distinct oxygenated groups that are chemically bonded to the surface of CNT, upon oxidizing treatments, can be decomposed upon heating at different temperatures and released as CO or CO2 [51, 52]. In Fig. 3.2a and 3.2b are represented the TPD spectra corresponding to the groups evolved as CO and CO2, respectively, from the surface of pristine SWCNT and treated under different HNO3 concentrations at 473 K.
The amount of oxygenated functionalities introduced on the surface of SWCNT is strongly dependent on the concentration of HNO3. Comparing the curves obtained for the pristine SWCNT and for the blank test carried out with water instead of HNO3, it is visible that no considerable amount of groups is present at the surface. This indicates that the introduction of oxygen-containing groups is totally ascribed to the presence of nitric acid instead of some effect of water at high temperatures. By increasing the oxidizing conditions, the amount of groups evolved as CO and CO2 continuously increases. Both Fig. 3.2a and 3.2b suggest that a good correspondence between the concentration of the oxygenated functionalities and the concentration of HNO3 exist.
Results and Discussion 14 300 500 700 900 1100 1300 0.0 0.5 1.0 1.5 0.3 0.2 0.1 0.05 0.03 0.01 0 (Blank) 0 - Pristine [HNO 3 ] (m ol L -1 ) T (K) C O ( m o l g -1 s -1 ) (a) 300 500 700 900 1100 1300 0.0 0.1 0.2 0.3 0.4 0.5 0.3 0.2 0.1 0.05 0.03 0.01 0 (Blank) 0 - Pristine [HNO 3] (mol L -1 ) T (K) CO 2 ( m o l g -1 s -1 ) (b) Figure 3.2 - TPD spectra for the pristine SWCNT and treated under different HNO3
concentrations at 473 K: (a) CO release; (b) CO2 release.
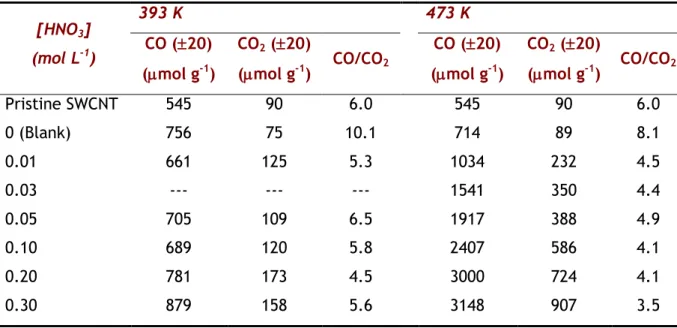
The measured concentrations of CO and CO2 for both temperatures tested are gathered on Table 3.1. As previously observed in the TPD spectra, the amount of groups evolved as CO was considerably higher than the one for the moieties evolved as CO2. Accordingly, the ratio
Results and Discussion 15
CO/CO2 was always higher than unity. This ratio generally decreased while increasing the HNO3 concentrations.
Table 3.1 - Total amount of CO and CO2 calculated from the TPD spectra obtained for different HNO3 concentrations (393 and 473 K).
[HNO3] (mol L-1) 393 K 473 K CO (20) (mol g-1) CO2 (20) (mol g-1) CO/CO2 CO (20) (mol g-1) CO2 (20) (mol g-1) CO/CO2 Pristine SWCNT 545 90 6.0 545 90 6.0 0 (Blank) 756 75 10.1 714 89 8.1 0.01 661 125 5.3 1034 232 4.5 0.03 --- --- --- 1541 350 4.4 0.05 705 109 6.5 1917 388 4.9 0.10 689 120 5.8 2407 586 4.1 0.20 781 173 4.5 3000 724 4.1 0.30 879 158 5.6 3148 907 3.5
To quantify the correlation between the amount of oxygenated groups and the HNO3 concentration used, the area under the spectrum was plotted against the HNO3 concentration. In Fig. 3.3 are represented the two curves obtained for CO and CO2. In addition, in order to test the influence of temperature on the functionalization process, the range of HNO3 concentrations used at 473 K was also tested over pristine SWCNT at 393 K and the results are shown in the same figure.
It becomes clear that the functionalization degree is not only dependent on the HNO3 concentration but also on the temperature used. Surface groups are not introduced on SWCNT at 393 K even at the highest HNO3 concentrations tested. The present results suggest that an activation energy is involved in this method, requiring a certain temperature to initiate the functionalization process. For the temperature of 473 K, the experimental data are quite well adjusted to a single exponential function, as shown in Fig. 3.3.
Comparing the results obtained in this work with those previously obtained in our group for a carbon xerogel using the same functionalization method [49], a similar behaviour is observed, suggesting that an activation energy must be truly associated with the functionalization process. In that study a maximum functionalization degree is attained for 393 K but, when increasing the temperature for 473 K, the concentration of oxygenated functionalities introduced on the surface of the carbon xerogel also increases and no plateau was observed for the highest HNO3 concentrations.
Results and Discussion 16 0.00 0.05 0.10 0.15 0.20 0.25 0.30 0 1000 2000 3000 4000 [HNO 3] (mol L -1 ) , CO , CO 2
[CO
x]
(
mol g
-1)
[HNO 3] (mol L -1 )[CO] = 3216 - 2467 exp ( - 11.82 [HNO
3])
r2 = 0.998
[CO
2] = 942 - 802 exp ( - 8.06 [HNO3])
r2 = 0.967
Figure 3.3 - Evolution of the amount of CO and CO2 with HNO3 concentration: open symbols – 393 K; full symbols – 473 K (mathematical correlations: [HNO3] must be inserted in mol L-1
for a [COx] in
mol g-1).The amount of oxygen-containing groups introduced on the surface of carbon xerogels was higher than that attained with the SWCNT using the same temperature and HNO3 concentrations. The difference at the same oxidizing conditions was not constant in the whole range of the HNO3 concentration, increasing as the HNO3 concentration increases. This trend seems to be intrinsically related with the distinct morphology of both carbon materials. It is noteworthy that the concept of porosity is quite different when considering carbon xerogels or carbon nanotubes. Carbon xerogels present a type of porosity similar to that of well known activated carbons. The available area for the introduction of the oxygenated functionalities is on the micro, meso and macropores. The porosity of CNT is usually associated to a bundle and not to a single carbon nanotube, since the graphite layers are non porous. The porosity of a bundle of CNT is the result of different contributions [47]: i) the area available at the surface of the bundle, ii) the existing area between distinct individual carbon nanotubes, which is called intersticial and iii) the area inside the pores of the bundle, which corresponds to the inner cavities of the opened CNT. The degree of functionalization must be then always compared taking into account the specific structure of each material.
The BET surface area of pristine and treated SWCNT at 473 K was measured. Pristine SWCNT has a SBET of 370 m2/g ( 5 m2/g) and the HNO3 hydrothermal treatment, as expected, slightly
Results and Discussion 17
increased the surface area to near by 400 m2/g ( 5 m2/g). Acidic treatments are known to open the end caps of CNT, which can contribute for the small raise in SBET (ca. 8 %).
However, when the acidic treatment was carried out over carbon xerogels, the area increased about 30% when high HNO3 concentrations were used and this was ascribed to the development of the microporosity during the functionalization process [49]. In the case of the carbon xerogel, the introduction of the oxygen-containing groups took place over all the available surface area, whereas for CNT the defects created at the surface of the graphite layers are the single positions which present some chemical reactivity to form the desired functionalities. Therefore, the nature of carbon material should be taken into account when predicting the functionalization degree to be achieved with the HNO3 hydrothermal treatment, since the morphology seems to be influent on the pathway and the yield of this chemical process.
Considering the temperatures at which different groups are evolved as CO and CO2 upon heating, the concentration of each group can be determined by deconvolution of TPD spectra [51, 52]. As example, in Fig. 3.4a and 3.4b are represented the deconvolution of the curves of CO2 and CO, respectively, obtained for the oxidation at 473 K using 0.3 mol L-1 of HNO3. The distinct oxygenated functionalities are identified by the temperature at which they are released. It is relevant to point out that for the deconvolution process some assumptions were made accordingly to a method reported in literature [52]. For instance, carboxylic anhydrides are supposed to decompose both as CO and CO2. Once fixed the temperature at which these groups were released as CO2, the correspondent peak on CO spectrum was defined. The concentration of each group is determined by calculating the area of the correspondent peak.
Results and Discussion 18 300 500 700 900 1100 1300 0.0 0.2 0.4 0.6 0.8 1.0 1.2 1.4 Carbonyls / Quinones Phenols Carboxylic Anhydrides
CO
(
m
ol
g
-1s
-1)
T (K)
(a) 300 500 700 900 1100 1300 0.00 0.05 0.10 0.15 0.20 0.25CO
2 (
m
ol
g
-1s
-1)
Carboxylic Anhydrides LactonesT (K)
Carboxylic Acids (b) Figure 3.4 - Deconvolution of TPD spectra for the SWCNT treated with 0.3 mol L-1 of HNO3 at 473 K: (a) CO spectrum; (b) CO2 spectrum.
The main groups identified on CO2 spectrum were carboxylic acids and lactones. The oxygenated moieties observed at the highest concentrations on the surface of SWCNT were phenols, as revealed by the CO spectrum. Also carbonyls or quinones were identified, but in lower amounts. All the spectra curves were deconvoluted using the same approach and the
Results and Discussion 19
concentrations of each moiety, released as CO and CO2, is respectively represented as a function of the HNO3 concentration in Fig. 3.5a and 3.5b.
0.00 0.05 0.10 0.15 0.20 0.25 0.30 0 100 200 300 400 500
CO
(
mol
g
-1)
Phenols Carbonyl / Quinones Carboxylic Anhydrides [HNO 3] (mol L -1 )CO
(
mol
g
-1)
500 1000 1500 2000 2500 3000 (a) 0.00 0.05 0.10 0.15 0.20 0.25 0.30 0 100 200 300 400 500CO
2(
mol
g
-1)
[HNO 3] (mol L -1 ) Carboxylic Acids Lactones Carboxylic Anhydrides (b) Figure 3.5 - Evolution of the concentration of specific oxygenated groups created at theResults and Discussion 20
As found for the total amount of groups at the surface of SWCNT, an exponential function also fits the results obtained for the concentration of each single oxygenated moiety. It is relevant to note that the concentration of all functionalities increase with HNO3 concentration except for the carbonyl/quinones groups. The mechanism proposed in the literature reports that the formation of oxygen-containing surface groups seems to follow a progressive pathway starting with the creation of phenols (-OH) and carbonyl/quinones (C=O) being further developed into carboxylic functionalities (-COOH) if the material is exposed to oxidizing conditions for enough time to allow their formation [48, 53, 54]. Under our oxidizing conditions, the development of phenols is obvious but their conversion into other functionalities is not clear. However, the formation of carboxylic groups seems to be a consequence of the carbonyl/quinones firstly created at the surface of the SWCNT.
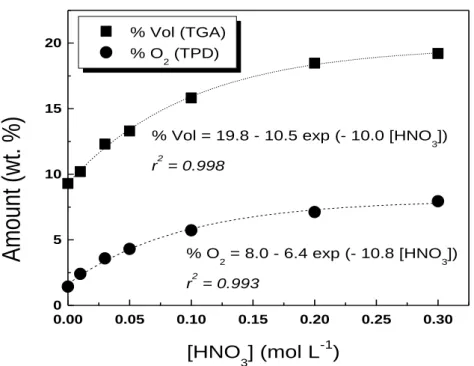
The weight percentage of the total amount of molecular oxygen released (% O2) as CO and CO2 was calculated based on the concentrations determined by TPD analysis. The results are gathered in Table 3.2 for both temperatures tested (393 and 473 K) and represented in Fig. 3.6 for the temperature of 473 K.
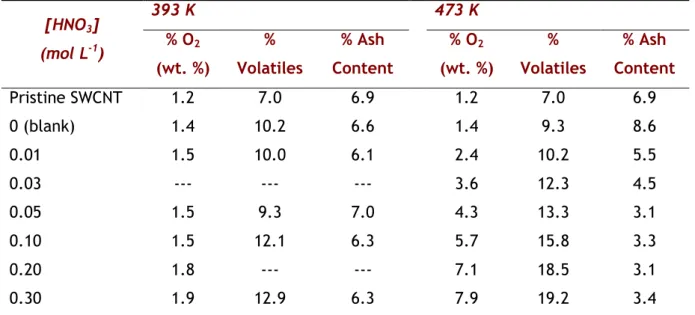
Table 3.2 - Quantification of volatiles, ash content (determined by TGA) and %O2 (determined by TPD) for the SWCNT treated at different HNO3 concentrations (393 and 473 K).
[HNO3] (mol L-1) 393 K 473 K % O2 (wt. %) % Volatiles % Ash Content % O2 (wt. %) % Volatiles % Ash Content Pristine SWCNT 1.2 7.0 6.9 1.2 7.0 6.9 0 (blank) 1.4 10.2 6.6 1.4 9.3 8.6 0.01 1.5 10.0 6.1 2.4 10.2 5.5 0.03 --- --- --- 3.6 12.3 4.5 0.05 1.5 9.3 7.0 4.3 13.3 3.1 0.10 1.5 12.1 6.3 5.7 15.8 3.3 0.20 1.8 --- --- 7.1 18.5 3.1 0.30 1.9 12.9 6.3 7.9 19.2 3.4
The total amount of molecular O2 is representative of the total concentration of oxygenated groups introduced on the surface of SWCNT. As expected, the trend of the O2 released corroborates the TPD results. For the temperature of 393 K, no considerable surface modification was observed. Contrarily, at 473 K, the total amount of oxygenated groups increases progressively with the HNO3 concentration. Despite the poor surface chemistry of pristine SWCNT with an O2 concentration of 1.2 wt. %, the HNO3 hydrothermal treatment is
Results and Discussion 21
able to provoke a considerable surface modification, introducing 7.9 wt. % of molecular O2 at the strongest oxidizing conditions tested (0.3 mol L-1 of HNO
3).
Weight % of volatiles and ash content was determined by TGA (Table 3.2). The temperature of 393 K is not sufficient neither to modify the surface of CNT nor to remove the ash content present in the material. Since volatiles correspond mainly to the oxygenated functionalities that are released during TGA, the results at 473 K are once again fitted to a single exponential function and follow the same trend as found for the evolution of molecular oxygen (Fig. 3.6). The difference observed between the amount of volatiles and the molecular oxygen can be related to some nitrogen functionalities that contribute to the weight loss during TGA but are not measured as CO or as CO2 during TPD analysis. At variance to what happened at 393 K, the HNO3 treatment at 473 K was able to remove up to 50% of the ash content of pristine SWCNT (Table 3.2). The ash content decreased from 6.9% for the original material to around 3.1-3.4 % for SWCNT treated with HNO3 concentrations above 0.05 mol L-1, in agreement with the previous HRTEM observations. Therefore, temperature and HNO3 concentration are key parameters for the activation of the functionalization process as well as for the removal of the inorganic material that remains in the samples from the synthesis of SWCNT, which are produced by CVD.
0.00 0.05 0.10 0.15 0.20 0.25 0.30 0 5 10 15 20 [HNO 3] (mol L -1 ) % O 2 = 8.0 - 6.4 exp (- 10.8 [HNO3]) r2 = 0.993 % Vol (TGA) % O 2 (TPD)
Am
oun
t (wt
. %
)
% Vol = 19.8 - 10.5 exp (- 10.0 [HNO
3])
r2 = 0.998
Figure 3.6 - Amount of volatiles (determined by TGA) and molecular O2 (determined base on TPD spectra) present at the surface of SWCNT treated with different HNO3 concentrations at
Results and Discussion 22
When comparing the functionalization of SWCNT with carbon xerogels using the same method and experimental conditions, it is noticeable that the functionalization degree in terms of % O2 is about 2.5 times higher for carbon xerogels (at a concentration of 0.3 mol L-1 HNO3). As previously discussed, the difference observed may be ascribed to the structural properties of the materials. CNT are very well organized carbon materials with perfect graphite layers and thus poor reactive due to the high chemical stability. In this case, the introduction of oxygenated functionalities proceeds over the defects that are introduced during HNO3 hydrothermal treatment. On the other hand, carbon xerogels are structures with a totally distinct morphology, like a bulk material with a developed porosity. In this case, the carbon structure is not so perfectly organized like in CNT, thus providing more sites for the attachment of the oxygenated moieties. Therefore, the reactivity of carbon xerogels is supposed to be much higher than the one of CNT, which can explain the difference on the functionalization degrees achieved with the current HNO3 hydrothermal treatment. However, in both cases, the % O2 is correlated with the HNO3 concentration by an exponential function as presented for SWCNT in Fig. 3.6.
During each HNO3 hydrothermal run, it was verified that the SWCNT weight loss (WL) varied significantly with the conditions used. WL means the difference between the weight of SWCNT introduced into the autoclave (0.2 g, in this case) and the final weight of the recovered material after the HNO3 hydrothermal treatment, given in percentage. In Fig. 3.7 is represented the WL observed as a function of HNO3 concentration for both 393 and 473 K.
0.00 0.05 0.10 0.15 0.20 0.25 0.30 0 10 20 30 40 50 60
WL (%)
[HNO
3] (mol L
-1)
WL = 52.29 - 47.29 exp (- 7.62 [HNO 3]) r2 = 0.995Figure 3.7 - WL observed after the HNO3 treatment at different concentrations: open symbols – 398 K; full symbols – 473 K (mathematical correlations: [HNO3] must be inserted in mol L-1).
Results and Discussion 23
For the temperature of 393 K, the WL observed with the increase of the HNO3 concentration is negligible. However, at 473 K the oxidizing conditions are such that the WL varies significantly with the used HNO3 concentration (5-50 %). As observed for the amount of oxygenated functionalities introduced in the surface of SWCNT, an exponential function fits the WL experimental data, suggesting that both phenomena are correlated. In fact, during acidic oxidation process, CNT can collapse and form carbonaceous fragments (CFs). It is reported that the carboxylated functions produced by HNO3 treatment are mainly on carboxylated carbonaceous fragments (CCFs) adsorbed on SWCNT instead of directly covalently anchored to the surface of SWCNT [55]. Under strong enough oxidizing conditions these CCFs can be fully gasified to form CO2, which can explain the verified WL.
However, in the case of the carbon xerogel, the reported WL during the same HNO3 hydrothermal treatment did not exceed 10% under the same conditions [49]. Since the WL of the SWCNT verified during the blank test (with water instead of HNO3) was in the range of the measured values for the carbon xerogel (5-10 %), it is believed that the mechanism undergone by both materials during the exposure to the HNO3 oxidizing conditions for this same HNO3 hydrothermal process is truly different. Therefore, there are many aspects in the HNO3 hydrothermal treatment that influence the mechanism and the yield of oxygenated functionalities introduced over their surface. Reaction temperature and HNO3 concentrations are the key operation conditions to tune the functionalization of these carbon materials. In addition, when choosing a carbon material for a certain application which requires previous surface functionalization, the morphology is also a relevant issue since the reaction pathway appears to go in different ways.
Additionally, some tests were performed by loading the reactor with 0.5 g of SWCNT instead of 0.2 g and using three different HNO3 concentrations (0.03, 0.1 and 0.3 mol L-1). The CO and CO2 concentrations are gathered in Table 3.3, as well as the % O2, and the respective TPD spectra presented in Fig. 3.8.
Table 3.3 - Total amount of CO and CO2 calculated from the TPD spectra and respective % O2 as function of [HNO3]/mSWCNT and HNO3 concentration at 473 K.
[HNO3] (mol L-1) mSWCNT (g) [HNO3] / mSWCNT (mol L-1 g-1) CO (20) (mol g-1) CO2 (20) (mol g-1) CO/CO2 % O2 (wt. %) 0.03 0.5 0.06 1134 184 6.2 2.4 0.03 0.2 0.15 1541 350 4.4 3.7 0.10 0.5 0.20 1888 428 4.4 4.4 0.10 0.2 0.50 2407 586 4.1 5.9 0.30 0.5 0.60 2535 606 4.2 6.2 0.30 0.2 1.50 3148 907 3.5 8.4
Results and Discussion 24
As expected, for the groups released as CO (Fig. 3.8a) and for the groups released as CO2 (Fig. 3.8b), the amount of surface groups obtained with the same HNO3 concentration is always lower for the load of 0.5 g.
300 500 700 900 1100 1300 0.0 0.2 0.4 0.6 0.8 1.0 1.2 1.4
CO
(
mol g
-1s
-1)
0.3 mol L-1 0.1 mol L-1 0.03 mol L-1T (K)
(a) 300 500 700 900 1100 1300 0.00 0.04 0.08 0.12 0.16 0.20 0.24 0.3 mol L-1 0.1 mol L-1 0.03 mol L-1CO
2(
mol
g
-1s
-1)
T (K)
(b) Figure 3.8 - TPD spectra for different SWCNT loads and treated at three different HNO3Results and Discussion 25
In Fig. 3.9 is plotted the percentage of the total amount of molecular oxygen determined by TPD (released as CO and CO2) against [HNO3]/mSWCNT for all the SWCNT loads and HNO3 concentrations studied at 473 K. 0.0 0.2 0.4 0.6 0.8 1.0 1.2 1.4 1.6 0 2 4 6 8 10 0.2 g 0.5 g
% O
2(
w
t.
%)
[HNO 3]/mSWCNT (mol L -1 g-1) % O 2 = 8.6 - 6.9 exp (-2.0 [HNO3]/mSWCNT) r2 = 0.990Figure 3.9 - Weight % O2 determined by TPD for the SWCNT treated at 473 K as a function of [HNO3]/mSWCNT (mathematical correlation: [HNO3] must be inserted in mol L-1).
As expected, the % O2 is dependent on the [HNO3]/mSWCNT ratio. In addition, since one single mathematical correlation represents quite well the data for both loads (0.2 g and 0.5 g), for a given [HNO3]/mSWCNT ratio the % O2 seems to be independent with respect to the SWCNT load (i.e. when the HNO3 concentration increases proportionally to the SWCNT load in order to maintain the [HNO3]/mSWCNT ratio).
Therefore, a mathematical correlation between the amount of oxygenated groups which can be introduced at the surface of SWCNT and the [HNO3]/mSWCNT ratio is established. The functionalization degree can now be predicted not also for a fixed load of SWCNT but for the whole range of [HNO3]/mSWCNT studied, including several SWCNT loads and HNO3 concentrations. The surface modification of SWCNT by the HNO3 hydrothermal method can be accurately controlled by using the mathematical correlations obtained.
Results and Discussion 26
3.2 Characterization of hybrid SWCNT/TiO
2photocatalysts
The SWCNT functionalized with 0.1 mol L-1 of HNO
3 were used to prepare one composite by the SG method (0.1SW/TiO2).
DR UV-Vis spectra of the materials prepared by SG (TiO2, SW/TiO2 and 0.1SW/TiO2) and those submitted to a HT (SW/TiO2 – HT and P25/TiO2 - HT) are represented in Fig. 3.10. The spectrum obtained for the commercial P25 is also shown and TiO2 is considered as the reference material for comparison purposes.
250 300 350 400 450 500 550 600 650 700 0.0 0.5 1.0 1.5 2.0 2.5 3.0 3.5 4.0
Ku
b
e
lka
-Mun
k
Wavelenght (nm)
SW/P25 - HT P25 SW/TiO 2 - HT 0.1SW/TiO 2 TiO 2 SW/TiO 2Figure 3.10 - Diffused reflectance UV-Vis spectra of the different catalysts.
Comparing the materials synthesized by SG, it is clear that no visible absorption was increased with the incorporation of the CNT in the TiO2 matrix. It is worth to note that, despite CNT are black bodies, the amount of SWCNT in SWCNT/TiO2 composites used in this work is quite low. Hence, the wavelengths at which the composites absorb are very similar to the ones for the TiO2 spectrum. Nevertheless, different absorptions were observed. It seems that composites with functionalized SWCNT are able to absorb higher amounts of light in the UV range.
Higher absorptions were also observed for the materials which were subjected to the hydrothermal treatment. In this case, an improvement on visible light absorption was recorded for SW/TiO2 – HT and for SW/P25 – HT.
Results and Discussion 27
Taking into account that in a photocatalytic process the degradation of the substrate takes place at the surface of the catalyst, the specific surface area can be a relevant parameter and must be considered to evaluate the performance of a photocatalyst. The SBET of each specific prepared material was assessed and the results are gathered in Table 3.4.
Table 3.4 - Specific surface area (SBET) determined for the prepared materials and for P25. Catalyst TiO2 SW/TiO2 SW/TiO2 - HT SW/P25 - HT P25
SBET (m2/g) 102 74 122 49 47
The incorporation of SWCNT in the TiO2 matrix produced a decrease in the SBET of about 25%, contrarily to what was expected. The introduction of CNT in a TiO2 matrix is supposed to produce a better dispersion of the TiO2 crystallites, increasing the SBET. A possible explanation is that, in the dry step, the gel could collapse in some way reducing the porosity of the material. Further X-Ray Diffraction (XRD) analyses should be performed to clarify this issue. On the other hand, the HT increased by 25% the SBET of SW/TiO2 – HT when compared to the material present in the higher amount (TiO2). The HT of TiO2 powders is known to affects the particle size, the surface area and the hydroxyl content of the material [56, 57], depending on the treatment conditions. In the present case, the HT was performed with HNO3 which comprises the in situ functionalization of the SWCNT. Hence, the dispersion of the particle size of TiO2 crystallites could be enhanced resulting in a higher SBET. In the case of P25, no significant differences were observed.
3.3 Photocatalytic Oxidative Degradation of Organic Pollutants
The performance of the prepared materials on the photocatalytic oxidative degradation of two substituted phenolic compounds under UV-Vis irradiation was followed by HPLC and TOC measurements. Different materials were tested for each model pollutant.
3.3.1 Heterogeneous photocatalysis of p-Methoxyphenol aqueous solutions
The concentration profiles obtained for the photocatalytic oxidative degradation of p-MPh using different catalysts are shown in Fig. 3.11 in terms of C/C0. Firstly, it must be pointed out that the blank experiment performed in the absence of a catalyst revealed that the probe molecule absorbed the irradiated light being degraded in an extent of around 65 %. Thus, the trends observed for the catalytic tests are the result of two contributions: the catalyst photoefficiency and the degradation of p-MPh by the absorption of light. As previously explained in Section 1.1, the oxidative degradation occurred through a catalytic photoreaction, since the light was firstly absorbed by the substrate molecule instead of being firstly absorbed by the catalysts (sensitized photoreaction).
![Figure 1.1- Crystal structures of anatase (a) rutile (b) and brookite (c) [9].](https://thumb-eu.123doks.com/thumbv2/123dok_br/15718771.1070224/11.892.203.707.396.628/figure-crystal-structures-anatase-rutile-b-brookite-c.webp)
![Figure 3.3 - Evolution of the amount of CO and CO 2 with HNO 3 concentration: open symbols – 393 K; full symbols – 473 K (mathematical correlations: [HNO 3 ] must be inserted in mol L -1](https://thumb-eu.123doks.com/thumbv2/123dok_br/15718771.1070224/24.892.179.715.144.517/figure-evolution-concentration-symbols-symbols-mathematical-correlations-inserted.webp)