UNIVERSIDADE DA BEIRA INTERIOR
Engenharia
Stress-Strain Relationship Characterization of
Armoured Graded Aluminium and Steel Alloys
Using a Digital Image Correlation Technique
(versão corrigida após defesa)
Hugo João Mendes Prata Graça
Dissertação para obtenção do Grau de Mestre em
Engenharia Aeronáutica
(ciclo de estudos integrado)
Orientador: Prof. Doutor Pedro Vieira Gamboa
iii
Dedicatory
I dedicate this work to my family, in particular my parents, for given me uninterrupted support through everything and instilling in me the thirst for knowledge. I would also like to dedicate this work to my cousin Vasco, with whom I grew up with and for unfortunate circumstances is no longer with us.
v
Acknowledgement
For the development of this work several people, through greater or smaller degree of involvement, were important in enabling its completion and to whom I express my acknowledgments.
On a special recognition, I would like to denote and thank those of whom were crucial: In first place to Professor Doutor Pedro Vieira Gamboa (UBI), scientific coordinator of this study, for his support and dedication, both with the experimental work and mentoring in the realization of this dissertation.
To Professor Doutor Paulo Reis (UBI), Professor Doutor Paulo Fael (UBI) and Professor Doutor Abílio Silva (UBI), for their help with the planning and experimental execution, as well as the important advice given.
To CEiiA (Centre of Engineering and Product Development) the head of the project and without it, this work would not have been possible and in particular, Doctor Pedro Talaia for his mentoring and guidance.
To every member of Departamento de Ciências Aeroespaciais, professores and employees, that made possible this achievement, as well as supporting the completion of this work.
To all my colleagues and friends for their help and support throughout this journey.
Finally, to my family for all their support and specially my parents whom were tireless throughout all my academic journey, and without whom nothing would have been possible.
vii
Abstract
The need for better and lighter armoured concepts is ever increasing. Weather due to the challenges of the modern theatre of war, which require the vehicles to easily move in dense urban areas and in vast soft grounded deserts, or by the nature of the increasingly ingenious threats, traditional armour solutions fail to provide adequate protection.
The current work is part of a project intended to develop an armour solution that incorporates cork in its composition. This work focuses on the study of metal alloys and their mechanical characterization at low strain rates. For this purpose, a look is taken into the history and evolution of armoured vehicles and the characteristics of the different materials adopted in the course of armour development. The basic concepts associated with metal alloys loading and deformation behaviour are described as well as the methodology usually employed when preforming mechanical characterization of metals.
In order to determine the material constants required to create the strain hardening parameter of the Johnson-Cook constitutive material model, quasi-static tests are conducted in 45 specimens composed of three rolling directions (0º, 45º and 90º) of 5 mm and 10 mm thick AW-5083-H111 aluminium alloy and 2.2 mm thick Ramor 500 steel alloy. The strain data is processed through strain gauges applied in the specimens’ surface and an in-house integrated digital image correlation technique.
The experimental results show that the digital image correlation technique employed in this study offers good results compared to both the strain gauge data and the similar examples from the literature. It is also possible to note the difference in behaviour in the three cutting directions in both alloys. Dynamic strain aging and instabilities of high frequency oscillation phenomena are recorded on the aluminium alloy, just as expected from high magnesium content alloys. The strain hardening constants and the Cockcroft-Latham failure criterion are successfully extrapolated and compared to similar materials. As a general conclusion, this work creates a good foundation for the full material characterisation on the larger spectrum of strain rates and will allow for the future research necessary for the main project.
Keywords
ix
Resumo Alargado
A necessidade para melhores e mais leves conceitos de blindagens é sempre crescente. Quer devido às dificuldades do campo de batalha moderno, que requerem que os veículos se movam facilmente nas densas áreas urbanas e em vastos desertos de terreno macio, quer pela natureza crescentemente engenhosa das ameaças, as blindagens tradicionais falham em fornecer proteção adequada.
O presente trabalho, faz parte de um projeto com o propósito de desenvolver uma solução de blindagem que incorpore cortiça na sua composição. Este estudo irá focar-se em ligas metálicas e a sua caracterização mecânica a baixas taxas de deformação. Para este fim, é feita uma breve revisão da história e evolução de veículos blindados e as características dos diferentes materiais empregados no desenvolvimento de blindagens. Os conceitos básicos associados com o comportamento de carregamento e deformação de ligas metálicas são descritos assim como a metodologia normalmente utilizada aquando da execução da caracterização mecânica de metais.
A fim de determinar as constantes do material necessárias para a criação do parâmetro de endurecimento de deformação do modelo constitutivo de material de Johnson-Cook, são realizados testes quase estáticos em 45 provetes compostos pelas três direções de rolamento (0º,45º e 90º) de alumínio AW-5083-H111 de 5 mm e 10 mm de espessura e aço Ramor 500 de 2,2 mm de espessura. Os dados da deformação são processados a partir de extensómetros aplicados na superfície dos provetes e por uma técnica de correlação digital de imagem caseira. Os resultados experimentais mostram que a técnica de correlação digital de imagem empregada neste estudo oferece bons resultados quando comparado com os dados dos extensómetros e com exemplos de materiais semelhantes da literatura. Também é possível denotar o comportamento diferenciado nas três direções de corte em ambas as ligas. Os fenómenos de envelhecimento dinâmico da deformação e instabilidades de oscilação de elevada frequência são registados na liga de alumínio, tal como esperado de ligas de elevado teor de magnésio. As constantes do endurecimento da deformação e do critério de falha de Cockcroft-Latham são extrapoladas com sucesso e comparadas com materiais semelhantes. Como conclusão geral, este trabalho cria uma boa fundação para a completa caracterização dos materiais num maior espetro de velocidades de deformação e vai permitir realizar a investigação necessária para o projeto principal.
Palavras Chave
Blindagem, Impacto balístico, Testes de tração, Correlação Digital de Imagem, Modelos Constitutivos.
xi
Table of Contents
Dedicatory... iii Acknowledgement ... v Abstract... vii Keywords ... vii Resumo Alargado ... ix Palavras Chave ... ix Table of Contents ... xiList of Figures ... xiii
List of Tables ... xv
List of Acronyms ... xvii
List of Symbols ... xix
1 Introduction ... 1
1.1 Motivation ... 1
1.2 Objectives ... 1
1.3 Structure of the Work ... 2
2 Literature Review ... 3
2.1 Armoured Fighting Vehicles ... 3
2.1.1 Steel ... 4
2.1.2 Aluminium ... 5
2.1.3 Composites ... 5
2.1.4 Ceramic ... 6
2.1.5 Fibre Glass ... 6
2.1.6 Blast wave ... 7
2.1.7 Cork ... 8
2.1.8 Composite Integral Armour (CIA) ... 8
2.2 Material testing ... 9
2.2.1 Basic concepts ... 9
2.2.2 Elasticity ... 10
2.2.3 Strength ... 11
2.2.4 Strain measurement ... 12
xii
2.2.6 Material constitutive models ... 15
3 Experimental Methodology ... 19
3.1 Fabrication Method ... 19
3.2 Equipment ... 21
3.3 Experimental Procedure ... 23
4 Results and Discussion ... 25
4.1 AW-5083-H111 Results ... 25
4.1.1 5 mm Thick Specimens ... 25
4.1.2 10 mm Thick Specimens ... 32
4.2 Ramor 500 Results ... 37
4.3 Application perspectives ... 42
5 Conclusions and Future Research ... 43
References ... 45
xiii
List of Figures
Figure 1: Pen Drawing of Armoured Car by Leonardo Da Vinci 1487, [5]. ... 3
Figure 2: The components of Integral Armour [39] ... 8
Figure 3: A schematic of a typical stress-strain curve for steel [18]. ... 11
Figure 4: a) Illustration of neck geometry, a half-thickness of the neck, a’ half-thickness at
location b, R radius of curvature of the surface at the neck. b) Estimation of average axial strain
(𝜀𝑥). 𝐶𝐿 centre line [44]. ... 13
Figure 5: Strain-rate regimes [38]. ... 15
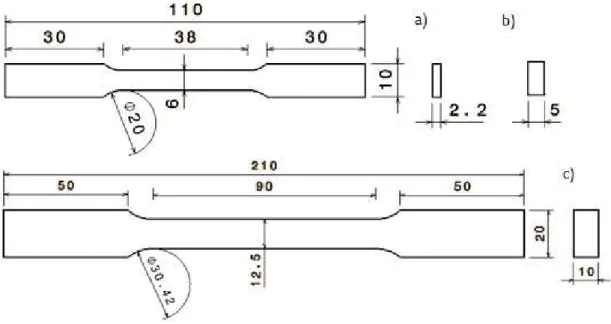
Figure 6: Dimensions of the manufactured specimens, a) Ramor 500 2.2 mm, b) and c)
AW-5083 of 5 mm and 10 mm thickness respectively. ... 20
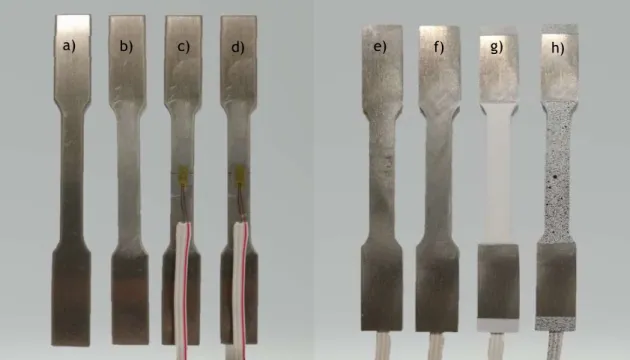
Figure 7: Stages of preparation of a specimen; a) untreated surface, b) clean surface, c) applied
strain gauge, d) protective coating, e) untreated back surface, f) clean back surface, g) base
white paint and h) stochastic pattern. ... 21
Figure 8: a) SHIMADZU AG-IC; b) INSTRON 1341. ... 22
Figure 9: Experimental Setup in the SHIMADZU AG-IC. ... 23
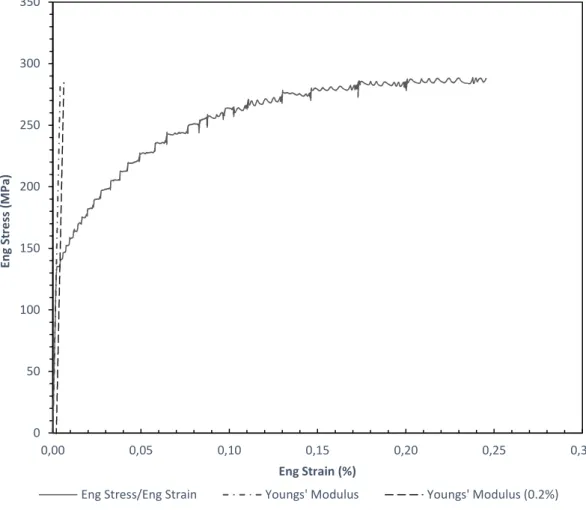
Figure 10: Engineering stress-strain curve for AlS500A, as well as the Youngs' Modulus and
Youngs' Modulus at 0.2%. ... 25
Figure 11: GOM analysis of the AlS500A Specimen loading axis strain at initial time (a), 0.2%
Yield (b), maximum force (c) and just prior to rupture (d). (e) is the obtained engineering
stress-strain curve. ... 26
Figure 12: Scheme of virtual extensometers used in the AlS500A to estimate the average
strain. ... 27
Figure 13: DIC obtained strains compared to strain gauge measurements of AlS500A. ... 28
Figure 14:True stress-strain relationship of AlS500A; average true stress defined by Eq. (18),
and the corrected equivalent stresses defined by Eq. (19). ... 28
Figure 15: Corrected stress-strain curves from the 5 mm thick specimens; (a) 0º direction, (b)
45º direction and (c) 90º direction. ... 29
Figure 16: Effective stress-strain curves of a representative specimen of each direction. ... 30
Figure 17: Strain gauge data from the tree tested cutting directions. ... 31
Figure 18: J-C strain hardening constitutive model compared to the experimental results for
the 5 mm specimens. ... 32
Figure 19: GOM analysis of the AlN1000B Specimen loading axis strain at initial time (a), 0.2%
Yield (b), maximum force (c) and just prior to rupture (d). (e) obtained engineering stress-strain
curve. ... 33
Figure 20: DIC obtained strains compared to strain gauge measurements of AlN1000B. ... 33
Figure 21: Corrected stress-strain curves from the 10 mm thick specimens; (a) 0º direction, (b)
45º direction and (c) 90º direction. ... 34
Figure 22: Effective stress-strain curves of a representative specimen of each direction. ... 35
Figure 23: J-C strain hardening constitutive model compared to the experimental results for
the 10 mm specimens. ... 36
Figure 24: Comparison between the J-C Strain hardening models. T: 5 mm specimen; S: 10 mm
specimen; J-C_T/S: Johnson-Cook Strain hardening models of the 5 and 10 mm specimens
respectively. ... 37
Figure 25: GOM analysis of the StS2.200E Specimen loading axis strain at initial time (a), 0.2%
Yield (b), maximum force (c) and just prior to rupture (d). (e) obtained engineering stress-strain
curve. ... 37
xiv
Figure 26: DIC obtained true strains compared to the KFEM and KFG strain gauge
measurements of StS2.200E. ... 38
Figure 27: Corrected stress-strain curves from the Ramor 500 specimens; (a) 0º direction, (b)
45º direction and (c) 90º direction. ... 38
Figure 28: Effective stress-strain curves of a representative specimen of each direction. ... 40
Figure 29: J-C strain hardening constitutive model compared to the experimental results for
the 90º reference specimen. ... 41
Figure 30: Comparison of the obtained Ramor 500 J-C model with similar steels from literature.
... 41
xv
List of Tables
Table 1: Chemical composition of Ramor 500 (max %) [48]. ... 19
Table 2: Chemical composition of AW-5083-H111 (%) [49]. ... 19
Table 3: Generic physical and mechanical properties of Aw-5083-H111 and Ramor 500. ... 19
Table 4: Example of the designation of a specimen and respective meaning. ... 20
Table 5: Properties from the 5 mm thick specimens. ... 29
Table 6: J-C strain hardening constitutive model and C-L failure criterion parameters. ... 31
Table 7: Properties from the 10 mm thick specimens. ... 34
Table 8: J-C strain hardening constitutive model and C-L failure criterion parameters. ... 35
Table 9: Properties from the Ramor 500 specimens. ... 39
Table 10: J-C strain hardening constitutive model and C-L failure criterion parameters. ... 40
xvii
List of Acronyms
AP Armour Piercing
ASTM American Society for Testing and Materials CEiiA Centre of Engineering and Product Development C-L Cockcroft and Latham
DSA Dynamic Strain Aging DIC Digital Image Correlation J-C Johnson and Cook U.S. United States of America WWI First World War
List of Symbols
𝜀̇ Quasi-static tensile test strain rate 𝜀̅ Average axial strain
𝜀̇∗ Dimensionless plastic strain rate
for 𝜀̇
𝐴
Specimen´s initial cross-sectional area𝐴 Specimen’s cross-sectional area 𝐶 Bridgman’s analytical correction
factor
𝐶 Ostsemin’s analytical correction factor
𝐷 Johnson and Cook cumulative damage model constants 𝐹 Force parallel to the surface 𝑇 Homologous Temperature 𝑇 Material’s melting temperature 𝑇 Room temperature
𝑊 Critical value of 𝑊
𝑎 Specimen’s initial half-thickness 𝑥 Initial length
𝜀̅
Effective strain 𝜀̇ Strain rate 𝜀 Strain to fracture 𝜀 Engineering strain 𝜀 Transverse strain𝜀
Strain in the specimen’s length𝜀
Strain in the specimen´s width𝜀
Strain in the specimen´s thickness 𝜀 Amount of plastic strain𝜎∗ Dimensionless pressure/stress ratio
𝜎 major principal stress 𝜎 Hydrostatic stress 𝜎 Average true stress
𝜎 Johnson and Cook stress flow equation
𝜎 Effective stress
𝜎
Engineering stress𝜎 Stress in the specimen’s length 𝜎 Stress in the specimen’s with 𝜎 Stress in the specimen’s thickness 𝜏 Shear stress between length and
width
𝜏 Shear stress between width and thickness
𝜏 Shear stress between thickness and length
Δ𝜀 Plastic straining 𝐴 Material yield strength 𝐵 Strain hardening constant 𝐶 Strain-rate constant
𝐷 Johnson and Cook cumulative damage model
𝐸 Young’s modulus 𝐹 Force
𝐿
Specimen’s original length𝑅 Radius of curvature of the surface of the neck
xx
𝑈
Strain Energy𝑊
Strain energy per volume unit 𝑎 Half-thickness of the neck 𝑎′ Half-thickness at location b 𝑑𝑥 Increment in deformation 𝑑𝜀 Increment of true strain 𝑚 Thermal softening exponent 𝑛 Strain hardening exponent 𝑥 Current length𝜀 True strain 𝜎 True stress 𝜏 Shear stress 𝜐 Poisson’s Ratio
1
1 Introduction
1.1 Motivation
The need for lighter armoured vehicles on the modern battlefield is demanding a constant search for new and more effective light weight armour solutions. This work is part of the Light Armoured Multi-Purpose Vehicle (L-AMPV) project lead by the Centre of Engineering and Product Development (CEiiA) in conjunction with the Portuguese Defence Ministry, Universidade de Aveiro and Universidade da Beira Interior, for which the goal is to develop an armour solution incorporating cork.
The significance of this project lies with the necessity of reducing the weight of current armour solutions while increasing their effectiveness and maintaining the production costs low. Cork is a low density, natural, renewable and ecological material with great abundance in Portugal. Previous studies indicate that this material exhibits interesting damage absorption properties, in both low and high impact speeds when applied in sandwich structures [1, 2, 3, 4]. In addition to the damage resistance, cork also offers good thermic and acoustic insolation, vibration absorption and suppression and fire resistance characteristics, indicating exceptional properties for armour application. Due to the diversity of the present-day threats, several layers of materials are usually incorporated in effective armour solutions, each with a specific function to defeat ballistic and blast wave impacts. Therefore, the suitable selection and study of current available armour solutions is fundamental to achieve the best combination of materials that will enhance the strong suits of each layer while minimizing their weaknesses without creating a prohibitively expensive solution.
The correct material characterization is a fundamental step for the ability to appropriately execute numerical simulations capable of providing acceptable data and inexpensively test material combinations and armour solutions. This is dependent on good experimental data that is often expensive and time consuming, especially when several materials are the subject of study. In order to turn the task into more manageable portions, each partner is responsible for the study of smaller combination of materials suited to their available resources.
1.2 Objectives
The current work will focus on the mechanical characterization of the armour graded aluminium and steel, available for the project, at low deformation rates.
For this purpose, a literature review, including the historical evolution of several armour solutions used through time, is necessary to comprehend the available alloys but also for the materials available for the project in order to understand the important characteristics and behaviours thought out when designing armour solutions.
2
It will also be sought to understand the methodology involved in the execution of tensile testing and the characterization of metals, including the best techniques to analyse the material behaviour up to rupture.
Test and compare the results of the two armoured graded alloys, AW-5083-H111 aluminium and Ramor 500 steel, in three different directions of rolling, and the effect of thickness in the materials behaviour to quasi-static tensile tests, with the goal of the subsequent creation of constitutive mechanical models of the materials.
These tests will form the basis for all the future characterization of the materials which will allow the execution of numerical simulations intended to find the best armour solution.
1.3 Structure of the Work
This work is constituted by five main chapters, beginning with the current introduction, followed by the literature review, where the evolution and current armour solutions are compiled. An introduction of the necessary concepts required to successfully understand and conduct the quasi-static material testing as well as the data required for the correct development of the tested materials constitutive models will also be described in this chapter. The third chapter will be an overview of the conducted experimental studies, namely the manufacturing process and specimen preparation, the used equipment and a detailed description of the experimental procedure. In the next chapter, the experimental results are compiled and analysed for the different materials and thicknesses. A final interpretation and comparison of the results with similar materials on the literature is also conducted.
The culmination of the investigation is found on the fifth chapter, with the conclusions made from all the realised experimental work and the proposed procedure for the full material characterisation including the higher deformation speeds.
3
2 Literature Review
2.1 Armoured Fighting Vehicles
The objective of this section is to expand the knowledge of the history and development of Light armoured vehicles, as well as the different designs used to defeat the different threats faced.
The origin of the first armour is very hard to trace, for as long as there was war, there was the need for defence. When it comes to fighting vehicles, their use can be traced to war chariots used as far back as in 1700BC in the Middle East, first as battle taxis, and later as mobile weapons platforms.
During the Middle Ages wheeled siege towers were used to offer protection to the crews and soldiers while moving toward the enemy fortifications. However, Leonardo Da Vinci’s 1487 sketch of a mobile, protection gun platform is frequently cited as the prototype of modern tank, Fig 1, [5].
Figure 1: Pen Drawing of Armoured Car by Leonardo Da Vinci 1487, [5].
But it was only with the invention of the traction engine and the motor car in the beginning of the 20th century that allowed the idea of the armoured vehicles, as it is recognised today, to
take shape.
The first armed vehicle was a De Dion-Bouton quadricycle on which F. R. Simms mounted a Maxim machine gun in 1899 [6], whereas the first armoured vehicle was a road locomotive designed by F. R. Simms and built by Vickers, Sons and Maxim, Limited, in 1902, for the defence of the British Coast [7].In 1903 a French artillery officer, captain Levavasseur, put forward a scheme for a self-propelled 75mm gun on an armoured tracked chassis. The scheme was considered by the French Artillery Technical Committee, but the latter came to the conclusion that animal traction was preferable for guns and finally rejected the scheme in 1908. Similar concepts are recorded in several countries during the same period, however, all had similar fates [8].
4
During the First World War (WWI), all of that changed, and the necessity for a vehicle that could traverse a mud and shell cratered battlefield, break through the wire fortifications and overcome trenches in order to engage the enemy, lead to the creation of the Lincoln Machine, also known as, Little Willie, in 1915. This was the first tracked vehicle, that, contrary to the wheeled counterparts, could cross the battlefield without getting stuck, [9].
2.1.1 Steel
The advent of the tank, as known today, only truly came to fruition during WWI with the British Mark I, the first fighting tank [10]. This tank set out the basic blue print from where the future fighting vehicles would build upon. The first tanks were armoured purely with steel, which for some time was the material of choice, when it came to the design of armours, due to the availability of a large technological database, relative cheap costs of production and wide range of mechanical properties [11].
When it comes to ballistic impacts the most critical property affecting steel’s performance is its hardness [12]. With increasing steel hardness, there is a significant decrease of the penetration and propagation of the projectile [11]. With low hardness levels steel, the projectile core passes intact through the armour forming a ductile hole but with very high hardness levels fracturing of the steel target upon impact may occur making it shatter [11, 12]. When a projectile hits’ the target material, compressive stress waves occur firstly. After that, these compressive waves reflect back from the rear side of the material as tensile waves and finally the interaction of these waves cause crack initiation, crack propagation and failure. In order to handle these waves, strength and toughness of the target material should be high [13, 14].
Another important aspect of steel armours is the fact that, in many cases, it is very hard to produce a monolithic plate with the desired thickness, which results in the use of multi-layered plates. There is extensive literature regarding the effects of double layered target plates, with and without spacing, but with many contradicting results. For instance, Gupta and Madhu [15] performed an experiment on ballistic performances of single and multi-layered plates of mild steel, rolled homogeneous armour and aluminium against 6.2mm projectiles having a velocity range of 800-880 m/s. They found that although two layered thick plates had similar ballistic performance with the single plates of equal thickness, further increasing the number of layers decreased their ballistic resistance. A similar conclusion was reached in numerical models by Flores-Johnson and Edwards [16]. They found better ballistic performance in monolithic plates, though the effect diminished with increased impact velocity. On the other hand, S. Dey et al. [17] tested the ballistic resistance of double layered steel plates and found an overall increase in the ballistic limit velocity in the double layered targets.
However, the main drawback of steel armours is its density. With the ability to incorporate larger weapons and engines in tanks, and with development of better tank counter measures,
5
a constant increase in weight and reduction of mobility was unavoidable, culminating in the Second Wold War’s (WWII) Maus (mouse) tank. This super heavy tank design would have weighed 188 tonnes and with an armour up to 2400 mm thick, it would not have been able to even cross bridges, and no engine available could give it a reasonable speed [18].
2.1.2 Aluminium
One lighter alternative to steel is aluminium, and in the 1950’s the American M113 APC was the first armoured vehicle fabricated from AA-5083 aluminium and it was the most widely used United States of America (U.S.) Army armoured vehicle in the Vietnam War. The application of the aluminium armour made the vehicle lighter than its predecessors, moderately amphibious, air transportable and air droppable, but was strong enough to protect its crew against small arms fire. Aluminium was chosen because, for protection against 7.62 mm AP (armour piercing) and 14.5 mm AP, the areal density required of some aluminium alloys is lower than their steel counterparts [18].
When it comes to damage mechanisms and energy absorption, aluminium follows a very similar pattern to steel, so that many of the experiments mentioned above where preformed both in steel and in aluminium. It was found that, like steel, the higher its level of hardness the better at resisting impacts it becomes [14]. In [15, 16] it’s found that more layers decrease ballistic performance, though, if paired as a front face with steel backing, this hybrid solution was the best double layer ballistic performer [16]. Because, the level of hardness of aluminium cannot compete with steel, it becomes necessary, to face modern threats, to combine it with other materials. This lead to the development of composite armours.
2.1.3 Composites
In an attempt to face new anti-tank threats, such as shaped charges and high-explosive (HEP) rounds, in 1952, the development of a siliceous cored armour was initiated. It consisted of fused silica glass sandwiched between rolled steel plates, and it proved to be significantly more effective than plain steel armours [19]. Though it was never used, because the vehicle in which it was meant to be applied never went into production, it served as concept for future armour developments.
Nowadays, composite armours have become much more sophisticated and complex, with several different layers, each with a specific function in defeating a projectile. Many mechanisms are used in composites to stop a projectile. These usually include [20]:
1. Projectile deformation and fragmentation,
2. Projectile deceleration and controlled moment transfer to the target, 3. Projectile and armour spall shield.
6
Different materials are used to exploit each mechanism:
1. A high hardness (and ideally tough) material such as alumina, silicon carbide and boron carbide ceramics.
2. High strength, but fracture resistant for projectile deceleration through plastic energy dissipation, such as steel, aluminium and titanium.
3. High strength fibres in textile or composite form, such as Kevlar®, glass fibre reinforced
polymers and ultra-high molecular weight polyethylene (UHMWPE),
There is a myriad of materials that can fulfil these requirements, but for the sake of simplicity only the materials available for this project (steel, aluminium, alumina, glass fibre/phenolic resign reinforced polymers) are addressed.
2.1.4 Ceramic
The first battle use of ceramic armour technology was in U.S. helicopters during the Vietnam conflict where low-level sorties made the helicopter and crew vulnerable to small-arm fire. It was the most weight-efficient means of providing protection and was applied in air crews’ vests and around the seats [18]. However, the first patents for a ceramic-based armour were filed by the Goodyear Aerospace Company in 1963 and granted in 1970 [21].
In the 1980s, the majority of the ceramic-based armour systems that were deployed in the battlefield applications used alumina. Alumina (𝐴𝑙 𝑂 ) is relatively inexpensive to manufacture, and even quite thin sections can stop high-velocity small-arms bullets [18]. The main anti-ballistic mechanisms observed in ceramics involve an initial stage where the projectile gets its tip blunted. At the same time a crack is initiated in the rear surface of the ceramic as the back-plate yields in their interface. This crack is usually conical in shape with its base with a diameter twice as large as the ceramic thickness, which helps spread the area of impact in the back plate. In the second stage, the ceramic turns to rubble as the projectile is eroded. Approximately 40% of the projectile mass and initial energy are carried off by eroded projectile material. In the last stage, the erosion of the projectile ceases and the remaining energy and spall are absorbed by the back plate [18, 22, 23, 24, 25, 26].
Though ceramics present several advantages against ballistic impacts, there are several drawbacks. They have very poor multi-hit impact response and are sensitive to transit and use due to their brittleness, they can be more difficult to manufacture than armour-graded metals and cannot be used for load-bearing structures.
2.1.5 Fibre Glass
The field of high-performance fibres is only about 60 years old. Nylon and silk fibres had been used to make armour vests for soldiers, but with very limited success. In the 1960s, DuPont developed polyparaphenylene terephthalamide, also known as Kevlar®, and it was able to
7
successfully stop a bullet [27]. Since then, Kevlar® has been used extensively in the design of body armour, and even as spall liner for some light armoured vehicles [18].
However, Kevlar® is very expensive to fully integrate in a vehicle armour while glass fibre reinforced polymers, either from E-glass or S2-glass, present a more cost effective alternative, having already been used in mine countermeasure vessels [28], and armoured fighting vehicles [29]. Though they cannot provide adequate protection on their own, combined with ceramics or high-hardness steels they can offer significant weight reductions. The role where these materials excel at are as spall liners and hard facing plates baking acting as a safety net to catch the debris from the initial impact while, in some configurations, also providing structural support [18].
2.1.6 Blast wave
Landmines have always been one of the most dangerous weapons. Since WWII more vehicles have been lost to landmines than any other threat [30], and with the recent conflicts in Iraq and Afghanistan the threat of landmines has been superseded by improvised explosive devices (IEDs) [31, 32]. The role of a well-designed armour is then to ensure that the magnitude of the pressure wave and its impulse, the length of the interaction time between the pressure wave and the structure, are controlled to keep any resultant stresses acting on the target below a critical threshold [33], as well as offer adequate protection against debris, shrapnel and fire [32].
In order to mitigate the effect of a blast, the general strategies that can be used in armour design are summarized next [33]. Impedance mismatch can control the transmitted pressure, by mitigating the peak pressure transmitted through the armour. Energy dissipation mechanisms can mitigate the transmitted impulse. Dispersion (and impedance mismatch) can increase the interaction time between the supported structure and the threat, so as to change the damage regime from one controlled by impulse to one controlled by pressure.
Typically, the energy of the stress waves induced by blast or impact is broadly distributed over multiple frequencies. Therefore, this energy must be tuned to a narrow spectrum before it can be optimally dissipated. This can be achieved by a multi-layer design in which the outer layers tune the stress waves to match the critical damping frequency of an inner viscoelastic layer. As a high-frequency stress wave travels through this viscoelastic layer, it undergoes multiple loading-unloading cycles which can result in significant energy dissipation over a short duration [33].
Some experiments have also indicated that a gradation (increase in density, from the impact face to the back face) of the material of higher acoustic impedance in the core of a sandwich structure helps reduce deflection and damage to the structure [34, 35].
8
2.1.7 Cork
When Cork, a natural material, is used as a core in sandwich structures, these sandwiches present high stiffness-to-weight ratio, high strength-to-weight ratio, excellent fatigue properties, thermal/acoustic insulation and corrosion and fire resistance [36]. With the need to produce lighter and more agile vehicles to face the modern battlefield demands, cork might present a good addition to current and future armour solutions.
Already some investigation has been done on the behaviour of core cork-based sandwich materials either for ballistic impacts [1] and blast waves [2, 3]. In the case of ballistic impacts, it was found that the presence of the cork core slightly increased the ballistic limit but strongly augmented the absorbed energy, while for blast waves, the sandwich thickness reduction indicated the possibility of energy dissipation by the cork, most probably due to the cork cellular structure crushing.
2.1.8 Composite Integral Armour (CIA)
One of the most advanced current armour solutions is the composite Integral Armour. This solution was designed to replace aluminium and optimize the weight and performance of an armoured vehicle for the U.S. Army.
This hybrid material consists of a ceramic strike face, a thin rubber layer and an S2 glass-based composite backing plate (Fig. 2). This solution has, so far, provided ballistic protection and structural integrity at the minimal areal-density [22]. The rubber layer between the ceramic tiles and the composite backing is used to increase the armour’s multi-hit capability and structural damage tolerance by decreasing the stress wave transamination between the materials. [37, 38].
As aforementioned, it is well known that the high hardness ceramic deforms and erodes de penetrator through a complex brittle fracture mechanism of the ceramic. The deformation process of the backing plate absorbs about 20-40% of the total kinetic energy of the projectile. The rest of the kinetic energy is spent to deform the projectile (10-15%) and a vast amount is
9
taken by the ejected ceramic debris [39]. The phenolic liner provides spall and fire protection. The whole system is cover by a fibre glass composite required to protect the ceramic tiles from low velocity impacts, arising from everyday normal vehicle operations.
2.2 Material testing
2.2.1 Basic concepts
For the purpose of this study, only the metallic alloys will be analysed, since only an aluminium alloy and a steel will be available for testing. But before proceeding to examine the tests conducted for these materials, a few concepts must be understood.
The most common relationship used in material characterization is the stress – strain. As Hanzell [18] explains, stress is a measure of the applied force, in Newtons (N), divided by the area over which that force acts, in square meters (m2). The SI units therefore become N/m2 or pascals
(Pa).
In the case of simple tension, the stress, 𝜎, can be written as,
𝜎 = (1)
where 𝐹 is the applied force, and 𝐴 is the area over which the force acts. In a situation where the force no longer acts normal to the surface but as some angle to it, the component of the force acting parallel to the surface, 𝐹𝑠, loads the element in shear. So, a shear stress, 𝜏, that is acting on the element can be defined as,
𝜏 = (2)
The states of stress can be categorized in three states of pure stress. They are defined as simple tension or compression (Eq. 1), pure shear (Eq. 2) and hydrostatic stress or pressure. This occurs when a solid is subjected to equal compression on all sides and is usually associated with shock waves in penetration and blasts. However, for the current work, we will focus mainly on simple tension.
A material will react to stress by deforming or straining. In the case of simple tension, then the amount of strain can be determined by measuring the amount of deformation and dividing it by the original length of the sample. So, strain, in simple tension, where a load is applied to a sample of length 𝑥 can be defined as,
𝜀 = (3)
where 𝑥 is the current length due to the application of the load. This is the definition of engineering or nominal strain where the initial and final states of the sample are measured during an experiment. However, there is an additional important definition of strain that is frequently used in computational codes, or in the analysis of wave propagation, designated true
10
strain or natural strain. For a continually straining object, it is the precise measure of strain at one particular point in time. Therefore, an increment of true strain can be defined according to,
𝑑𝜀 = (4)
Integrating between 𝑥 and 𝑥, we have,
𝜀 = ∫ = ln( ) (5)
From Eq. (3), it is seen that,
𝑥 = 𝑥 (1 + 𝜀 ) (6)
Therefore, the equation for true strain can be rewritten as:
𝜀 = ln( ( )) (7)
And so, true strain is defined as,
𝜀 = ln(1 + 𝜀 ) (8)
This gives us the relationship between true strain and engineering strain.
In simple tension, the length of the sample will increase, but the thickness, or diameter for cylindrical specimens, will decrease. To describe this effect, the Poisson’s ratio (𝜐) relates the longitudinal strain to the transverse strain, 𝜀 ; through,
𝜐 = − (9)
2.2.2 Elasticity
When a load is applied to a material, initially, it will deform elastically. In fact, all materials will deform elastically when subjected to small strains. Up to a predetermined stress limit, the amount of deformation is reversible as the material has not suffered permanent deformation. In this region, the stress is directly proportional to the strain; thus,
𝜎 = 𝐸𝜀 (10)
where 𝐸 is defined as the modulus of elasticity or the Young’s modulus of the material. This relationship was originally discovered by Robert Hooke in 1878 and is sometimes referred to as Hooke’s law. At the atomic level, 𝜀 is a measure of the increase in atomic spacing to the applied stress. As the load is increased, the inter-atomic spacing increases, and when the load is removed, the atoms return to their equilibrium position. The greater the attraction between atoms, that is, the stronger the bonding, the greater the stress required to increase the inter-atomic spacing.
11
2.2.3 Strength
The measurement of the strength of metal materials is generally carried out in tension by what is called a ‘simple tensile test’. Loading a ductile material such as mild steel in a simple tension results in a stress-strain profile shown in Fig. 3. Inset is a typical ‘dumbbell’-shaped specimen that may be used with metals showing a reduced section where the strain is measured. The curves for both true stress and engineering stress are shown. Considering the engineering stress behaviour: At point A, the yield strength (Y) of the material is reached. At this point, the material is no longer linear elastic and starts to incur permanent damage. This continues until at point B, the maximum engineering stress is reached, which is known as the ultimate tensile stress. At this point, the onset of necking occurs, and the stress is relaxed until fracture occurs at point C.
Figure 3: A schematic of a typical stress-strain curve for steel [18].
The engineering stress curve sits lower than the true stress curve. This is because the calculation of the engineering stress takes into account the original cross-sectional area before the sample is deformed. As the sample is stretched, it will narrow, and the true stress takes into account the reduced cross-sectional area, i.e. the instantaneous cross-sectional area. The true stress and engineering stress are related by the following relationship:
𝜎 = 𝜎 (1 + 𝜀 ) (11)
Where 𝜎 is the engineering stress, and 𝜀 is the engineering strain.
The application of tensile load produces strains in the test specimens. The effect of these strains is to rise the energy levels in the bar itself. The increase in energy within the bar is
12
called strain energy and is equal to the work done on the bar provided that no energy is added or subtracted in the form of heat. The strain energy, 𝑈, can be calculated from,
𝑈 = 𝐹. 𝑑𝑥 (12)
Where 𝐹 is the load applied to the bar, and 𝑥 is the distance through which the bar is stretched. The above equation including the cross-sectional area 𝐴 and the original length 𝐿 of the bar can be rewritten as follows:
𝑈 = 𝐴 . 𝐿. . (13)
And therefore,
= 𝜎. 𝑑𝜀 (14)
Consequently, the area under the curve is a measure of the strain energy per volume unit, 𝑊, and is a measure of the material’s toughness.
2.2.4 Strain measurement
The measurement of the strain during testing is fundamental for the correct estimation of the material behaviour. However, there are several difficulties associated with the acquisition of this data. If the deformations beyond the maximum engineering stress are of little relevance for the application intended, the simple use of an extensometer, or a strain gauge measuring the deformation on the specimens’ reduced section is sufficient. But, if precise strains are required after the maximum engineering strain is achieved, these methods will not be enough, due to the unset of localized necking.
For strain measurements, up until fracture occurs, video or laser extensometry is usually applied. These methods rely on analysing the deformations from the specimens’ entire surface allowing for the determination of the strains on the necking region. With round test bars, the instant diameter, and thus instant true cross-sectional area, can be easily tracked. But, more often than not, the only available material for testing is fabricated from flat sheets or plates, resulting in a rectangular cross section. Strain measurement on these specimens becomes complicated due to inhomogeneous strain field and triaxial stress. Two practical difficulties can be mentioned here. The first problem is the measurement of the instantaneous area of minimum cross-section after necking. During plastic instability, the cross-section at the largest deformed zone forms a cushion like shape [40], so that it becomes difficult to measure the cross-sectional area of the neck. The second challenge is the measurement of thickness reduction. Some commercially available solutions offer a two-camera system positioned symmetrically oblique to the specimens’ surface, allowing for instant tracking the thickness reduction. Afterwards, the images obtained are compared through a Digital Image Correlation (DIC) software that will analyse the variance between both cameras and between each frame permitting the tracking of the true cross-sectional area and necking strains throughout a test.
13
These commercial systems tend to be very expensive, limiting their availability to more well-funded laboratories. It is, however, possible to create a home integrated system using a modern digital camera and an open source DIC software to obtain similar results, as Geesthacht et al. [40] and Ahmmad et al. [41] demonstrate. This method relies on a single digital camera to measure the strain field on the specimen surface allowing for the estimation of 𝑎/𝑅, where 𝑎 is the half-thickness and 𝑅 is the radius curvature of the neck surface (Fig 7a).
Figure 4: a) Illustration of neck geometry, a half-thickness of the neck, a’ half-thickness at location b, R radius of curvature of the surface at the neck. b) Estimation of average axial strain (𝜀̅ ). 𝐶 centre line [44].
The processes for determining the true stress and true strain with this method begins with the effective strain, 𝜀̅, after bifurcation as calculated by Scheider et al. [40] as:
𝜀̅ =
𝜀 + 𝜀 𝜀 + 𝜀
(
15)where 𝜀 and 𝜀 are the true strains in the specimen’s length and width directions, respectively. Usually necking phenomena occur soon after the maximum load, and the initiation of necking, true stress can be calculated by:
𝜎 =
=
𝑒𝑥𝑝 −𝜀 − 𝜀
(16)where 𝐴 is the specimen’s initial cross-sectional area and 𝜀 is the strain in the thickness direction. In the case where deformation is uniform, Eq. (16) can be calculated as:
𝜎 =
𝑒𝑥𝑝(𝜀 )
(17)In practice, the axial strain over the cross-section, as shown in Fig 4a, is not uniform, so that an average true stress (𝜎 ) can be obtained from Eq. (17) by measuring an average axial strain, 𝜀̅ (see fig 4b):
14
The true equivalent stress, 𝜎 , after correction due to the triaxial stress state, can be expressed as:
𝜎
=
or (19)where 𝐶 and 𝐶 are two analytical correction factors that can be used for rectangular cross-section specimens after the initiation of necking
.
These factors are given by Bridgman [42]:𝐶 =
1 +
𝑙𝑛 1 + +
1 +
− 1
(20)and by Ostsemin [43]:
𝐶 = 1 +
(21)where 𝑎 and 𝑅 are defined as illustrated in Fig 4a, in which the solid bold line represents the upper surface of the central line section of the neck. The correction factors 𝐶 and 𝐶 depend on a parameter, 𝑎 𝑅⁄ , given by:
=
( ) (22)where 𝑎 𝑏⁄ may be taken as 0.5 − 1.0 [44], and the half-thickness, 𝑎′, is estimated at a distance 𝑏 from the centre of the neck (see Fig 4a). The continuous values of the thickness can be estimated by surface strains in the length and width directions by a vision sensor by applying the following relations:
𝑎 = 𝑎 𝑒𝑥𝑝(𝜀 ) = 𝑎 𝑒𝑥𝑝 −𝜀 − 𝜀
(23)𝑎′ = 𝑎 𝑒𝑥𝑝(𝜀′ ) = 𝑎 𝑒𝑥𝑝 −𝜀′ − 𝜀′
(24)where 𝑎 is the initial value of the half-thickness.
2.2.5 Dynamic behaviour of materials
Simple tensile tests, however, can not completely describe the full material behaviour, for example, when a bullet, penetrator or shaped charge jet impacts and perforates a material, the rate of deformation the projectile encounters is much higher than what is observed in conventional quasi-static material tests. The behaviour of the metal (projectile) and the armour target is different at high rates of loading than at relatively small loading rates. There are various tests that can be used to assess behaviour and measure properties. Fig. 5 summarises the range of strain rates that are of interest to material scientists and engineers. As the strain rates are increased, it is necessary to use different techniques to probe the response of the material and to measure the state of stress under dynamic loading.
15
For materials that are subjected to relatively high strain rates (when compared to quasi-static values), their strengths can be changed and, for most materials, noticeably increase. Generally speaking, metals will get stronger but less ductile at elevated strain rates, but unlike some non-metals, their stiffness is relatively unaffected by increase deformation rates.
Figure 5: Strain-rate regimes [38].
The reason for the increased strength with strain rate is due to complex micro-structural behaviour that is dependent on the nature of the material. For example, with most metals, the mechanism can be explained by dislocation movements being impeded during plastic deformation. For most metals, it is generally recognised that the dynamic yield strength of a material (or flow stress) can be defined by the following proportionality [18]:
𝜎 ∝ ln 𝜀̇ (25)
where 𝜀̇ is the strain rate; it has units of 𝑠 . The flow stress in this case is the stress taken at any point along the plastic stress-strain curve.
2.2.6 Material constitutive models
Through computational codes designated hydrocodes, one can simulate dynamic phenomena such as impact and penetration using constitutional models that are able to describe the tensile flow stress of the material. One of the most widely used equations was given by Johnson and Cook (J-C) [45]. The equation is given by:
16
where 𝐴 is the yield strength of the material, 𝐵 the strain hardening constant, 𝜀 the amount of plastic strain, 𝑛 the strain (or work) hardening exponent, 𝐶 a strain-rate constant, 𝜀̇∗ the
dimensionless plastic strain rate for 𝜀̇ (quasi-static tensile test strain rate), 𝑚 the thermal softening exponent and 𝑇 the homologous temperature {𝑇 = (𝑇 − 𝑇 )/(𝑇 − 𝑇 )},where 𝑇 is the absolute temperature, 𝑇 is the room temperature and 𝑇 is the material’s melting temperature. The first set of brackets gives the strain hardening term and can be determined by simple tensile tests. The second set represents the strain rate hardening behaviour and requires analysing the same point along the plastic stress-strain curve on multiple strain rates. Finally, the third set represents the thermal softening. This is a phenomenon generated by the considerable amount of work converted into heat during inelastic deformation. This leads to a reduction on the materials flow strength with increasing temperature. For high strain-rate applications, the process is adiabatic as there is little time for heat to be dissipated in the surrounding material.
However, this equation does not describe fracture. Johnson and Cook also proposed a model including the effects of stress triaxiality, temperature, strain rate on failure strain. The Johnson-Cook damage model is a cumulative damage-fracture model that takes into account the loading history, which is represented by the strain to fracture (𝜀 ). In other words, model assumes that damage accumulates in the material during the plastic straining (Δ𝜀) and the material breaks immediately when the damage reaches a critical value. This means the damage has no contribution on the stress field until the fracture happens. J-C is an instantaneous failure model, which means no strength remains after erosion of an element. The damage of an element is defined on a cumulative damage law:
𝐷 = ∑ (27)
In which
𝜀 = 𝐷 + 𝐷 𝐸𝑋𝑃(𝐷 𝜎∗) 1 + 𝐷 ln 𝜀̇∗ (1 + 𝐷 𝑇 ) (28)
where 𝐷 are the J-C cumulative damage model parameters and the dimensionless pressure/stress ratio (𝜎∗ is the ratio of hydrostatic stress 𝜎 per effective stress 𝜎 ) is a
measure of triaxiality of the state and defined as:
𝜎∗= = ⁄ (29)
where, 𝜎 𝜎 𝜎 are the stresses in the length, with and thickness directions respectively and 𝜏 𝜏 𝜏 are the shear stresses between the length and width, with and thickness and thickness and length directions respectively. The damage variable 𝐷 takes values between 0 and 1, where 𝐷 = 0 for an undamaged material and the failure of the elements assumed to occur when 𝐷 = 1. The failure strain and thus the accumulation of damage is a function of mean stress, strain rate and temperature [46].
17
Cockcroft-Latham (C-L) suggested another fracture criterion [47] based on the strain energy per volume unit 𝑊. This criterion is expressed as,
𝑊 = ∫ 〈𝜎 〉𝑑𝜀 ≤ 𝑊 (30)
where 𝑊 is the critical value of 𝑊 which is represented by the area under the stress-strain curve and, unlike the J-C failure criterion, can be determined from simple uniaxial tensile tests, 𝜎 is the major principal stress, and 〈 〉 is the Macauley bracket which can be defined as:
〈𝑆〉 = 𝑆 𝑖𝑓 𝑆 > 0
0 𝑖𝑓 𝑆 ≤ 0 (31)
This model however, is based on only one constant to indicate the fracture properties of a material and does not take into account the materials change in response to different strain rates for example, making it a very limited model. Nevertheless, Flores-Johnson et al [23] successfully used it, in addition to a deletion criterion for when the element temperature equals 90% of the melting temperature, to simulate ballistic impacts in various metal alloys obtaining acceptable result for preliminary analysis.
There are several more constitutive models and failure constitutive models available in commercial hydrocodes, however for this work, due to limitations in time and testing equipment, we will establish the objective of determining the strain hardening constants for the strain hardening constants for the J-C constitutive model and the C-L failure criterion.
19
3 Experimental Methodology
For this project, a 5 mm and 10 mm thick aluminium AW-5083-H111 and a 2.2 mm thick Ramor 500 steel alloys will be subjected to tensile testing at a quasi-static strain rate for the purpose of mechanical characterization. These alloys are known for their good behaviour under ballistic impacts and have already been used in effective armour products [18]. Five specimens from three rolling directions, 0º, 45º and 90º, and every thickness were produced to make for a total of 45 specimens. The current chapter will describe the fabrication and preparation method, the experimental equipment and the experimental procedure followed in order to mechanically characterise these alloys.
3.1 Fabrication Method
The selection of the material fell under the responsibility of CEiiA, the project coordinator. Ramor 500 2.2mm thick from SSAB was the steel of choice, and the AW-5083-H111, 5 mm and 10 mm thick was the aluminium acquired. The chemical composition of both can be found in Table 1 and 2, and in Table 3 their respective generic physical and mechanical properties.8
Table 1: Chemical composition of Ramor 500 (max %) [48].
C Si Mn P S Cr Ni Mo B
0.35 0.70 1.50 0.015 0.010 1.0 2.0 0.70 0.005
Table 2: Chemical composition of AW-5083-H111 (%) [49].
Si Fe Cu Mn Mg Cr Zn Ti (each) Other (total) Other 0.4 0.4 0.1 0.4 – 1.0 4.0 – 4.9 0.05 – 0.25 0.10 0.05 – 0.25 0.0 – 0.05 0.0 – 0.015
Table 3: Generic physical and mechanical properties of Aw-5083-H111 and Ramor 500.
Density (g/cm3) Melting Point (C) Modulus of Elasticity (GPa) Proof Stress (MPa) Tensile Strength (MPa) Hardness Brinell (HB) AW-5083-H111 [49] (0.2-6.3mm) 2.65 570 72 125 min. 275-350 75 AW-5083-H111 [49] (6.3-80mm) 2.65 570 72 115 min 270-345 75 Ramor 500 [50] 7.50* 717* 198* 1450 1700 480-560
* average values for high carbon content steels from [51].
The alloys were only available in flat sheets, and for this reason, the specimens were constrained to rectangular cross sections. Their fabrication also was the responsibility of CEiiA. The specimens’ dimensions and testing followed the guide lines proposed by the American Society for Testing and Materials (ASTM) E 8M standard [52] and the dimensions of the manufactured specimens are displayed in Fig. 6. Five specimens were produced for each
20
thickness and for each of the three directions relative to rolling (0º, 45º and 90º) bringing the total number of specimens to 45, being the adopted designation presented in Table 4.
Figure 6: Dimensions of the manufactured specimens, a) Ramor 500 2.2 mm, b) and c) AW-5083 of 5 mm and 10 mm thickness respectively.
Table 4: Example of the designation of a specimen and respective meaning.
AlN1045B
Material Specimens size Specimens dimensions Cutting direction Specimens designation Al – Aluminium St – Steel S – reduced size N – standard size 2.2 - 2.2 mm 5 – 5 mm 10 – 10 mm
00 – with the rolling direction 45 – oblique to the rolling direction 90 – perpendicular to the rolling direction A, B, C, D or E
Before testing could proceed, some preparations were carried out on the specimens in order to equip them for mechanical testing. The first step was the application of the strain gauges to the face of the specimen. These strain gauges will ensure that the DIC measurements are accurate, provide better readings for low strain deformations and more precise Poisson’s ratio measurements. The application of the strain gauges followed the instructions contained in their manual guide lines. The overall process is represented in Fig. 7. First the surface of the specimens was polished with sandpaper, grade #320 for the steel and #600 for the aluminium, until the surface was flat and smooth without any oxidation (Fig. 7b). Afterwards the bonding surface was cleaned by wiping it along a single direction with industrial tissue damped with acetone, and the strain gauge guide lines were scribed on the bonding area using a 4H pencil.
21
The strain gauges were then applied after adding a small amount of CC-36 adhesive on the back of the gauge and pressing them with the thumb through a polyethylene sheet inside the scribed guides. After pressing during the recommended time, the bond was checked to ensure proper adhesion to the surface (Fig. 7c). Finally, a layer of coating was applied to protect the strain gauge from the environment (Fig. 7d).
Once the strain gauges were applied, the surface treatment for the DIC could be initiated. The procedure began by surface polishing with sandpaper, grade #320 for the steel and #600 for the aluminium, as with the strain gauges (Fig. 7f). Secondly the polished surface was degreased with an acetone soaked industrial paper, unidirectionally scrubbing the specimens’ surface. Next, three layers of base white paint were applied on the clean surface (Fig. 7g). A high temperature AT 800 white paint with fast drying speed was used. This paint was chosen due to its high adherence and high strain resistance since normal spray suffered adherence problems on calibration tests. After letting the base paint dry, the stochastic patterns were generated by applying a light spray of black paint on top of the base (Fig. 7h). This time the paint was a normal acrylic based paint because it did not suffer from adhesion problems due to the small area of the dots.
Figure 7: Stages of preparation of a specimen; a) untreated surface, b) clean surface, c) applied strain gauge, d) protective coating, e) untreated back surface, f) clean back surface, g) base white paint and h) stochastic pattern.
3.2 Equipment
The tests for the steel and the 5 mm thick aluminium were carried out in a universal testing machine SHIMADZU AG-IC (Fig. 8a), installed in the Vibrations and Structures Laboratory of Universidade da Beira Interior. This equipment has a load cell type SFL-50KNAG with a limit
22
load of 50 kN and its control was performed by the manufacturer supplied software, TRAPEZIUMX V1.3.0. Through this software, the test method is defined by selecting the test mode, units, velocity of head separation, specimen dimensions and frequency of the data acquisition.
For the 10 mm thick aluminium, an INSTRON 1341 servo hydraulic universal testing machine (Fig. 8b), on the Materials Laboratory of Universidade da Beira Interior, equipped with a 2518-111100kN D load cell was used instead, due to the SHIMADZU physical limitations. The software controlling the machine was the manufacturer provided WaveMatrix V1.5. The remaining procedure was unchanged.
Figure 8: a) SHIMADZU AG-IC; b) INSTRON 1341.
For a mechanical strain measurement, accurate low strain measurements and corroboration of the DIC measured data, KFEM-1-120-C1L3M3R and KFG-1-120-D16-11L3M3S strain gauges from KYOWA, were applied to the specimens surface. The strain gauges were applied with CC-36 adhesive and the application procedure followed KYOWA’s manual as described in 3.1. The strain gauges were connected to a National Instruments TB 4330 8 channel bridge input, connected to a National Instruments PXIe-1073 chassis in order to digitize the analogical strain gauges signal. The connections were implemented as indicated by the terminal block’s manual, and the digital data obtained was then analysed and extracted to EXCEL by the systems engineering software LabVIEW 2014 V14.0f1 (32 bits). The block diagram and front panel generated for these tests are available in Appendix A.
The DIC system was home integrated due to the high cost of commercial solutions. The equipment used for it was a NIKON D3300 camera with a resolution of 24.2 megapixels, a tripod,
23
a simple light source and the stochastic patterns on the specimens’ surface. After the execution of the tests the images obtained were analysed in GOM Correlate V2.0.1 software. The GOM Correlate software is based on a parametric concept, which forms the underlying foundation for every single function. With the parametric concept, each individual element retains its creation path within the software structure. All actions and evaluation steps are fully traceable and interlinked. Individual elements can be modified and adjusted at any time, and a one-button solution updates all dependent elements automatically after changes have been made. This parametric approach ensures that all process steps are traceable, thus guaranteeing process reliability for measuring results and reports. [53]
3.3 Experimental Procedure
After the specimens were treated and dried, and the software tested, the tests were performed as follows.
Figure 9: Experimental Setup in the SHIMADZU AG-IC.
First the testing machine software was set running, one end of a specimen was clamped to the testing machines’ top clamp, and then lowered to the testing position. Secondly the Strain gages were connected to the National Instruments PXIe-1073 chassis, and then turned on as well as the computer to which it was connected. Before clamping the lower clamp, the machine and strain gauges were software calibrated. The errors associated with the clamping procedure would only be subtracted to the final results, after the test was conducted. After clamping the
24
lower end of the specimen, the prepositioned tripod and camera were readjusted so that the camera would face the specimen perpendicularly. Having the camera and lighting turned on the LabVIEW program was set running and the camera started recording. When the counter on the program went to zero and some readings appeared on the display, the test was started in the TRAPEZIUMX. The full experimental setup can be seen in Fig. 9.
The test would then resume till the specimens’ failure occurred and the machines’ software automatically stopped. The camera and LabVIEW program were manually stopped, the room temperature noted and the data from all sources was retrieved. The chassis computer and the chassis were shut down and the strain gauges disconnected. Lastly, the two pieces of the fractured specimen were unclamped, removed and the dimensions taken with a calliper. the next specimen was, then, readied for testing and the procedure reinitiated.
25
4 Results and Discussion
4.1 AW-5083-H111 Results
4.1.1 5 mm Thick Specimens
After having conducted the tensile tests, it was now necessary to process and analyse de data obtained from the different sources.
This process began by synchronizing the data from the strain gauges and the universal testing machine. This was achieved by matching key points on the load-time graph with the time-strain graph. The stress-strain curves were constructed, and the Youngs’ Modulus and the yield point at 0.2% were determined as represented in Fig. 10.
Figure 10: Engineering stress-strain curve for AlS500A, as well as the Youngs' Modulus and Youngs' Modulus at 0.2%.
Two phenomena immediately become clear in Fig. 10, consisting of both “serrations” and instabilities of high frequency oscillations in the plastic deformation region. These phenomena are present in every test from this aluminium. As Motsi et al. explain [54], the applied strain rate has an effect on the mechanical properties with regard to the dynamic strain aging (DSA).
0 50 100 150 200 250 300 350 0,00 0,05 0,10 0,15 0,20 0,25 0,30 En g St re ss (M Pa ) Eng Strain (%)
26
This causes aluminium alloy 5083 to be insensitive or, rather, to exhibit a negative strain rate sensitivity. Crystal defects exist in the material and these include substitution of matrix atoms by alloying elements with similar radius and also, the misalignment of atoms in the crystal lattice known as dislocations. In this alloy the major alloying element is Magnesium (Mg) which is very mobile. When an external stress is applied to the material, dislocations move and get temporarily arrested by obstacles [55], this characterizes the DSA phenomenon observed in the tests. During this period, the Mg atoms diffuse around the dislocation cores and remain there. Additionally, there is a formation of instabilities of high-frequency oscillations in the plastic deformation region designated as ‘serrated’ or ‘jerky’ flow [56]. These serrations are formed by a combined effect of Mg atoms migration, slip bands propagation deformation, micro-void nucleation growth and coalescence [57].
Figure 11: GOM analysis of the AlS500A Specimen loading axis strain at initial time (a), 0.2% Yield (b), maximum force (c) and just prior to rupture (d). (e) is the obtained engineering stress-strain curve.
Due to the large deformation of the test subjects, the strain gauges were unable to reach engineering strains larger than 0.25 without becoming unglued and, taking into consideration that it is impossible to predict exactly where the necking region, and for that matter, fracture, will occur, without previously notching the testing subjects, it was, as aforementioned, necessary to use a digital image correlation (DIC) technic to get accurate measurements of the strain in the necking area. The data treatment followed the method described in section 2.2.4. In Fig. 11 the full evolution of the AlS500A specimen test, from initial time (a), to yield strength (b), maximum force (c) and just prior to fracture (d) is displayed. In (e) the full engineering stress-strain curve of the specimen is displayed. Up until the maximum force the strains are relatively homogenous across the specimen, for the exception of the previous described DSA phenomenon. Soon after maximum load is reached, necking starts to form accumulating
![Figure 1: Pen Drawing of Armoured Car by Leonardo Da Vinci 1487, [5].](https://thumb-eu.123doks.com/thumbv2/123dok_br/0.940866/23.892.285.652.546.763/figure-pen-drawing-armoured-car-leonardo-da-vinci.webp)
![Figure 3: A schematic of a typical stress-strain curve for steel [18].](https://thumb-eu.123doks.com/thumbv2/123dok_br/0.940866/31.892.248.675.429.796/figure-schematic-typical-stress-strain-curve-steel.webp)
![Figure 5: Strain-rate regimes [38].](https://thumb-eu.123doks.com/thumbv2/123dok_br/0.940866/35.892.167.766.266.617/figure-strain-rate-regimes.webp)