ISSN 0102-695X DOI: 10.1590/S0102-695X2012005000109 Received 25 Mar 2012 Accepted 24 Jul 2012 Available online 18 Sep 2012
effects of in-process parameters on product
quality
Renê O. Couto,
*,2Frederico S. Martins,
1Luiza T. Chaul,
1Edemilson C. Conceição,
1Luis Alexandre P. Freitas,
2Maria
Teresa F. Bara,
1José R. Paula
11Faculdade de Farmácia, Universidade Federal de Goiás, Brazil,
2Faculdade de Ciências Farmacêuticas de Ribeirão Preto, Universidade de São
Paulo, Brazil.
Abstract: A 23 full factorial design was used to assess the impact of spraying air l ow
rate (30-50 L/min), drying air inlet temperature (90-150 ºC) and extract feed rate (4-6 g/min) on the quality of Eugenia dysenterica DC., Myrtaceae, spray-dried extracts.
Response surface methodology (RSM) was applied to analyze the signii cance of the effects of process factors on product quality and to obtain i tted equations to predict
dry powder properties. Powder yields were satisfactory, ranging from 34.64 to 63.92%. The dried products showed moisture contents and water activities below 5% and 0.5,
respectively. The recuperation ratios of total polyphenols, tannins and l avonoids
ranged from 88.66 to 99.07%, 70.38 to 81.87% and 74.51 to 98.68%, respectively.
Additionally, in some conditions the parameters related to dry product’s l owability
and compressibility varied over a range acceptable for pharmaceutical purposes. RSM
proved that studied factors signii cantly affected most of the quality indicators at
different levels. The spray drying technology is an attractive and promising alternative for the development of intermediate phytopharmaceutical products of E. dysenterica.
Keywords:
Eugenia dysenterica phytopharmaceuticals response surface methodology spray drying
Introduction
A vast interest on the development of
phytotherapics with proven efi cacy, safety and quality has
been recently demonstrated in Brazil (Rocha et al., 2008; Bueno & Bastos, 2009). From a phytopharmaceutical technology point of view, the drying of plant extracts is a crucial step to achieve a product suitable for industrial use and further therapeutic application (List & Schmidt, 1989). Within the widely used drying techniques, spray drying is the most commonly employed in the phytopharmaceutical industries (Georgetti et al., 2008).
Regarding industrial purposes, spray drying presents several advantages over the other drying
technologies, such as operational l exibility, applicability
for heat sensitive materials and affordability (Filková et al., 2007). Similarly, spray-dried extracts have a broad range of advantages over liquid forms, presenting a high stability and being easier to handle, standardize, transport and store (Oliveira et al., 2006). Furthermore, if these extracts were engineered with optimized properties, it is possible to manufacture solid dosage forms from it, which represents most of the medicines used worldwide (De Souza et al., 2006; Chaves et al., 2009). In this context, optimization
statistical tools such as Response Surface Methodology (RSM) has being successfully applied in understanding the relationship between spray drying parameters and powder properties (Vasconcelos et al., 2005; Marquele et al., 2006; Souza et al., 2007; Jangam & Thorat, 2010; Toneli et al., 2010; Oliveira et al., 2011; Couto et al., 2011; Couto et al., 2012).
Eugenia dysenterica DC., Myrtaceae, commonly known as cagaita, was chosen for this research due to its importance in Brazilian folk medicine, as well as its valuable therapeutic potential described in the literature (Costa et al., 2000; Couto et al, 2009; Lima et al., 2010; De Souza et al., 2011; Lima et al., 2011; Vieira et al., 2012). Despite E. dysenterica’s medicinal importance, there is a lack of information documenting its behavior during standardization and processing. In this work, RSM was used to investigate the effects of in-process set of conditions on the quality of E. dysenterica spray-dried extracts.
Materials and Methods
Chemicals
Rutin (98%) and tannic acid (98%) were purchased from Sigma-Aldrich® (Sigma-Aldrich
Co., Steinheim, Germany). All other chemicals were of reagent grade and were used without further purification.
Herbal material
Samples of Eugenia dysenterica DC., Myrtaceae, leaves were collected from a specimen located in a region of Cerrado (Brazilian savannah), in Nova América City, State of Goiás, Brazil (674 m, 15º 00' 29,5" South, 49º 59' 00,5" West). Once identified, a voucher specimen was prepared and deposited in the Federal University of Goiás Herbarium under the registration identification FUG-41319. The leaves were dried at room temperature and ground in a knives mill TE-625 (Tecnal Ltda, Piracicaba-SP, Brazil). Powdered material was stored sheltered from light and moisture for subsequent use in the extraction procedure.
Feed extract
The hydroalcoholic E. dysenterica extract (HE) was obtained by percolation of the powdered material (mean particle size of 394.77±4.00 µm), using ethanol:water solution (70:30 v/v) as solvent mixture. Briefly, 1 kg of powdered material was placed in contact with 300 mL of solvent into a glass flask. After an incubation period of 2 h (pre-swelling phase), this material was carefully transferred to a 10 L percolator (Revitec Ltda, São Paulo-SP, Brazil) and solvent was added to volume. This system remained in contact with powdered material for 24 h (intermediate maceration phase). Next, it was extracted exhaustively (0.2±0.05 mL/min) at room temperature (percolation phase). The extractor solvent was throughout renewed until an albumin precipitation assay no longer detects tannins. The obtained extract was evaporated at 40±2 ºC using a rotary evaporator MA 120 (Marconi Ltda, Piracicaba-SP, Brazil) coupled to a vacuum pump Te-152 (Tecnal Ltda, Piracicaba-SP, Brazil). The concentrated extract (2 L) was stored in borosilicate flasks protected from light at temperature from -2 to 8 ºC prior to characterization and further use.
Density, alcoholic content and pH were determined according to the methodologies described in the Brazilian Pharmacopoeia (2010). Total solid content of 1.0 g sample was measured with a gravimetric method in a halogen lamp analyzer MB 35 (Ohaus Inc., Pine Brook, NJ, USA). Finally, the viscosity was measured
using a viscometer Brookield model DV-III+ (Brookield
Engineering Laboratories, Inc., Middleboro, MA, USA).
Spray-dryer equipment and methodology
The drying process was performed in a laboratory-scale spray dryer model MSD 1.0 (Labmaq do Brasil Ltda., Ribeirão Preto-SP, Brazil) with concurrent flow regime and a pneumatic (two fluid) spray nozzle with inlet orifice diameter of 1.2 mm. The drying air was supplied by a blower (nominal flow rate of 1.0 m3/min) and electrically heated. The cylindrical
drying chamber was made of borosilicate glass with 160 mm in diameter and 645 mm in height. The following set of conditions was kept fixed for all experiments: nozzle air pressure was 0.4 MPa; mass of extract portion feed (WE) was 150 g. The products of E. dysenterica
extract spray drying (SDE) were separated from air by a stainless steel cyclone and collected in a glass flask. The products recovered were weighted, protected from light and stored in closed flasks in a desiccator at room temperature prior to quality determination.
Response surface methodology (RSM)
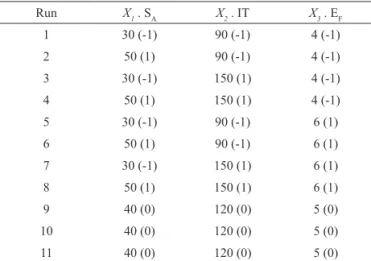
In the statistical design of experiments, RSM was used to investigate the effect of process variables on various powder properties. Spraying air flow rate (SA, 30-50 L/min), drying air inlet temperature (IT, 90-150 ºC) and extract feed rate (EF, 4-6 g/min) were selected as independent variables. Process variables were selected based on preliminary experiments and previous experience of the present research team. The 23 full factorial design matrices with coded and
non-coded values of each factor studied are shown in Table 1. In Table 1 the factors were coded to allow the Analysis of Variance (ANOVA) by the RSM following the coding rule given by equation (1):
(1)
Table 1. 23 full factorial design matrices.
Run X1 . SA X2 . IT X3 . EF
1 30 (-1) 90 (-1) 4 (-1)
2 50 (1) 90 (-1) 4 (-1)
3 30 (-1) 150 (1) 4 (-1)
4 50 (1) 150 (1) 4 (-1)
5 30 (-1) 90 (-1) 6 (1)
6 50 (1) 90 (-1) 6 (1)
7 30 (-1) 150 (1) 6 (1)
8 50 (1) 150 (1) 6 (1)
9 40 (0) 120 (0) 5 (0)
10 40 (0) 120 (0) 5 (0)
11 40 (0) 120 (0) 5 (0)
Xi: Coded factors in the experimental design; -1, 0, +1: coded levels in the experimental design; SA: Spray nozzle airflow rate (L/min); IT: Drying air inlet temperature (ºC); EF: Extract feed rate (g/min).
( )
( )
(highvalue lowvalue)
Rev. Bras. Farmacogn. Braz. J. Pharmacogn. 23(1): Jan./Feb. 2013 The ANOVA/RSM was performed on the
experimental data using the module Visual General Linear Model (VGLM) from the software Statistica 7 (Statsoft Inc., Tulsa, OK, USA). Only the factors with significance higher than or equal to 5% (p≤0.05) were
considered. The response function applied was a linear polynomial equation, given by equation (2):
Y = β0 + β1X1 + β2X2 + β3X3 + β12X1X+ β13X1X3 + β23X2X3
In equation (2), Y is the predicted response (dependent variable); β0 is the model constant; X1,
X2 and X3 are independent variables; β1, β2 and β3 are
linear coefficients; and β12, β13 and β23 are cross product
coefficients.
Dry product quality determination
Process yield (PY, % w/w), or powder recovery, was calculated immediately after the drying experiments based on ratio of the powder mass (dry basis) collected in the flask (W) to the portion of the extract feed mass (WE = 150 g) and its solid content (CS, % w.b.) by equation (3).
(3)
The powder moisture content (MC, % w.b.) was measured from 0.5 g of sample employing a halogen lamp analyzer MB 35 (Ohaus Inc., Pine Brook, NJ, USA). Water activities (AW) were measured using a thermo hygrometer Testo 650 (Testo AG, Lenzkirch, Germany) and a hermetic chamber.
Total polyphenol content (TPC) and total tannin content (TTC) in HE and SDE were determined following previously described methods (Mole & Waterman, 1987a, b), with some modifications. Ten mg (dry basis) of SDE were dissolved in 10 mL of 20% (v/v) methanol solution. HE was directly diluted 100 times with this same solution. In both TPC and TTC measurements, tannic acid was used to make the calibration curves.
Total flavonoid content (TFC) was measured according to a modified method based on Rolim et al. (2005). Ten mg (dry basis) of SDE were dissolved in 10 mL of methanol:acetic acid 0.02 M (99:1). HE was directly diluted 200 times with the methanol:acetic acid 0.02 M (99:1) solution. The absorbances of 2 mL samples were measured at 361 nm with a SP220 UV/ VIS spectrophotometer (Biospectro®, Curitiba-PR,
Brazil). Rutin was used to make a calibration curve.
Bulk (ρb) and tapped (ρt) densities, Hausner
Ratio (HR) and Carr’s Index (CI, %) were determined
according to the methods described elsewhere (USP, 2007). The product bulk density was determined by pouring 5 g of dry powder into a 25 mL graduated cylinder and measuring its volume. The tapped density was determined by controlled tapping of cylinder using a sieve shaker (Bertel Ltda, Caieiras-SP, Brazil) until a constant volume was achieved. Hausner Ratio and Carr’s Index were used to indicate the compressibility and flowability properties of the powders and were calculated using the measured values of the tapped and the bulk density of the powders, according to their definitions:
HR = ρt
ρb (4)
CI = ρt - ρb x 100 (5) ρt
The mean powder particles diameter (D50, µm) was measured from the cumulative size distribution, by sieving 20 g of powder with Tyler series sieves (710, 355, 300, 250, 180, 106 and 53 µm) and an electro-magnetic sieve-shaker (Bertel Ltda, Caieiras-SP, Brazil) for 20 min. (Brazilian Pharmacopoeia, 2010). Angles of repose
(Ө,o) were determined according to the method described
by Araújo et al. (2010). All of the above measurements, except PY, were performed in triplicate.
Results and Discussion
Characterization of the HE
The concentrated hydroalcoholic extract presented a density of 1.01±0.001 g/mL, a solids content of 10.69±0.55% (w/w), a pH of 5.003±0.075, an alcoholic content of 15.09±0.02% (v/v) and a viscosity of 6.67±0.14 mPas. The levels of TPC, TTC and TFC were, respectively, 48.38±1.00, 22.12±2.09 and 60.82±4.28% (w/w). Many studies have shown that the nature of the feed material has important effects on the quality of the powder collected
from the cyclone. However, these effects are dificult to assess in general terms, mainly due to the speciic drying
nature of most materials (Goula & Adamopoulos, 2004; Oliveira & Petrovick, 2010). Solids content, viscosity and surface tension of the liquid extract determine the type of particle drying behavior. They are directly correlated with
the packaging and lowing properties of the dried powders, since they inluence the droplet size and, consequently,
the size and shape of the dry particles (Nath & Satpathy, 1998; Walton, 2000; Paramita et al., 2010). Accordingly, evaluation of the feed extract properties is required on experimental planning and, consequently, in obtaining dried products with optimized properties.
100 × × =
S E Y
C W
W P
The efficiency of Eugenia dysenterica extract spray drying (SDE)
As shown in Table 2, PY values ranged from 34.64 to 63.92% (w/w). Powder recovery is an important variable to consider because it may indicate the adequacy of the drying parameters. The process yield in the spray drying of herbal extracts has shown to be variable, being dependent on several factors,
e.g. in-process set of conditions (Souza & Oliveira, 2006; Jangam & Thorat, 2010; Toneli et al., 2010), as well as type, proportion and incorporation time of drying adjuvants in the liquid feed (Vasconcelos et al., 2005; Couto et al., 2011). It is interesting to note that, although the researchers of the present work did not have used drying aids, satisfactory levels of process yield were obtained. The significant product recovery may be associated with the HE properties, as well as the process parameters chosen for the experimental design, leading to a low adherence of the powders on the drying chamber walls.
The moisture contents were very low in most of the products obtained, ranging from 2.9±0.02 to 4.66±0.21% (w/w). According to the literature (USP, 2007), for pharmaceutical powders, including spray-dried extracts, moisture content values lower than 5% (w/w) are considered adequate. Therefore, it is possible to conclude that all the products shown in Table 2 presented suitable levels of residual moisture. Similarly to PY, the residual moisture is closely related to the efficiency of the drying process. Moreover, MC has a considerable effect on the chemical and microbiological stability, as well as on the physical properties of the product, especially with regard to flow properties and particle size distribution (Telang & Thorad, 2010).
It can be observed in Table 2 that all powders showed water activity (AW) below 0.5, which are considered acceptable for pharmaceutical purposes (USP, 2007). In powder engineering, AW has been considered an important index because it can greatly affect the shelf life of the powder produced. By definition, AW it is the ratio of vapor pressure of water in a dried system to vapor pressure of pure water at the same temperature. The lower the water activity, the lower will be the chemical potential of water and the driving force in chemical interactions involving water. Therefore, AW is different from moisture content as it measures the availability of free water in a dried system that is responsible for any chemical and biochemical reactions, whereas the moisture content represents the water composition in a dried system (Quek et al., 2007).
In the obtained products, the levels of TPC, TTC and TFC ranged, from 45.57±1.79 to 47.76±1.06, 17.47±0.43 to 18.78±1.05 and 53.27±4.76 to
58.13±6.11% (w/w), respectively. These values have recuperation ratios ranging from 88.66 to 99.07, 70.38 to 81.87 and 74.51 to 98.68%, respectively. From these results, it is possible to assert that the different sets of drying conditions used in this study affected the polyphenolic compounds differently, with the highest degradation ratio observed in TTC. Polyphenols are assumed to be thermolabile (Marquele et al., 2006; Souza et al., 2007; Souza et al., 2008). However, in a recent publication, the present group of researches has proved that in addition to drying air temperature, other processing parameters affect the stability of these compounds (Couto et al., 2012). Undoubtedly, engineering a dried extract to present the desired content of bioavailable active compounds is the major challenge faced during the development of phytomedicines. Therefore, the correct selection of the drying set of conditions is required to guarantee the obtainment of products with suitable properties for therapeutical purposes.
In addition to drying performance evaluation and physicochemical quality control, the evaluation of several physico-mechanical properties is essential for a full characterization and validation of pharmaceutical powder technology process. In this context, HR,
CI and Ө are widely accepted in the pharmaceutical
field to predict the compressibility and flowability characteristic of the powders. In the established conditions, the Hausner ratios (HR) varied from 1.18±0.04 to 2.86±0.09, proving deficient rheological properties in most powders, since HR higher than 1.25 indicates cohesive and high internal friction powders (USP, 2007). The Carr’s Index (CI) varied from 15±0.04 to 65.06±2.48%, which is within the range considered good (11-15%) to poor, very poor (>38%) flow and compressibility characteristics (USP, 2007). Low HR and CI values define powders with low packaging stability, which contribute to higher flow.
The angles of repose varied from 40.3±1.85 to 53.47±2.15º. The literature proposes the following classification of flowing properties of the angle of
repose: excellent (25º<Ө<30º), good (31º<Ө<35º), fair (36º<Ө<40º), passable (41º< Ө <45º), poor (46º<Ө<55º), very poor (56º<Ө<65º) and very, very poor (Ө<66º)
(USP, 2007). Therefore, only one condition studied
produced powders with suitable flowability (Ө<40º).
Free-flowing powders are essential to obtaining solid dosage forms. They assure the efficiency of filling capsules and in tablet manufacturing, where do the process of filling the matrix compression (“die filling”), which are fundamental steps in the determination of content uniformity and, therefore, are closely related to the bioavailability of pharmaceutical forms (Aulton, 2001). Finally, the mean powder particles diameter
Rev. Bras. Farmacogn. Braz. J. Pharmacogn. 23(1): Jan./Feb. 2013 The size distribution of the particles is an important
factor for the compression and flow of powders (Jangam & Thorat, 2010). Therefore, D50 is also directly related to the content uniformity, solubility, dissolution rate and bioavailability of the pharmaceutical dosage forms.
The effect of in-process parameters
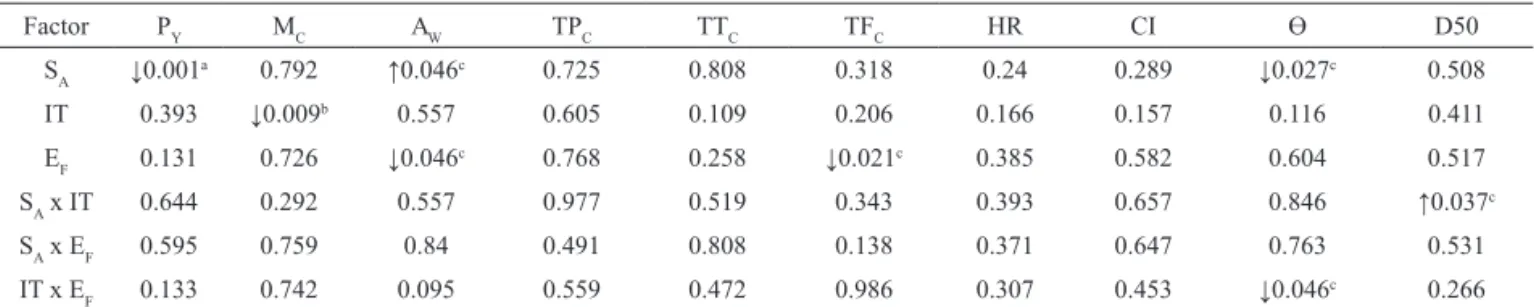
The SDE had diverse properties when different sets of conditions were applied in the drying process (Table 2). In order to precisely determine the interactions of the process factors with the quality indicators, ANOVA and correlation analyses were performed. The tables with complete ANOVAs for each powder property are omitted, but a summary of the main effects and their significance values are listed in Table 3 where the levels of significance are displayed as percentages. Table 3 also displays comments on the interactions shown to be highly significant and arrows indicate the sign of the effect (positive or negative). The response surfaces of the parameters studied, as functions of the factors that were shown to be significant, are shown in Figures 1-6.
None of the factors studied had significant effects on TPC, TTC, HR or CI (Table 3). However, spraying airflow rate (SA) exerted a strong effect on powder recovery (Table 3), with 0.1% of significance. It can be observed in the response surface shown in Figure 1 that increasing of SA had a negative influence on powder recovery, which means that the higher the SA, the lower the powder recovery will be. The higher the SA, the lower will be the mean diameter of the atomizing drops during spray drying and, consequently, the finer the dried powder. It results in lower product recovery due to a decrease in the separation of dried particles from the air by the cyclone (Filková et al., 2007).
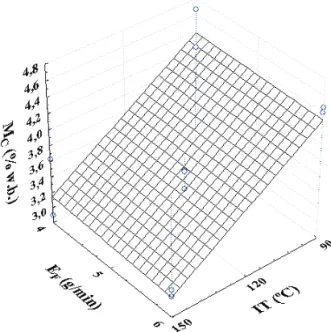
The surface response of the moisture content, MC, as a function of IT and EF, is shown in Figure 2. As shown in Table 3, IT had negative influence on the MC at a significance level of 1%. This is because at higher inlet temperature, the rate of heat transfer to the particle is greater, providing greater driving force for moisture evaporation. This is in agreement with the results published by Vasconcelos et al. (2005), working with the spray drying of Schinus terebinthifolius Raddi, Anacardiaceae.
Table 2. Results of powders characterization.
Run PY MC AW TPC TTC TFC HR CI Ө D50
1 63.92 4.66±0.21 0.31±0.001 46.19±1.03 19.06±0.93 58.13±6.11 1.55±0.05 35.48±0.95 47.72±1.96 428.95±18.15 2 41.83 4.19±0.15 0.33±0.014 45.85±0.67 19.32±0.15 56.89±5.24 1.46±0.01 31.31±1.15 40.36±1.85 353.42±12.66 3 57.06 2.9±0.02 0.31±0.008 47.39±0.49 18.78±1.05 57.88±4.24 1.18±0.04 15±0.04 53.47±2.15 367.08±15.48 4 38.18 3.63±0.01 0.37±0.013 46.98±1.11 18.52±0.39 58.45±4.15 1.5±0.03 33.33±0.57 50.19±2.38 445.75±19.45 5 55.36 4.39±0.19 0.29±0.010 46.38±1.51 18.93±0.56 55.02±4.48 1.4±0.06 28.57±1.06 51.34±1.74 481.32±13.67 6 36.2 4.45±0.03 0.33±0.015 47.51±1.22 19.02±0.07 56.32±4.38 2.86±0.09 65.06±2.48 47.72±2.12 347.83±16.89 7 60.55 3.15±0.09 0.26±0.005 46.33±0.67 18.06±0.27 55.67±4.81 1.31±0.07 23.89±1.15 52.43±2.19 208.24±9.18 8 34.64 3.07±0.01 0.29±0.007 47.41±1.17 17.57±0.33 57.01±5.05 1.25±0.02 20±0.89 43.53±2.06 449.47±10.56 9 41.4 3.58±0.09 0.31±0.011 47.76±1.06 18.71±1.11 54.39±5.25 1.32±0.05 24.44±0.46 46.39±2.05 283.53±13.7 10 43.62 3.34±0.11 0.33±0.009 44.55±0.72 17.47±0.43 53.27±4.76 1.34±0.06 25.56±1.11 47.72±1.33 234.89±11.78 11 40.37 3.56±0.15 0.34±0.015 45.57±1.79 18.45±0.10 53.83±4.10 1.36±0.03 26.67±1.09 47.72±1.18 221.27±10.37 PY: Process yield (% w/w); MC: Powder moisture content (% w.b.); AW: Water activity (-); TPC: Total polyphenol content (% w/w); TFC: Total
lavonoid content (% w/w); TTC: Total Tannin Content (% w/w); HR: Hausner Ratio (-); CI: Carr’s Index (%); Ө: Angle of repose (
o); D50: Mean
powder particles diameter (µm).
Table 3. Summary of factor effects and signiicances (p) on powder properties.
Factor PY MC AW TPC TTC TFC HR CI Ө D50
SA ↓0.001a 0.792 ↑0.046c 0.725 0.808 0.318 0.24 0.289 ↓0.027c 0.508
IT 0.393 ↓0.009b 0.557 0.605 0.109 0.206 0.166 0.157 0.116 0.411
EF 0.131 0.726 ↓0.046
c 0.768 0.258 ↓0.021c 0.385 0.582 0.604 0.517
SA x IT 0.644 0.292 0.557 0.977 0.519 0.343 0.393 0.657 0.846 ↑0.037c
SA x EF 0.595 0.759 0.84 0.491 0.808 0.138 0.371 0.647 0.763 0.531
IT x EF 0.133 0.742 0.095 0.559 0.472 0.986 0.307 0.453 ↓0.046
c 0.266
Signiicant at: a0.1%; b1%; c5%; Effects: ↑positive, ↓negative; S
A: Spray nozzle airlow rate (L/min); IT: Drying air inlet temperature (ºC); EF: Extract
feed rate (g/min); PY: Process yield (% w/w); MC: Powder moisture content (% w.b.); AW: Water activity (-); TPC: Total polyphenol content (% w/w); TFC: Total lavonoid content (% w/w); TTC: Total Tannin Content (% w/w); HR: Hausner Ratio (-); CI: Carr’s Index (%); Ө: Angle of repose (o); D50:
Figure 1. Surface response plot of process yield as a function of spraying airflow rate and drying air inlet temperature.
Figure 2. Surface response plot of moisture content as a function of drying air inlet temperature and extract feed rate.
The surface response plot of AW as a function of the spray drying factors is presented in Figure 3. Typically, the increase in SA and IT gives fine droplets, which results in a solid product with lower moisture content for constant values of other parameters. Hence, the water activity decreases as the SA and IT are increased. However, an increase in EF results in higher water activity values because the powder is partially dried and it retains more moisture (Filková et al., 2007). It is noteworthy to mention that a different trend regarding the effects of both spraying airflow rate and extract feed rate on the water activity was observed
in this work. As shown in Figure 3, AW increased with increasing SA, and decreased with increasing EF. The effect of the SA and EF on the water activity was confirmed by the ANOVA, which demonstrated a significance level of 5% for both the terms (Table 3). It may be explained by the occurrence of synergism between these parameters in the whole process, which makes the AW dependent on the balance of the factors, besides its isolated effects.
Figure 3. Surface response plot of water activity as a function of spraying airflow rate and extract feed rate.
The surface response of TFC as a function of IT and EF is shown in Figure 4. According to ANOVA (Table 3), only the EF affected the TFC, at a signiicance level of 5%. Neither SA, IT nor the interactive terms were
signiicant. It can be observed in the response surface
shown in Figure 4 that increasing of EF had a negative
inluence on total lavonoid content. An increase in EF may
have led to the formation of larger droplets, which present a greater tendency to form porous or hollow dried spheres (Mestry et al., 2011). Hence, an increase in the porosity
of the particles may have facilitated the loss of lavonoids
through an increase surface area in contact with the hot air.
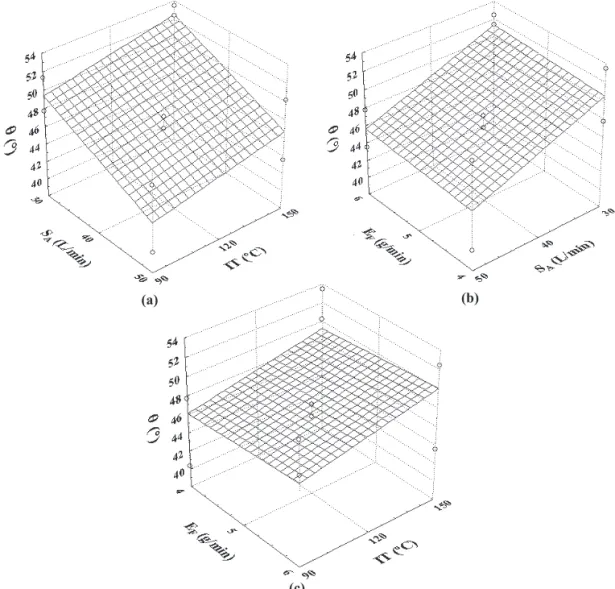
The effect of spray drying factors on the angle of repose of the products, Ө, can be seen in Figures 5 a-c. As shown in Table 3, the angle of repose proved to be dependent on the SA at a significant level of 5%. Furthermore, Ө depended on the interaction between IT and EF, also at 5%. Both SA and the interactive term had a negative influence on Ө.
Rev. Bras. Farmacogn. Braz. J. Pharmacogn. 23(1): Jan./Feb. 2013 Figure 4. Surface response plot of total flavonoid content as a function of drying air inlet temperature and extract feed rate.
is presented in Figure 6. The surface shows that D50 increased with increasing SA and IT. Indeed, both SA and IT influences particle size distribution: higher SA and IT would help to produce smaller particles and narrower distribution (Filková et al., 2007). In addition, small particles may form weak agglomerates, which lead to the production of particles with greater size (Fang et al., 2011). These results match to the trend observed to Ө, since better flowability and compressibility are expected to powders with higher particles (Jangam & Thorat, 2010).
Finally, RSM enables the fitting of polynomial equations of the dependent variables as a function of the studied factors for predicting quality indicators. As shown in Table 4, the high correlation coefficients observed in the fitted models confirm their ability to describe the experimental results. Accordingly, the spray drying technology is an attractive and promising alternative to development of intermediate phytopharmaceutical products of E. dysenterica.
Figure 5. Surface response plot of angle of repose as a function of: (a) spraying airlow rate and drying air inlet temperature; (b)
spraying airlow rate and extract feed rate; and (c) drying air inlet temperature and extract feed rate.
(a) (b)
Figure 6. Surface response plot of mean powder particles diameter as a function of spraying airflow rate and drying air inlet temperature.
Conclusions
The impact of in-process factors during the spray drying of E. dysenterica hydroalcoholic extract was assessed using RSM on the basis of various responses. ANOVA/RSM proved that studied factors,
i.e. spraying air flow rate, drying air inlet temperature and extract feed rate, significantly affected most of the quality indicators at different levels. Further optimization studies will provide useful data for a full developing and validation of a pilot spray drying method to achievement of standardized intermediate phytopharmaceutical products of E. dysenterica.
Acknowledgements
The authors gratefully acknowledge financial support from CNPq and grants from CAPES.
References
Araújo RR, Teixeira CCC, Freitas LAP 2010. The preparation of ternary solid dispersions of an herbal drug via spray drying of liquid feed. Dry Technol 28: 412-421.
Aulton ME 2001. Pharmaceutics: the science of dosage form design. Elsevier Health Sciences: Philadelphia.
Brazilian Pharmacopoeia V 2010. 5a Ed: Agência Nacional de
Vigilância Sanitária (ANVISA), Brasília.
Bueno PCP, Bastos JK 2009. A validated capillary gas chromatography method for guaco (Mikania glomerata
S.) quality control and rastreability: from plant biomass to phytomedicines. Rev Bras Farmacogn 19: 218-223. Chaves JS, Da Costa FB, Freitas LAP 2009. Development
of enteric coated tablets from spray dried extract of feverfew (Tanacetum parthenium L.). Braz J Pharm Sci 45: 1-12.
Costa TR, Fernandes OFL, Santos SC, Oliveira CMA, Lião LM, Ferri PH, Paula JR, Ferreira HD, Sales HN, Silva MRR 2000. Antifungal activity of volatile constituents of Eugenia dysenterica leaf oil. J Ethnopharmacol 72: 111-117.
Couto RO, Valgas AB, Bara MTF, Paula JR 2009. Physico-chemical characterization of Eugenia dysenterica DC. (Myrtaceae) leaves powder. Rev Eletron Farm 4: 59-69. Couto RO, Araújo RR, Tacon LA, Conceição EC, Bara
MTF, Paula JR, Freitas LAP 2011. Development of a phytopharmaceutical intermediate product via spray drying. Dry Technol 29: 709-718.
Couto RO, Conceição EC, Chaul LT, Oliveira EMS, Martins FS, Bara MTF, Rezende KR, Alves SF, Paula JR 2012. Spray-dried rosemary extracts: physicochemical and antioxidant properties. Food Chem 131: 99-105. De Souza PM, De Sales PM, Simeoni LA, Silva EC, Silveira
D, De Oliveira PM 2011. Inhibitory activity of
α-amylase and α-glucosidase by plant extracts from
the Brazilian Cerrado. Planta Med 78: 393-399. De Souza TP, Gómez-Amoza JL, Martínez-Pacheco R,
Petrovick PR 2006. Compression behavior of formulations from Phyllanthus niruri spray dried extract. Pharmazie 61: 213-217.
Table 4. Fitted equations and correlation coeficients of the experimental results.
Fitted equations R values Eq.
PY= 41.7967 - 10.755 SA- 0.86 IT - 1.78 EF- 0.4425 SA x IT - 0.5125 SA x EF + 1.7675 IT x EF 0.991824 (6)
MC= 3.493 + 0.03 SA - 0.6175 IT - 0.04 EF + 0.1325 SA x IT -0.035 SA x EF - 0.0375 IT x EF 0.964274 (7)
AW= 0.326667 + 0.01875 SA- 0.00375 IT - 0.1875 EF + 0.00375 SA x IT - 0.00125 SA x EF + 0.01375 IT x EF 0.954023 (8)
TFC= 53.83 + 0.24625 SA + 0.33125 IT - 0.91625 EF + 0.23125 SA x IT 0.41375 SA x EF + 0.00375 IT x EF 0.983822 (9)
Ө = 47.27667 - 2.895 SA + 1.56 IT + 0.41 EF - 0.15 SA x IT - 0.235 SA x EF - 2.335 IT x EF 0.95777 (10)
D50= 246.563 + 13.86 SA - 17.6225 IT - 13.5425 EF + 66.115 SA x IT + 13.075 SA x EF - 25.2375 IT x EF 0.956736 (11)
PY: Process yield (% w/w); MC: Powder moisture content (% w.b.); AW: Water activity (-); TFC: Total lavonoid content (% w/w); Ө: Angle of repose
Rev. Bras. Farmacogn. Braz. J. Pharmacogn. 23(1): Jan./Feb. 2013 Fang X, Wang J, Zhou H, Jiang X, Zhang G, Zhang D 2011.
Multiple response optimization of spray-drying process for the preparation of salvianolic acids microparticles and evaluation for potential application in dry powder inhalation. Dry Technol 29: 573-583.
Goula AM, Adamopoulos KG 2004. Spray drying of tomato pulp: effect of feed concentration. Dry Technol 22: 2309-2330.
Filková I, Huang LX, Mujumdar AS 2007. Industrial spray drying systems. In: Mujumdar AS (org). Handbook of industrial drying. London: CRC Press, p. 215-256. Georgetti SR, Casagrande R, Souza CRF, Oliveira WP, Fonseca
MJV 2008. Spray drying of the soybean extract: effects on chemical properties and antioxidant activity. LWT-Food Sci Technol 41: 1521-1527.
Jangam SV, Thorat BN 2010. Optimization of spray drying of ginger extract. Dry Technol 28: 1426-1434.
Lima TB, Silva ON, Oliveira JT, Vasconcelos IM, Scalabrin FB, Rocha TL, Grossi-de-Sá MF, Silva LP, Guadagnin RV, Quirino BF, Castro CF, Leonardecz E, Franco OL 2010.
Identiication of E. dysenterica laxative peptide: a novel strategy in the treatment of chronic constipation and irritable bowel syndrome. Peptides 31: 1426-1433. Lima TB, Silva ON, Silva LP, Rocha TL, Grossi-de-Sá MF,
Franco OL, Leonardecz E 2011. In Vivo effects of Cagaita (Eugenia dysenterica, DC.) leaf extracts on diarrhea treatment. Evid-Based Compl Alt.
doi:10.1155/2011/309390.
List PH, Schmidt PC 1989. Phytopharmaceutical Technology. Boca Raton: CRC Press.
Marquele FD, Stracieri KM, Fonseca MJV, Freitas LAP 2006. Spray-dried propolis extract. I: physico-chemical and antioxidant properties. Pharmazie 61: 325-330. Mestry AP, Mujumdar AS, Thorat BN 2011. Optimization
of spray drying of an innovative functional food: fermented mixed juice of carrot and watermelon. Dry Technol 29: 1121-1131.
Mole S, Waterman PG 1987a. A critical analysis of techniques for measuring tannins in ecological studies I. Techniques
for chemically deining tannins. Oecologia 72: 137-147. Mole S, Waterman PG 1987b. A critical analysis of techniques for
measuring tannins in ecological studies II. Techniques for
biochemically deining tannins. Oecologia 72: 148-156. Nath S, Satpathy GR 1998. A systematic approach for
investigation of spray drying processes. Dry Technol 16: 1173-1193.
Oliveira EMS, Couto RO, Pinto MV, Martins JLR, Costa EA,
Conceição EC, Paula JR, Bara MTF 2011. Inluence
of spray-dryer operating variables on the quality of
Vernonanthura ferruginea (Less.) H. Rob. extracts with antiulcer potential. J Pharm Res 4: 3251-3255.
Oliveira OW, Petrovick PR 2010. Secagem por aspersão (spray drying) de extratos vegetais: bases e aplicações. Rev Bras Farmacogn 20: 641-650.
Oliveira WP, Bott RB, Souza CRF 2006. Manufacture of
standardized dried extracts from medicinal Brazilian plants. Dry Technol 24: 523-533.
Paramita V, Iida K, Yoshii H, Furuta T 2010. Effect of additives on the morphology of spray-dried powder. Dry Technol 28: 323-329.
Quek SY, Chok NK, Swedlund P 2007. The physicochemical properties of spray-dried watermelon powders. Chem Eng Process 46: 386-392.
Rocha L, Lucio EMA, França HS, Sharapin N 2008. Mikania glomerata Spreng: desenvolvimento de um produto fitoterápico. Rev Bras Farmacogn 18: 744-747. Rolim A, Maciel CPM, Kaneko TM, Consiglieri VO,
Salgado-Santos, IMN, Velasco MVR 2005. Validation assay for total flavonoids, as rutin equivalents, from Trichilia catigua Adr. Juss (Meliaceae) and Ptychopetalum olachoides Bentham (Olacaceae) commercial extracts.
J AOAC Int 88: 1015-1019.
Souza CRF, Oliveira WP 2006. Powder properties and system behavior during spray drying of Bauhinia foricata Link extract. Dry Technol 24: 735-749.
Souza CRF, Schiavetto IA, Thomazini FCF, Oliveira WP 2008. Processing of Rosmarinus oficinalis LINNE extract on spray and spouted bed dryers. Braz J Chem Eng 25: 59-69.
Souza JPB, Tacon LA, Correia CC, Bastos JK, Freitas LAP 2007. Spray-dried propolis extract. II: prenylated components of green propolis. Pharmazie 62: 488-492.
Telang AM, Thorat BN 2010. Optimization of process parameters for spray drying of fermented soy milk.
Dry Technol 28: 1445-1456.
Toneli J, Park K, Negreiros A, Murr F 2010. Spray-drying process optimization of chicory root inulin. Dry Technol 28: 369-379.
USP XXX 2007. United States Pharmacopeia. 30º ed: United States Pharmacopeial Convention, Rockville, MD.
Vasconcelos EAF, Medeiros MGF, Rafin FN, Moura TFAL 2005. Inluence of the drying temperature and the
Aerosil®200 concentration on the characteristics of
Spray-dried extracts from Schinus terebinthifolius Raddi (Anacardiaceae). Rev Bras Farmacogn 15: 243-249. Vieira PM, Veronezi E, Silva CR, Chen-Chen L 2012. Detection
of genotoxic, cytotoxic, and protective activities of
Eugenia dysenterica DC. (Myrtaceae) in mice. J Med Food 15: 1-5.
Walton DE 2000. The morphology of spray-dried particles-a qualitative view. Dry Technol 18: 1943-1986.
*Correspondence
Renê Oliveira do Couto
Faculty of Pharmaceutical Sciences of Ribeirão Preto, University of São Paulo, Brazil.
Av. do Café – no number, 14040-903, Ribeirão Preto-SP, Brazil [email protected]