Article
Printed in Brazil - ©2016 Sociedade Brasileira de Química0103 - 5053 $6.00+0.00*e-mail: [email protected]; [email protected]
Structural Model and De-Intercalation Kinetics of Kaolinite-Methanol-Sodium
Stearate Intercalation Compound
Sen Wang,a,b Xiaochao Zuo,a Hongfei Cheng,*,a,b Yongjie Yanga and Qinfu Liu*,a
aSchool of Geoscience & Surveying Engineering and bState Key Laboratory of Coal Resources &
Safe Mining, China University of Mining & Technology, 100083 Beijing, China
Kaolinite-methanol-sodium stearate intercalation compound (Ka-MeOH-SS) was prepared by intercalation of kaolinite with dimethyl sulfoxide (DMSO) followed by displacing of DMSO with methanol and methanol by sodium stearate. The sample was characterized by X-ray diffraction (XRD), Fourier transform infrared spectroscopy (FTIR), thermal analysis (thermogravimetry (TGA) and differential scanning calorimetry (DSC)) and transmission electron microscopy (TEM). The results show that the basal spacing of Ka-MeOH-SS was enlarged to 45.5-47.9 Å and parts of its layers cocked and curled. Stearate ions were grafted on the methoxy groups and arrayed aslant in the interlayer space of kaolinite with an inclination angle of 47.45° to 52.17°. Sodium ions were adsorbed around the SiO4 tetrahedron and interlayer carboxylate anions, whereas some of them entered into the ditrigonal hole of tetrahedral sheets. The thermal de-intercalation of Ka-MeOH-SS includes three steps and the activation energy E is 98.3 kJ mol−1, logarithm of pre-exponential factor lg(A / s-1) is 9.71 and the mechanism function is f(α) = −ln (1 −α) and G(α) = 1 −α.
Keywords: kaolinite, sodium stearate, intercalation, structural model, kinetic
Introduction
Functional nanocomposites assembled by organic/ inorganic building blocks at a molecular level have gained considerable interest in the field of solid material chemistry.1,2 Layered silicate has been widely used as the
inorganic matrix for intercalation owing to its rich sources, unique structure and expandable layers. By decoration of organic guest molecules to the layers, materials with distinct characteristics and controllable physicochemical properties can be fabricated.3-5
Kaolinite Al2Si2O5(OH)4 is a 1:1 type layered clay mineral
with a crystal structure that consists of SiO4 tetrahedral
sheets and AlO2(OH)4 octahedral sheets in a periodic array
along the c-axis. Fabrication of nano-kaolinite composites is an important approach to enlarge the application range of kaolinite and intercalation is the most effective
method to prepare nano-kaolinite currently.6,7 Because
the adjacent layers of kaolinite are linked by hydrogen bonds without exchangeable positive ions between layers, only a few varieties of micromolecules (e.g., dimethyl sulfoxide,8,9 urea,10 potassium acetate11-13 and hydrazine
hydrate14) can enter into the interlayer directly, whereas
the other non-polar micromolecules and macromolecules enter into the interlayer through “displacement”. In
1999, Komori et al.15 prepared a kaolinite-alkylamine
intercalation compound through secondary displacement and tentatively studied the property of this compound.
Similarly, Matusik and Kłapyta16 prepared a
kaolinite-benzyl ammonium chloride intercalation compound in 2013, enlarging the basal spacing of kaolinite to 1.4-3.8 nm and discussed the presence of benzyl ammonium chloride between the layers.
Sodium stearate is a salt of long-chain saturated fatty acid. Although acetate intercalated kaolinite has
been widely studied,11-13 little work has been done on
the study of kaolinite intercalation compound with
sodium stearate.17 Moreover, previous study on sodium
stearate intercalated kaolinite mainly focused on the
preparation and characterization of the compound,17 and
thus information on the structure of the model and the kinetics is limited.
A structural model of Ka-MeOH-SS was proposed. In addition, the de-intercalation kinetics was investigated using thermodynamic method. “Kinetic Triplet” was obtained through determining the most probable mechanism function using Satava and Ozawa methods, and the activation energy E and pre-exponential factor A were calculated.
Experimental
Materials
A well-ordered kaolinite (denoted hereafter as Ka, 95 mass%) with a Hinckley index of 1.31 from Zhangjiakou, Hebei Province, China, was used. The chemical composition of Ka (in terms of oxides) in mass% is: SiO2, 44.64; Al2O3, 38.05; Fe2O3, 0.22; MgO, 0.06;
CaO, 0.11; Na2O, 0.27; K2O, 0.08; TiO2, 1.13; P2O5, 0.13;
MnO, 0.002; and loss on ignition, 15.06. The dimethyl sulfoxide (DMSO), methanol and absolute ethyl alcohol were purchased from Xilong Chemical Company, China, whereas the sodium stearate were purchased from Beijing Chemical Reagents Company, China.
Synthesis of intercalation compound
10 g of Ka was thoroughly mixed with 90 mL DMSO and 10 mL distilled water at 90 °C for 6 h. The solid product (Ka-D) in the mixture was separated by centrifugation and dried at 70 °C for 1 day. The method for intercalation of methanol was based on a previous report.18 5 g of the Ka-D
was added into 100 mL methanol at room temperature for 1 day. After the wet sample was separated by centrifugation, it was added to fresh methanol and stirred for 1 day again. This procedure was repeated 10 times, then a wet Ka-MeOH was separated by centrifugation. 2 g of the wet Ka-MeOH was mixed with 10 g of the sodium stearate and 100 mL ethanol solution (90 mass%) at 80 °C for 3 days to prepare Ka-MeOH-SS. The supernatant was discarded and the precipitate was washed for 3 times with ethanol (mass:volume = 1 g:10 mL) to remove excess sodium stearate. Finally, the solid product (Ka-MeOH-SS) was dried at room temperature for 2 days and ground into powder for further use.
Characterization
The X-ray diffraction (XRD) patterns were recorded on a Rigaku D/max 2500PC X-ray diffractometer with Cu Kα (λ = 1.54178 Å) irradiation in the 2θ range between
2.5 to 60° at a speed of 2° min−1. Fourier transform
infrared spectroscopy (FTIR) spectra were collected on
a Thermofisher Nicolet 6700 spectrometer (32 scans at 4 cm−1 resolution) within the range of 400-4,000 cm−1 in
KBr pellet form (2 mg sample in 200 mg kilned KBr). Thermogravimetric (TGA) and differential scanning calorimetric (DSC) analysis were performed with a Mettler-Toledo TGA-DSC I/1600 HT simultaneous thermal analyzer under a flowing nitrogen atmosphere
(100 mL min−1). Approximately 20 mg of sample power
was placed in alumina crucibles and heated from 30 to 1,100 °C at a heating rate of 10 °C min−1. The kinetics of
thermal de-intercalation of Ka-MeOH-SS in nitrogen was studied at several heating rates of 6, 8, 10, and 12 °C min−1
by thermogravimetric analysis (TGA). Transmission electron microscopy (TEM) observations were conducted on a 300 kV FEI-Tecnai G2 F30 S-TWIN high-resolution transmission electron microscope.
Results and Discussion
XRD analysis
The XRD patterns of Ka, Ka-D, Ka-MeOH (wet) and Ka-MeOH (dry) are shown in Figure 1. Ka exhibits a typical diffraction pattern with the d001 = 7.2 Å and d002 = 3.6 Å
at 12.32° and 24.85° (2θ) (Figure 1a), respectively.
The two values matched well with the standard ICDD reference pattern 14-0164 [kaolinite, Al2Si2O5(OH)4]. It
is the characteristic value for this mineral. When Ka was intercalated with DMSO, the d001 value was expanded from
7.2 to 11.3 Å (Figure 1b), confirming the intercalation of DMSO molecules into the interlayer space of Ka, which
is in agreement with the results published before.19-21
The basal reflection of Ka-MeOH (wet), the methanol-intercalated Ka obtained in a wet state, is 9.2 Å (Figure 1c).
According to previous studies,18,22 the configuration of
Ka-MeOH (wet) is a typical interlayer structure which is composed of monolayer methanol molecules between the siloxane surface and the methoxy-modified inner surface in which the initial aluminol (AlOH) groups in the interlayer space were converted to AlOMe groups. After the drying,
the d001 value of Ka-MeOH (dry) was reduced to 8.6 Å
(Figure 1d). This decrease in d001 value was caused by the
escape of free methanol molecules from the interlayer space of Ka during drying process.17,18,22
The XRD patterns of Ka-MeOH-SS at different reaction time were shown in Figure 2. A new peak at
a distance of 45.5 Å close to 2° (2θ) can be clearly
identified in Figure 2a, which signifies the penetration of sodium stearate molecules into the interlayer space of Ka, resulting in an increment of interlayer distance by 38.3 Å.
45.5, 46.4 and 47.9 Å, respectively, which shows a slight tendency to grow with prolonged time. This phenomenon may be attributed to the change of the arrangement mode or inclination angle of sodium stearate molecules in the interlayer space of Ka. Moreover, two diffraction peaks
belonging to the d001 planes of Ka and Ka-MeOH (dry)
are also observed at 12.35° and 10.28° (2θ), respectively, indicating that partially pure Ka and MeOH-intercalated Ka remain after the grafting process. The intercalation ratio of Ka-MeOH-SS is 80.2%, as calculated from the equation Intercalation ratio = II / (II + Ik), whereIIand IK
are the intensities of (001) diffraction of the compound and
unexpanded Ka component in the compound, respectively.23
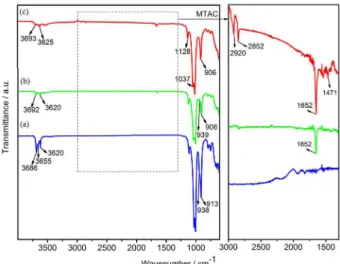
FTIR spectra
The FTIR spectra of Ka, Ka-MeOH (dry) and Ka-MeOH-SS are shown in Figure 3. As is known for Ka, the absorption bands at 3686 and 3655 cm−1 are ascribed to
the stretches of inner-surface hydroxyls, whose intensities and positions are usually affected by intercalation and grafting of guest molecules, whereas the band at 3620 cm−1
belongs to the stretch of inner hydroxyls and it is generally not affected by guest molecules.6,24,25 Additionally, the
vibrational bands at 938 and 913 cm−1 are associated with
the bend of inner-surface O−H and Al−OH groups of
Ka, respectively.26,27 The grafting of methanol molecules
lead to a shift of Al−OH bending band at 913 to 906 cm−1
with a significant intensity loss (Figure 3b), indicating the formation of methoxy groups between methanol
and inner-surface Al−OH groups of Ka via an alcohol
condensation reaction.22,28 However, the stretching vibration
of inner hydroxyls at 3620 cm−1 has not been affected by
this process, indicating that the graft of methanol are only
on the inner-surface O−H. Moreover, an additional weak
band at 1652 cm−1 is due to O−H bending vibration of
water molecules.
In the FTIR spectrum of Ka-MeOH-SS (Figure 3c), several typical vibrations bands of sodium stearate
molecules, including 2920, 2852 and 1471 cm−1, are
observed. The bands at 2920 and 2852 cm−1 correspond to the
antisymmetric and symmetric stretching vibrations of C−H
groups, respectively, whereas the weaker band at 1471 cm−1
is caused by C−O vibrations.18 In the high-frequency region,
alterations in both the intensity and position of vibrational band of inner-surface hydroxyls at 3693 cm−1 indicates the
occurrence of hydrogen bonds between sodium stearate molecules and methoxy groups. In addition, comparing the FTIR spectra of Ka and Ka-MeOH (dry), the characteristic band of inner hydroxyls at 3620 cm−1 shifted to 3625 cm−1.
This may be attributed to the entrance of some sodium ions into the ditrigonal hole in the tetrahedral sheet of Ka during intercalation process, resulting in the change of vibrational mode of inner hydroxyls. Through the above data analysis, we suppose that sodium stearate molecules have been intercalated into the interlayers of Ka.
Figure 1. XRD patterns of Ka and Ka intercalation compounds: (a) Ka;
(b) Ka-D; (c) Ka-MeOH (wet); (d) Ka-MeOH (dry).
Figure 2. XRD patterns of Ka-methanol-sodium stearate intercalation
compounds at different time: (a) 24 h; (b) 48 h; (c) 72 h.
Transmission electron microscopy (TEM)
The morphological characteristics of Ka, Ka-D, Ka-MeOH and Ka-MeOH-SS were obtained from measurements of individual particles by TEM. Representative examples for each are displayed in Figure 4. Ka reveals a typical pseudo-hexagonal crystalline form containing straight edges and smooth surfaces (Figure 4a). Simplified as a circle particle, the average size of Ka is approximately 0.5-3 µm. The DMSO intercalation and methanol modification did not change the platy morphology of Ka (Figures 4b and 4c). It is observed that the shape of most Ka-MeOH-SS are platy particles, whereas parts of the layers cocked and curled (Figures 4d and 4f), resulting from the delamination and rolling of partial Ka particles.18 The
intercalation of sodium stearate molecules into interlayers of Ka have obviously enlarged the interlayer space and further destroyed the hydrogen bonds between adjacent layers, which aggravated the mismatch of silicon-oxygen tetrahedron and aluminium-oxygen octahedron of Ka,
thus parts of the layers cocked and curled to achieve octet stability.
Thermal analysis
The TGA and DSC measurement of Ka and its intercalation compounds were performed and the results are shown in Figure 5. Only one mass loss was observed by 12.60% in the temperature interval of 450-650 °C on the TGA curve of the Ka, corresponding to the endothermic DSC peak at 529 °C (Figure 5a). The mass loss is considered to be caused by dehydroxylation process with formation of metakaolinite.29-32 Moreover, one exothermic
peak is also observed in the DSC curve at 996 °C, without any mass loss in the TGA curve, which belongs to the crystallization of mullite.33
For Ka-MeOH (dry), two major mass losses of 2.03 and 12.54% occur in the ranges of 60-180 and 383-607 °C in the TGA curves, respectively (Figure 5b). The first is assigned to the elimination of physically adsorbed water or methanol
molecule, while the second is attributed to the removal of the grafted methoxy groups and the dehydroxylation
of Ka.18,29-31 The dehydroxilation also gives rise to an
endothermic peak at 510 °C in the range of 383-607 °C in the DSC curve, which is apparently decreased comparing with that of original Ka. This may be due to the weakening of the interlayer hydrogen bonds and crystallinity of Ka during intercalation of methanol molecules.29,34,35
Three major mass loss steps were discovered on the
TGA curve of Ka-MeOH-SS (Figure 5c): (i) a mass loss
of 1.84% in the range of 70-180 °C, corresponding to the removal of adsorbed water or methanol molecules, which
is similar to the TGA curve of Ka-MeOH (dry); (ii) a
second mass loss of 2.95% in the range of 180-306 °C, accompanied by a DSC peak centered at 211 °C, which is due to the de-intercalation of intercalated stearate radical ions. This process was also corroborated by appearance
of the new peak at 2920 and 2852 cm−1 in the FTIR
spectra; (iii) a third mass loss between 405 to 650 °C,
corresponding to the DSC endothermic peak centered at 510 °C, which is attributed to the removal of the grafted methoxy groups and the dehydroxylation of Ka. Moreover, in the high temperature range (800-1300 °C), a DSC exothermic peak at 999 °C is caused by the formation of γ-Al2O3 and the phase transformation from γ-Al2O3
and amorphous SiO2 to mullite, according to previous
literatures.29,33,36
De-intercalation reaction kinetics
Kinetic study aims to obtain the “Kinetic Triplet” [pre-exponential factor A, activation energy E and kinetic model function f(α) or G(α)] that can describe a chemical
reaction.37 Thermal analysis and kinetic calculation of
Ka-MeOH-SS can help characterize the de-intercalation process, speculate the intercalation mechanisms and provide scientific basis for control over intercalation reactions.
According to theories of isothermal kinetics, the kinetic equations of solid decomposition reaction are generally expressed as:
(1)
(2)
(3)
In the equations 1 to 3, α, A, E, R, T, f(α) and G(α)
are percent conversion, pre-exponential factor (s−1),
apparent activation energy (J mol−1), universal gas constant
(J mol−1 K−1), degree Kelvin (K) and differential kinetic
model and integral kinetic model functions, respectively. Moreover, in the process of raising temperature at an equal rate:
(4)
where β is the heating rate (K min−1). Equations 1, 2 and 4
are then combined, and Satava integral method is worked out through variables separation, integrated deformation, and derivation in other forms:
(5)
Equation 5 can be transformed into:
(6)
For the peak temperature (Tpi) at various thermograms
(βi):
(7)
The values of α are approximately equal for the different
peak temperatures (Tpi), thus, the apparent activation
energy E can be obtained through Tpi, which is the Ozawa
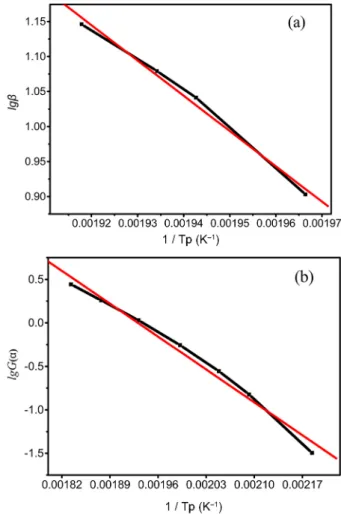
method. A graph (Figure 6a) can be drawn according to the peak temperature at different heating rates and the activation energy E in the reaction is 91.8 kJ mol−1.
Based on the Satava integral formula, lg [G(α)] has a linear relationship to 1/T, thus, the thermogravimetric data of Ka-MeOH-SS can be used for linear fitting, and the values of E and A can be obtained through the slope and intercept. After the calculation, five mechanism functions with goodness of fit above 99% are chosen, and the values of E and A are in the normal range of de-intercalation kinetics (E = 80-250 kJ mol−1, lg (A / s-1) = 7-30, see Table 1).
Obviously, if only the optimal goodness of fit is used as criterion for the most probable mechanism function, No. 36 function is the optimal mechanism. However, the
value of E is 91.8 kJ mol−1 based on Ozawa method, and
the E of No. 16 function (i.e., 98.3 kJ mol−1) is closest
to 91.8 kJ mol−1 with |E
o – Es| / Eo equals to 0.07, that is
lesser than 0.10. Thus, No. 16 function (Figure 6b) is the most probable mechanism function of the de-intercalation reaction of Ka-MeOH-SS. The mechanism function is f(α) = −ln (1 − α), G(α) = 1 − α.
Structural model of Ka-MeOH-SS
The analyses of XRD pattern and stereochemistry have been commonly used to infer the array pattern of organic molecules/ions between the layers of Ka. According to the FTIR and XRD results in this study, the intercalation mechanism of Ka-MeOH-SS is studied and an array pattern of sodium stearate between layers of Ka is put forward.
Figure 7 shows that the 001 reflection of Ka-MeOH exists on the XRD pattern of Ka-MeOH-SS all the time. After Ka-MeOH-SS was washed by ethanol, the characteristic diffraction peak of Ka-MeOH-SS disappears, whereas the 001 reflection of Ka-MeOH becomes more noticeable (Figure 7a). Furthermore, the intercalation ratio of Ka-MeOH
intercalation compound is 89.5%, approximately equal to that (89.6%) where methanol molecules totally displaced DMSO (Figure 1c), implying that methanol remains being grafted on the surface of AlO2(OH)4 octahedral sheets of Ka,
that exist with sodium stearate in the interlayer space of Ka during the reaction process.
Table 1. Results of experimental data by Satava integral method
Mechanism function
Goodness of
fit / % E / (kJ mol−1) lg (A / s-1)
No. 9 function 99.74 217.7 21.30
No. 16 function 99.27 98.3 9.71
No. 17 function 99.27 147.5 14.75
No. 18 function 99.27 196.7 19.84
No. 36 function 99.81 133.7 13.69
Figure 6. Linear fitting curves by Satava integral method (a) and Ozawa
method (b).
Figure 7. XRD patterns of Ka-MeOH (dry) and Ka-MeOH-SS (after
Ka is prone to adsorb negative charges on its end face and surface. When sodium stearate was dissolved in water, stearate radical ions and hydrated sodium ions were formed. As a result, stearate radical ions approached the Ka gradually and finally formed hydrogen bonds with the two hydrogen atoms of −CH3 on the methoxyl groups,
owing to their ability to attract protons of the two oxygen
atoms on −COO− on stearate radical ions. Moreover, the
SiO4 tetrahedral sheet of Ka is electronegative; hence,
electropositive sodium ions were absorbed on its surface. According to the shift of the vibration bands of inner-surface hydroxyls on the FTIR spectra, some sodium ions entered into the ditrigonal holes of the SiO4 tetrahedral
sheets.
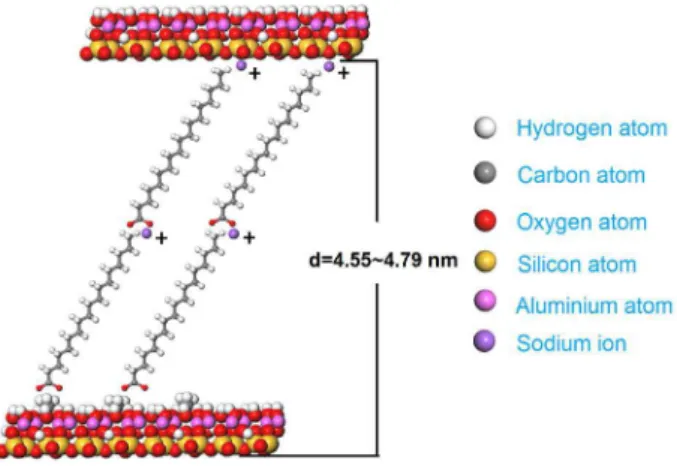
The length of the molecular chain of stearate radical ions along the macro-axis is 2.26 nm. Methoxyl groups are grafted on the AlO2(OH)4 octahedral sheets, and its
molecular chain is as long as 0.16 nm. Moreover, the SiO4
tetrahedral and AlO2(OH)4 octahedral (TO) of Ka are as
thick as 0.54 nm. Obviously, within the 4.55-4.79 nm distance of interlayer space, (4.55-4.79) nm − 0.16 nm − 0.54 nm = (3.85-4.09) nm is left, excluding the thickness of methoxyl groups and TO. This length is larger than the length of stearate radical ions (2.26 nm), but smaller than the double length (2.26 nm × 2 = 4.52 nm). Thus, two layers of stearate radical ions are arranged aslant during the interlay of Ka.
As for the two-layer gradient stearate radical ions, the
−CH3 on one layer can form hydrogen bonds with −C=O
and −C−O on the other layer, which result in that the layer
on which −COO− has not combined with methoxyl groups
arrange towards the interlayer space of Ka. From the perspective of electrostatic attraction, some hydrate sodium ions can be absorbed around this layer. According to the radius of sodium ion (0.10 nm) and the thickness of hydrate layer (about 0.16 nm), the diameter of hydrate sodium ion is calculated to be (0.16 nm × 2) + (0.10 nm × 2) = 0.52 nm. Based on previous data, the inclination angle of stearate radical ions in the interlayer space of kaolinite is 47.45° to 52.17°. Figure 8 displays the interlamination structure of Ka-MeOH-SS.
Conclusions
Ka-MeOH-SS was prepared using Ka-MeOH as the precursor; analysis through XRD and FTIR revealed that the interlamellar spacing of Ka-MeOH-SS was 45.5-47.9 Å and the intercalation ratio was 80.2%. Reaction duration exerted the inclination angle of sodium stearate between the interlayer: the interlamellar spacing of Ka-MeOH-SS would enlarge with prolonged time.
Figure 8. Possible structural model of Ka-methanol-sodium stearate
intercalation compound.
Intercalation of sodium stearate destroyed the hydrogen bonds between adjacent layers, resulting in some frizzled layers of Ka-MeOH-SS. Thermal analysis revealed three steps in the thermal de-intercalation of Ka-MeOH-SS; its de-intercalation reaction conformed to the Mample Separate Law. The most probable mechanism was obtained as random nucleation and subsequent growth. Every particle was assumed to have one nucleus, A1, F1, and S shaped
α-t curve (n = 1, m = 1). The functions of most probable
mechanism, activation energy E and pre-exponential factor were found to be f(α) = −ln (1 −α), G(α) = 1 −α, E = 98.3 kJ mol−1 and lg (A / s-1) = 9.71, respectively.
The stearate radical ions were grafted on the methoxy groups and aslant arrayed in the interlayer space of Ka with an inclination angle of 47.45° to 52.17°. Sodium
ions were absorbed around the SiO4 tetrahedron and
interlaminar −COO−, whereas some ions entered into the
ditrigonal hole of the tetrahedral sheets. The preparation of Ka-MeOH-SS enlarged the scale of the Ka intercalator and provided a new method for exfoliation of Ka. This process is beneficial for increasing the value and expanding the application of Ka.
Acknowledgments
The authors are grateful to the financial support from the National Natural Science Foundation of China (No. 51034006), Beijing Joint-Construction Project (20121141301) and Beijing Nova Program (xx2015B081).
References
1. Ogawa, M.; Kuroda, K.; Chem. Rev.1995, 95, 399.
2. Khan, A. I.; O’Hare, D.; J. Mater. Chem.2002, 12, 3191. 3. Letaief, S.; Tonle, I. K.; Diaco, T.; Detellier, C.; Appl. Clay Sci.
4. Park, Y.; Ayoko, G. A.; Kristof, J.; Horváth, E.; Forst, R. L.; J. Therm. Anal. Calorim. 2012, 110, 1087.
5. Hu, H.; Gan, M.; Ma, L.; Li, Z.; Li, Y.; Ge, C.; Tu, Y.; Yu, L.; Huang, H.; Yang, F.; Compos. Sci. Technol.2014, 104, 9.
6. Zhang, S.; Liu, Q.; Cheng, H.; Zhang, Y.; Li, X.; Forst, R. L.;
Appl. Clay Sci.2015, 114, 484.
7. Dedzo, G. K.; Detellier, C.; Appl. Clay Sci.2014, 97-98, 153. 8. Frost, R. L.; Kristof, J.; Horvath, E.; Kloprogge, J. T.;
Thermochim. Acta1999, 327, 155.
9. Gardolinski, J. E.; Carrera, L. C. M.; Cantão, M. P.; Wypych, F.; J. Mater. Sci.2000, 35, 3113.
10. Makó, E.; Kristóf, J.; Horváth, E.; Vágvölgyi, V.; J. Colloid Interface Sci.2009, 330, 367.
11. Ledoux, R. L.; White, J. L.; J. Colloid Interface Sci.1966, 21,
127.
12. Frost, R. L.; Locos, O. B.; Kristof, J.; Kloprogge, J. T.; Vib. Spectrosc.2001, 26, 33.
13. Frost, R. L.; Kristof, J.; Rintoul, L.; Kloprogge, J. T.;
Spectrochim. Acta, Part A2000, 56a, 1681.
14. Cruz, M. D. R.; Franco, F.; Clays Clay Miner.2000, 48, 586.
15. Komori, Y.; Sugahara, Y.; Kuroda, K.; Appl. Clay Sci.1999, 15, 241.
16. Matusik, J.; Kłapyta, Z.; Appl. Clay Sci. 2013, 83-84, 433. 17. Sidheswaran, P.; Bhat, A. N.; Ganguli, P.; Clays Clay Miner.
1990, 38, 29.
18. Yuan, P.; Tan, D.; Annabi-Bergaya, F.; Yan, W.; Liu, D.; Liu, Z.; Appl. Clay Sci. 2013, 83-84, 68.
19. Martens, W. N.; Frost, R. L.; Kristof, J.; Horvath, E.; J. Phys. Chem. 2002, 106, 4162.
20. Thompson, J. G.; Clays Clay Miner. 1985, 33, 490.
21. Raupach, M.; Barron, P. F.; Thompson, J. G.; Clays Clay Miner.
1987, 35, 208.
22. Tunney, J. J.; Detellier, C.; J. Mater. Chem.1996, 6, 1679. 23. Lagaly, G.; Ogawa, M.; Dekany, M. In Handbook of Clay
Science; Bergaya, F.; Theng, B. K. G.; Lagaly, G., eds.; Elsevier: Amsterdam, 2006, pp. 355.
24. Guerra, D. L.; Airoldi, C.; J. Braz. Chem. Soc.2009, 20, 19. 25. Adams, J. M.; Clays Clay Miner.1978, 26, 169.
26. Letaief, S.; Elbokl, T. A.; Detellier, C.; J. Colloid Interface Sci.
2006, 302, 254.
27. Elbokl, T. A.; Detellier, C.; J. Colloid Interface Sci.2008, 323, 338.
28. Kuroda, Y.; Ito, K.; Itabashi, K.; Kuroda, K.; Langmuir 2011,
27, 2028.
29. Cheng, H.; Liu, Q.; Yang, J.; Ma, S.; Frost, R. L.; Thermochim. Acta2012, 545, 1.
30. Ptáček, P.; Šoukal, F.; Opravil, T.; Nosková, M.; Havlica, J.; Brandštetr, J.; Powder Technol. 2010, 203, 272.
31. Yang, S. Q.; Yuan, P.; He, H. P.; Qin, Z. H.; Zhou, Q.; Zhu, J. X.; Liu, D.; Appl. Clay Sci.2012, 62-63, 8.
32. Faria, E. H. D.; Ciuffi, K. J.; Nassar, E. J.; Vicente, M. A.; Trujillano, R.; Calefi, P. S.; Appl. Clay Sci.2010, 48, 516.
33. Elbokl, T. A.; Detellier, C.; J. Colloid Interface Sci. 2008, 323, 338.
34. Sahnoune, F.; Saheb, N.; Khamel, B.; Takkouk, Z.; J. Therm. Anal. Calorim.2012,107, 1067.
35. Cheng, H.; Liu, Q.; Cui, X.; Zhang, Q.; Zhang, Z.; Frost, R. L.;
J. Colloid Interface Sci. 2012, 376, 47.
36. Smith, M. E.; Neal, G.; Trigg, M. B.; Drennan, J.; Appl. Magn. Reson.1993, 4, 157.
37. Elder, J. P.; Thermochim. Acta 1998, 318, 229.