Article
J. Braz. Chem. Soc., Vol. 22, No. 11, 2157-2164, 2011. Printed in Brazil - ©2011 Sociedade Brasileira de Química 0103 - 5053 $6.00+0.00
A
*e-mail: [email protected]
Automation of an Analysis System with Microvolume Porous Membrane Sampling,
Capillary Electrophoresis Separation and Contactless Conductivity Detection for
Near-Real-Time Monitoring of Traces of Low-Molecular-Weight
Carboxylic Acids in Air
Lúcia H. G. Coelho and Ivano G. R. Gutz*
Instituto de Química, Universidade de São Paulo, Av. Prof. Lineu Prestes, 748, 05508-000 São Paulo-SP, Brazil
Um sistema automatizado de análise foi projetado pelo acoplamento de microamostrador difusional baseado em uma membrana capilar microporosa (CMDS) com a separação por eletroforese capilar (CE) e detecção condutométrica sem contato (C4D). O volume interno do
CMDS, da ordem de 30 µL, combinado com a demanda de nanolitros dos equipamentos de CE-C4D, levou à concepção de um sistema automatizado de gerenciamento de fluido de baixo custo
e livre de manutenção recorrente, baseado em bombas de aquário e válvulas de estrangulamento controladas via software, uma interface CMDS-CE de pequeno volume e um equipamento robusto de CE operado com injeção hidrodinâmica. Como exemplo de aplicação do sistema, foi demonstrada a amostragem conjunta de ácido fórmico e ácido acético no ar, com elevados fatores de pré-concentração em fase líquida, e quantificação por CE-C4D a uma frequência de
operação ininterrupta de 10 análises completas por hora. Os limites de detecção estimados foram de 1,2 µg m-3 para o ácido fórmico e 3,0 µg m-3 de ácido acético no ar, com resposta linear no
intervalo de concentração usual desses analitos em fase gasosa da atmosfera.
An automatic analysis system was designed by coupling a complete microvolume sampler based on a capillary membrane diffusion scrubber (CMDS) to capillary electrophoresis (CE) equipment with capacitively coupled contactless conductometric detection (C4D). The microliter
capacity of the CMDS, matching with the nanoliter demands of the CE-C4D equipment, led to the
design of an automated system with fluid management based on affordable and maintenance free aquarium pumps, pinch valves under computer control, a miniaturized CMDS-CE interface and a rugged CE equipment operated with hydrodynamic injection. As an application of the system, it was successfully demonstrated that formic acid and acetic acid in air can be quantitatively sampled together, with high pre-concentration ratio, and quantified at a frequency of 10 complete analyses
per hour of unattended operation, but electrolyte renewal on a daily basis. Limits of detection of 1.2 µg m-3 for formic acid and 3.0 µg m-3 for acetic acid in air, were estimated with linear response
over the usual concentration range of these analytes in the gas phase of the atmosphere.
Keywords: air pollution, microporous polypropylene membrane, flow analysis, capillary electrophoresis, contactless conductivity detection
Introduction
For many relevant air pollutants at trace levels, analytical chemistry cannot yet fulfill goals like continuous, selective, highly sensitive and automatic gas phase measurements, with rugged instrumentation capable of remote and unattended operation during extended periods of time,1
despite many recent developments in the field.2 Common
shortcomings include lack of sensitivity or selectivity, too expensive, complex, bulky or energy-demanding instrumentation for field use, slow response, measurements in liquid (or solid) phase only, lengthymethods, unstable reagents or need for frequent calibration. Therefore, separate sampling steps, frequently with preconcentration, are still widely used in combination with in-situ or ex-situ
in diffusion scrubbers (porous or permeable membrane), derivatization at solid (or liquid) sorbents packed in columns or coated on the walls of glass tubes (denuders), condensation at low temperature and cryotrapping in a solid matrix.1,3-6
The porous Teflon® membrane-based diffusion
scrubber (DS) was introduced by Dasgupta et al.7 in 1986.
In subsequent works, porous polypropylene membranes were used as well for atmospheric gases sampling and preconcentration followed by photometric determination, mainly based on fluorescence detection.8,9 Despite the
great sensitivity of the fluorescence technique for some classes of chemical species, the determination of multiple analytes in atmospheric air usually requires coupling of the DS with a separation technique like ion chromatography (IC) or capillary electrophoresis (CE) with an appropriate detector. Examples include DS collection of acidic and basic gases present in air followed by IC separation with conductometric detection10,11 and DS sampling of
formaldehyde in the atmosphere and further separation by CE and detection by C4D.12
Flow analysis (FA) is an attractive approach for the implementation of concentration and sample pre-treatment procedures, offering much higher operating frequency and repeatability than manual handling of samples and reagents.13 Integration of high resolution CE
separations with FA sample processing is particularly attractive and reviews on the subject are available.14-18
Former experience with complete construction of FA-CE systems19-21 as well as with gas samplers based on
microporous capillaries12,22 favored the development and
automation of a complete system for online sampling, pre-concentration, separation and determination of some gaseous pollutants like low-molecular weight carboxylic acids in air (mainly formic and acetic acids). It comprises a downsized capillary membrane diffusion scrubber (CMDS)22 directly associated with the CE equipment by
a low-volume fluid interface, low-flow propulsion devices and pinch valves assembled together in an automated module that operates as a total analysis system (TAS).
Since most species of interest are non-colored ones, instead of indirect UV-Visible absorption, conductivity detection was preferred in this work, based on accumulated experience with environmental matrices.12,22-24 The TAS
CMDS-CE-C4D performed 10 analyses per hour, with high
sensitivity (due to the pre-concentration sampling device) and selectivity (due to the electrophoretic separation) being well suited for unattended near-real-time monitoring of multiple gaseous pollutants in the atmosphere, as demonstrated for two monocarboxylic acids, formic and acetic ones.
Experimental
CMDS construction
The CMDS device has been described in more detail elsewhere.22 The capillary of the polypropylene microporous
membrane (Oxyphan® from Membrana, Wuppertal, NRW,
Germany), with a capillary length of 50 cm corresponding to an internal volume of about 30 µL (ca. 600 nL cm-1),
was mounted coaxially in a PTFE tube (I.D. = 5 mm). Two polyethylene T-connectors were firmly attached to the PTFE tube with help of pressure fitted silicone rubber pieces (5 mm I.D., 1cm long). The inlet and outlet ends of the porous capillary were connected to Tygon® microbore
tubing (4 cm, 0.4 mm I.D.) by using silicone tubing (0.8 mm I.D., 1 cm long) as hose. These Tygon® tubes
were sustained near the ends of the T-connectors by annular bushings made from pieces of silicone tubing.
During sampling, air was aspirated through the collector with an inexpensive aquarium membrane pump. The flow rate was adjusted with a pinch valve and read on a Cole-Palmer rotameter model N112-02 (Vernon Hills, IL, USA). The flow rate readings of the factory calibrated rotameter were checked against a digital flowmeter from Agilent model ADM2000 (Santa Clara, CA, USA).
CE-C4D equipment and description of the analysis method
The complete CE equipment interfaced to a microcomputer, including the C4D, was built in the
laboratory by do Lago and co-workers25,26 and consists of
two platinum electrodes connected to a high voltage source (AR-30, Bertan High Voltage Co., New York, USA) and immersed in reservoirs containing running buffer solution. The system was assembled inside an acrylic box with a fan, a heating element and temperature control circuit, which maintains the inside temperature between 28 and 30 °C. A power-off switch at the door of the box protects the operator from accidental exposure to high voltage. A microcomputer controls the equipment and the data acquisition from the C4D.
The C4D cell consists of two 2 mm wide ring electrodes,
1mm apart, and fitted around the capillary. One ring was connected to a Goldstar FG-2002 C Function Generator set to deliver a sine wave of 600 kHz with 2 Vpp of amplitude.
The other electrode was connected to an operational amplifier circuit comprising a current to voltage converter, a rectifier and an amplifier. An all-in-one version of the C4D was also utilized which presents as the main
signal, proportional to the conductivity of the solution inside the capillary, was fed to the analog to digital converter of a PCL711 card (Advantech Co., Taiwan), placed in a free slot of the PC. The control software was developed in the laboratory.
The fused-silica capillary (75 µm I.D., 0.375 mm O.D.), obtained from Agilent Technologies (São Paulo, SP, Brazil), was cut with a length of 65 cm, resulting in an effective path of 55 cm from the inlet to the twin ring-like electrodes of the C4D, operated at 600 KHz. Computer acquired
electropherograms were treated with the commercial program Origin® 8.0 Pro from Microcal (Northampton,
MA, USA) for peak area evaluation.
The capillary was conditioned by the following sequence of 20 min flushes of 0.1 mol L-1 NaOH, water and
running electrolyte. Before the first injection, high voltage (−25 kV) was applied for approximately 20 min. The capillary was flushed between runs with electrolyte solution for 2 min. The introduction of samples in the capillary was hydrodynamically performed by pressure reduction at the detector end of the silica capillary (9.8 mbar for 30 s) with a membrane pump, switched on and off by the computer.
All reagents used were of analytical grade. Acetic acid, formic acid, formaldehyde, N-cetyl-N,N,N-trimethylammonium bromide (CTAB) and 2-[N-morpholino]ethanesulfonic acid (MES) were from Merck (Darmstadt, HE, Germany). L-Histidine (His) was from Sigma Chemical Co. (St. Luis, MO, USA). Running buffers and standards were prepared on a daily basis from 0.1 mol L-1 stock solutions by dilution with deionized water
(18 MΩ cm-1; NANOpure UV, Barnstead/Thermolyne
Co., IA, USA). The optimized run buffer for the analysis, with pH 6.2, was 20 mmol L-1 MES, 20 mmol L-1
His and 0.2 mmol L-1 CTAB (for electroosmotic flow
inversion).22,23
CH3COOH standard gas generator
The efficiency of the sampling system was determined with the aid of a standard CH3COOH atmosphere generator
based on volatilization through a permeation device described in detail elsewhere.22 The flask containing
500 µL of glacial acetic acid was thermostated at 30 ºC in a water bath. Nitrogen was fed to the standard atmosphere generator at a flow rate of 350 mL min-1. The flask was
weighted every 24 h and the loss of mass, corresponding to the emission of acetic acid into the gas stream, was determined as 6.0 µg min-1. The diffusion collector with
the Oxyphan® capillary was connected to the output of the
generator, directly or after extra dilution with N2, controlled
with two needle valves and two flowmeters.
CMDS-CE-C4D online system
An improved version of the FA-CE interface described by Fang et al.28 was developed to couple the CMDS with
the CE-C4D. The liquid outlet from the CMDS was directly
connected to the narrow end of a disposable 100 µL pipette tip through a Tygon® microbore tubing (0.8 mm O.D.,
0.4 mm I.D., 2 cm long) and a short piece of silicone tube (0.8 mm I.D., 1 cm long) to minimize the dead volume (estimated in 10 µL). The wider end of a conically shaped tip was capped with a silicone septum, along which four narrow holes were made for the silica capillary of the CE equipment, the tubes for electrolyte inflow and for drain (Tygon®, 0.4 mm I.D. and 0.8 mm I.D., respectively) and
a vent (0.8 mm I.D.), as shown in detail in Figure 1b. The drain tube was used as a siphon and simultaneously as a salt bridge to a flask with a waste drain. The platinum electrode, connected to the grounded end of the high voltage supply, was immersed in this flask. A similar salt bridge was placed at the detector end of the capillary (Figure 1a), so that electrolysis products formed at the electrodes remained far from the capillary ends, thus greatly improving the repeatability of the electropherograms during long lasting operations, as previously demonstrated.29,30
A polyimide coated silica capillary, of the kind used in CE (50 µm I.D., 20 cm long), was connected in series with the supplying polyethylene tube as a hydrodynamic resistor to drastically restrain the flow rate. A needle valve was added for fine flow rate adjustment.
Two low-flow impellers made with borosilicate glass bottles, with 100 mL capacity, model 21806-245 (Schott Duran, Astonfields Industrial Estate, ST, UK) and an aquarium air pump (Betta, São Paulo, SP, Brazil) for pressurization were used for liquids propulsion.22 Flow
commutation was performed by two solenoid pinch valves built in the laboratory by downsizing a former design31 to fit
the 0.8 mm I.D. silicone tube in order to reduce the liquid pulsation on valve closure. Commercial pinch valves, like the Series 075P from Biochem Fluidics (Boonton, NJ, USA) or the VC8-P from Warner Instruments (Hamden, CT, USA) designed for 1/32 inch I.D. tubes, could be used instead by placing a shim under the capillary silicone tube. The circuits to switch the 12 V DC valve supplies and the 110 V AC supply of the aquarium pumps were connected to a PCL711 board (PC-Multilab Card from Advantech Co. Ltd, Milpitas, CA, USA) plugged into a microcomputer. Pump and valve timing, as well as application of high voltage to the CE, were freely adjusted by a software developed in Delphi 5.0, also responsible for data acquisition from the C4D.
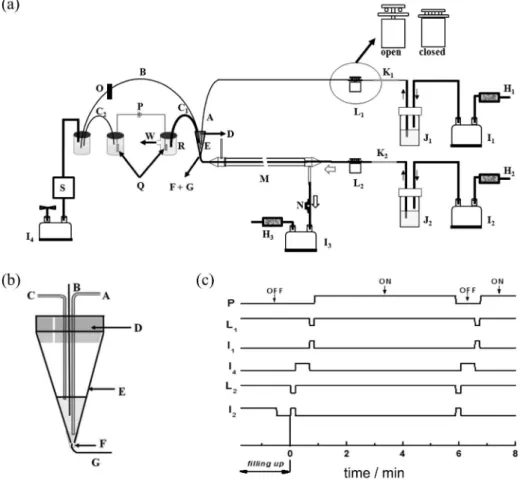
shown in Figure 1c. The volume of acceptor transferred from the CMDS to the interface (of the 30 µL available) was defined by the off-time of the pinch valve L2 (the flow of
sample air runs uninterruptedly). Hydrodynamic injection into the capillary was managed by activation of I4, causing
pressure reduction at the detector end. Before switching on the HV, the sample was washed out by opening L1
and fluxing the tip with 50 µL of electrolyte (10 s at 300 µL min-1). The excess of liquid was siphoned to the
anode semi-cell reservoir through the salt bridge C1. The
cycles of CMDS sampling and CE separation of the former sample were run concomitantly in order to share time.
Sampling site
The Cidade Universitaria site is located in the southwestern part of São Paulo (latitude = −23.564º;
longitude = −46.726º), deep inside the metropolitan area that comprises 6 million vehicles as main emitters. Primary and secondary sources are potentially present because the campus is a green area but there is a 14-lane major highway with heavy vehicle traffic fueled by gasohol, diesel and ethanol some 2 km away from the Chemistry Institute building, where samples were taken about 6 m above ground level.
Results and Discussion
Analysis of CH3COOH in the undiluted or diluted with
N2 output of the standard gas generator was performed to
evaluate the CMDS-CE-C4D system. By controlling the
timing of valve L2 of Figure 1a, the volume of sample
displaced from the microporous capillary (total internal volume of 30 µL) to the CMDS-CE interface was adjusted.
Figure 1. (a) System for CMDS-CE-C4D analysis of gaseous compounds: (A) electrolyte inlet at 300 µL min-1 flow rate; (B) silica capillary (75 µm I.D.,
65 cm long); (C1) and (C2) polypropylene tubing (0.8 mm I.D., 20 cm long) with CE-C4D electrolyte acting as a salt bridge; (D) silicone septum with a
vent (0.8 mm I.D.); (E) disposable 100 µL pipette tip; (F) silicone tube connector (0.8 mm I.D., 2 cm long); (G) Tygon® microbore tubing (0.79 mm O.D.,
0.4 mm I.D., 2 cm long) for sample inlet from the CMDS collector at 30 µL min-1; (H
1,H2 , H3) activated charcoal cartridges; (I1, I2) aquarium air pump for
liquid propulsion, (I3) aquarium air pump for air sampling or standard atmosphere gas aspiration and (I4) aquarium air pump for pressure reduction (vacuum)
at capillary end for hydrodynamic injection of the sample in the other reservoir or in the conical tip; (J1) bottle containing the CE-C4D electrolyte MES/His
20 mmol L-1 and CTAB 0.2 mmol L-1, (J
2) bottle containing the acceptor solution (deionized water or NaMES 2 mmol L-1); (K1) silica capillary covered by
polyimide (100 µm I.D., 5 cm long), (K2) silica capillary covered by polyimide (50 µm I.D., 20 cm long); (L1, L2) solenoid pinch valves acting on silicone tubes (0.8 mm I.D.), as shown in enlarged view; (M) CMDS; (N) air flow control pinch valve; (O) C4D detector; (P) high voltage supply; (Q) platinum
ground and high voltage electrodes; (R) modified vial for liquid drainage; (S) pressure regulator; (W) drainage waste. (b) Detail of the CMDS-CE-C4D
Regarding the limits of detection and quantitation of the analytical method for HCOOH and CH3COOH in the liquid
phase, the estimated LODs were 0.8 and 1.5 µmol L–1,
with a confidence level of 99%. These values correspond, respectively, to 1.2 and 3.0 µg m–3 of the species in air. The
limits of quantitation (LOQs) for HCOOH and CH3COOH
were calculated as 4.0 and 10.0, respectively (considering 10 times the standard deviation of the blank measurements). The concentrations of CH3COOH in the collected
samples were determined based on calibration curves for acetate ion covering the range from 3 to 30 µmol L-1. During
calibration, the CMDS was bypassed with 0.8 mm Tygon®
tubing and one standard acetate solution flask at a time replaced the acceptor flask J2 in Figure 1a. Furthermore,
at a fixed gas flow rate of 150 mL min–1, the effect of the
analyte concentration in the gas phase was evaluated and a linear relation with the CE-C4D peak area was observed
covering the range from 10 to 300 µg m-3, with nearly null
intercept.
For sample displacement from the interface into the silica capillary, hydrodynamic injection (HI) was preferred, although electrokinetic injection (EKI) in CE offers advantages such as instrumental simplicity and potentiality for pre-concentration by stacking during injection itself, with intensified admission of higher mobility ions (not always of advantage).32 However, for quantitative determinations, EKI
falls behind HI in terms of repeatability and reproducibility, being also vulnerable to sample matrix conductivity variations. Therefore, in order to ensure a better long-lasting reproducibility, automated HI of sample was implemented in the proposed system in combination with separated semi-cells for the electrodes, coupled through salt bridges, to avoid contamination of the capillary with electrolysis products.29,30 The CE-C4D equipment formerly devised and
built in the laboratory29 presented two operation modes for
HI: transient pressurization of the injection reservoir or reduction in reservoir pressure at the detection end of the capillary. The second mode was preferred here because it avoids complications due to interface pressurization. It was implemented with an aquarium air pump adjusted to reduce the pressure (9.8 mbar) and switched on by the computer for 30 s. Commercial CE equipment with HI by pressure reduction in the detection vial is thus compatible with the proposed CMDS-CE interface.
The repeatability of the CMDS-CE-C4D was evaluated
by automatic online injection of 50 samples collected from the CH3COOH generator plus 27 and another 12 on the
next two days, with an average recovery of 98% and an RSD of 3%, as can be seen in Figure 2a. This RSD was only 1% higher than that for acetate solutions directly injected into the CE-C4D equipment, demonstrating the
great effectiveness and repeatability of the collection device itself and of the entire system.
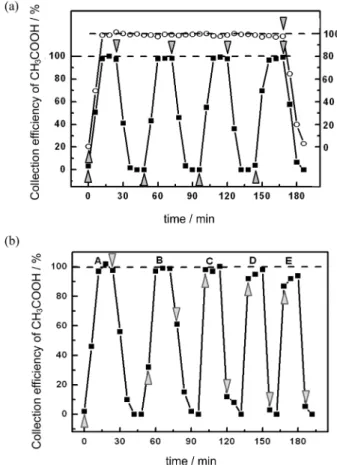
The transient response of the system to analyte pulses is displayed in Figure 2a. The sample gas was switched from nitrogen to standard CH3COOH and, after four cycles of
sample displacement to the interface (10 µL of acceptor solution) and HI injection, switched back to nitrogen and so forth. The results indicated that no acetic acid had reached the inlet of the capillary at the first injection, a mixture was injected after the second 10 µL sample-displacement cycle and a full signal was obtained at the third one and afterwards. This is compatible with the dead volume between the end of the active region of the sampler and the injection point into the silica capillary at the interface (approximately 2 cm of porous membrane not in contact with the gas flow, 2 cm Tygon® microbore tubing bridging
it to the interface and 0.5 cm from the conical pipette tip to the inlet of the silica capillary). The signal decay occurred in a similar way for the same reason, although slightly slower (2 to 7% residual acetic acid was not washed out from the pipette tip at the third injection).
In principle, the time lag could be reduced by increasing the volume of displaced sample per cycle up to the limit of 30 µL of acceptor phase exposed in the active region of the microporous capillary. The effect of the stepwise increase, displayed in Figure 2b, revealed that the best compromise was obtained by displacing 20 µL (sequence C, Figure 2b), where the first injection already gave the correct and updated result. By displacing 25 µL or more, low results were obtained (sequences D and E, Figure 2b), possibly due to partial depletion of the analyte from the gas phase in the downstream region of the counter current sampler.
Taking into account that for a 20 µL displacement, the acetate peak was detected about 3 min after each sampling cycle (and the formate peak was detected even earlier), the adoption of this parameter resulted in a very near-real-time measurement of these acidic species in air by the automated system. The microliter volume is still oversized for CE analysis once ca. 10 nL are effectively injected in the silica capillary. However, the use of 20 µL of acceptor solution assures the complete cleaning and conditioning of the connection tubes and the FA-CE interface before hydrodynamic injection.
In a sampling cycle performed on May 20th 2009,
from 10:00 to 22:00 h, the CMDS-CE-C4D system was
used for simultaneous analysis of gaseous HCOOH and CH3COOH. The current design of the online system
did not allow the concomitant quantification of CH2O,
e.g. once the required derivatization step with bisulfite for the formation of the charged specie HMS− was not
bisulfite in excess as an acceptor phase is inappropriate due to oxidation to sulfate during the sampling period. Online derivatization by addition of a confluence between the CMDS and the interface for introduction of the bisulfite solution would be an alternative. Such arrangement, to be evaluated in the future, will obviously delay the response by increasing the dead volume. Figure 3a illustrates the variation in the concentration of formate and acetate along the 10 h sampling period with measurement periods of 6 min and Figure 3b shows an electropherogram for the sample collected at 16:30 h. Variations in HCOOH and CH3COOH concentrations covered the ranges from 4.9 to
25.1 µg m-3 and 13.7 to 16.7 µg m-3, respectively. For this
sampling period, on a hazy autumn day in the southern
hemisphere, formic acid peaked shortly after noon. For acetic acid, a lower and steadier profile was observed but an increase was also evident at noon. This is the first set of time-resolved measurements of gaseous acetic and formic acid in São Paulo, since integrated measurements for morning (8:00-10:00 h), midday (12:00-14:00 h) and evening periods (16:00-18:00 h) were made in a former study.33 The
referred study showed similar concentrations for the acids in the gas phase, also two to three times higher for formic acid on average, while the concentrations of acetaldehyde and formaldehyde were quite similar and attributed, mainly, to direct emissions caused by the extensive use of alcohol and gasohol as fuel in São Paulo.33 Since the direct emissions of
carboxylic acids are low and aldehyde emissions by the car fleet are higher from 7:00 to 10:00 h and 17:00 to 20:00 h, the peaks for the acids at noon seem to correlate with the greater availability of UV radiation, promoting the photochemical oxidation of the aldehydes, especially formaldehyde. These
Figure 2. (a) Evaluation of the collection efficiency and response time of the CMDS-CE-C4D with 40 µg m-3 CH
3COOH gas standard based on
the peak area of the electropherograms compared with standard solutions of CH3COOH. Full squares: cycles of four consecutive analyses with exposure to gaseous acetic acid (with the beginning represented by the triangle) and four analyses under nitrogen flow (represented by the upside down triangle) at 150 mL min-1 flow rate and 10 µL sample displacement
from the CMDS to the CE interface before injection. Hollow circles: repeatability of 32 consecutive injections of CH3COOH gas standard. (b) Displacement of increased volumes of acceptor solution and relation with the collection efficiency and the time elapsed for nearest real-time measurements of CH3COOH concentration: (A) 10 µL; (B) 15 µL;
(C) 20 µL; (D) 25 µL; (E) 30 µL. Consecutive analyses with exposure to gaseous acetic acid (triangle) and under purge with nitrogen flow (upside down triangle).
Figure 3. (a) Concentrations of target compounds in the gaseous phase of the atmosphere during a 10-hour sampling period on May 20th
,2009
using the CMDS-CE-C4D method. Full squares: HCOOH; open circles:
CH3COOH. (b) Electropherogram of the sample collected at 16:30 h. Peaks: (1) Cl−, (2) HCOO−, (3) CH
3COO−. Concentrations in the gas
phase derived from the electropherogram: HCOOH = 7.0 µg m-3 and
exploratory results indicate that the proposed TAS makes way for more detailed atmospheric research of these low molecular carboxylic acids.
It may be argued that during the collection of acidic analytes at high concentrations, the decrease in the pH of water used as acceptor can shift the equilibrium from the anionic conjugate bases to the protonated forms - the hydrated acids - still under liquid phase on ground with a favorable Henry’s constant (at least for the low chain carboxylic acids). Therefore, when high amounts of acids are expected, instead of reducing the flow rate of the gas to be sampled, a buffered acceptor phase could be chosen, sufficiently diluted to be compatible with CE. For example, a 2 mmol L-1 solution of NaMES with a pH 7.1 was
sufficient to restrain the pH fall to 6.1 for the absorption of formic acid up to a concentration of 200 µmol L-1 of formate
in solution, an extreme condition that is not expected even in highly polluted areas. The use of concentrated acceptor phases is unadvisable not only for CE-C4D but
for the CMDS as well because water evaporation in the membrane pores may cause deposition, thus gradually impairing the efficiency of analytes’ extraction from the gas phase. A virtual impactor (less interfering than a filter) preceding the air inlet of the CMDS reduces the entrance of particulate matter, but not of nanoparticles and, despite tangential gas flow on the porous membrane, some deposition is unavoidable. Furthermore, the microporous membrane may lose mechanical strength as a result of the attack by ozone (average concentration of O3 in São Paulo
metropolis is about 0.1 µg m-3). For long term monitoring
it is, thus, recommended to check the efficiency and/or replace the porous polypropylene membrane of the CMDS on a monthly basis or so, depending on local conditions.
During the evaluation period of the CMDS-CE-C4D
system, the temperature in the laboratory was maintained in the 20-25 ºC range and the relative humidity of the sampled outdoor air remained above 40%. Under dryer conditions (less than 20% of relative humidity of air), evaporation of the solvent in the microporous capillary becomes more significant, causing an overestimation of analyte concentration. The temperature dependence of the pressure-feed acceptor flow rate (water viscosity changes
ca. 2% per ºC) has no significant effect on the results, since sampling is carried out under stopped flow and changes in the volume transferred to the FA-CE interface have little effect, as shown in Figure 2.
When the CMDS was used offline, weighting of the vials before and after collection and comparison with the mass collected in a similar way but with the air aspirating pump switched off, was found appropriate to correct the results for evaporation effects in dry environments.12 For
the automated system, the proposed solution was to add sodium lactate to the acceptor phase (e.g., of 30 µmol L-1)
as an internal standard to correct the results for evaporation effects. This helps also to compensate the long-term changes in the injection and electrophoretic separation conditions and would warn about improper operation of the system (acceptor run-out, valves or air pumps malfunctioning).
Comparison of the system performance for the analysis of CH3COOH in standard atmosphere gas with and without
lactate as an internal standard in the NaMES acceptor solution revealed and improved the RSD of triplicate results for the quantification based on the acetate/lactate peak area (or height) ratio against the non-ratiometric ones from 3.2% to 2.3% for peak area and 3.9% to 3.1% for peak heights. There are, thus, compelling advantages in adding lactate as an internal standard to obtain corrected results during long-term routine monitoring. The calibration procedure with standards of the analytes in liquid phase can be postponed as long as a reproducible lactate peak is observed, with constant area (or height) for the sample gas flow switched off. Alternatively or complementarily, a three-way solenoid valve could be added to the inlet of the sampler to switch from ambient air to the CH3COOH standard atmosphere,
for example, every 6 h or so.
The overall consumption of acceptor solution and running electrolyte by the system was very low, amounting to 0.2 and 0.5 mL per hour, respectively. Except for some 5 mL of electrolyte for the electrode semi-cells and the salt bridges, renewed on a daily basis, no other chemicals or solvents were consumed nor were toxic wastes generated.
Conclusions
The designed automated analysis system CMDS-CE-C4D
presented many advantages including simplicity, versatility and rapidity - a new sample was collected while the electropherogram of the former one was acquired in 6 min duty cycles. Operational and maintenance costs were low compared to HPLC or IC once there is no need for high pressure pumps, expensive separation columns and huge volumes of solvents or buffers, and only a minimum amount of nontoxic liquid effluent was generated. The proposed automatic system has potential for development of near-real-time analysis methods of other gaseous species relevant for indoor, outdoor or even in-process applications, in consonance with the 11th principle of green
chemistry. Additional steps of in-line clean up, separation or pre-concentration can be integrated into the TAS30 while
evolution in microchip CE-C4D development34,35 can lead
Acknowledgments
The authors would like to thank FAPESP, the State of São Paulo Research Foundation and CNPq, the National Council for Scientific and Technological Development, for financial support and fellowships.
References
1. Baker, R. W.; Ind. Eng. Chem. Res.2002, 41, 1393. 2. Hoffmann, T.; Huang, R. J.; Anal. Chem.2011, 83, 4649. 3. Hirata, S.; Amma, B. V.; Karthikeyan, S.; Toda, K.; Anal. Sci.
2003, 19, 1687.
4. Potzsch, S.; Bachmann, K.; Environ. Sci. Pollut. Res.2002, 4, 55.
5. Campos, T. L.; Kok, G. L.; Atmos. Environ. 1996, 30, 2575. 6. Staffelbach, T.; Neftel, A.; Dasgupta, P. K.; Geophys. Res. Lett.
1995, 22, 2605.
7. Dasgupta, P. K.; McDowell, W. L.; Rhee, J. S.; Analyst1986,
111, 87.
8. Kleindienst, T. E.; Shepson, P. B.; Hodges, D. N.; Nero, C. M.; Arnts, R. R.; Dasgupta, P. K.; Hwang, H.; Kok, G. L.; Lind, J. A.; Lazrus, A. L.; Mackay, G. I.; Mayne, L. K.; Schiff, H. I.;
Environ. Sci. Technol. 1988, 22, 53.
9. Li, J. Z.; Dasgupta, P. K.; Genfa, Z.; Hutterli, M. A.; Field Anal. Chem. Technol. 2001, 5, 2.
10. Komazaki, Y.; Hashimoto, S.; Inoue, T.; Tanaka, S.; Atmos. Environ. 2002, 36, 1241.
11. Lindgren, P. F.; Dasgupta, P. K.; Anal. Chem.1989, 61, 19. 12. Rocha, F. R.; Coelho, L. H. G.; Lopes, M. L. A.; Carvalho, L.
R. F.; da Silva, J. A. F.; do Lago, C. L.; Gutz, I. G. R.; Talanta 2008, 76, 271.
13. Kuban, P.; Engstrom, A.; Olsson, J. C.; Thorsen, G.; Tryzell, R.; Karlberg, B.; Anal. Chim. Acta1997, 337, 117.
14. Kuban, P.; Karlberg, B.; Anal. Chim. Acta2009, 648, 129. 15. Chen, Y. L.; Lu, W. J.; Chen, X. G.; Hu, Z. D.; Electrophoresis
2007, 28, 33.
16. Chen, X. G.; Fan, L. Y.; Hu, Z.; Electrophoresis2004, 25, 3962. 17. Miranda, C. E. S.; Carrilho, E.; Gervasio, A. P.; Gine, M. F.;
Quim. Nova2002, 25, 412.
18. Bao, L. Y.; Dasgupta, P. K.; Anal. Chem.1992, 64, 991. 19. Palgrossi, F. S.; MSc Dissertation, University of São Paulo, Brazil,
2002; http://www.teses.usp.br/teses/disponiveis/46/46133/ tde-15072003-141427 accessed in March 2011.
20. Lopes, F. S.; Coelho, L. H. G.; Gutz, I. G. R.; Electrophoresis 2011, 32, 939.
21. Lopes, F. S.; Antunes, O.; Gutz, I. G. R.; Electrochem. Commun.
2010, 12, 1387.
22. Coelho, L. H. G.; Melchert, W. R.; Rocha, F. R.; Rocha, F. R. P.; Gutz, I. G. R.; Talanta2010, 83, 84.
23. Fornaro, A.; Gutz, I. G. R.; Atmos. Environ.2003, 37, 117. 24. Rocha, F. R.; da Silva, J. A. F.; Lago, C. L.; Fornaro, A.; Gutz,
I. G. R.; Atmos. Environ. 2003, 37, 105.
25. da Silva, J. A. F.; do Lago, C. L.; Anal. Chem.1998, 70, 4339. 26. Brito-Neto, J. G. A.; da Silva, J. A. F.; Blanes, L.; do Lago, C. L.;
Electroanalysis2005, 17, 1198.
27. Francisco, K. J. M.; do Lago, C. L.; Electrophoresis2009, 30, 3458.
28. Fang, Z. L.; Liu, Z. S.; Shen, Q.; Anal. Chim. Acta1997, 346, 319.
29. de Jesus, D. P.; Brito-Neto, J. G. A.; Richter, E. M.; Angnes, L.; Gutz, I. G. R.; do Lago, C. L.; Anal. Chem.2005, 77, 607. 30. Saito, R. M.; Brito-Neto, J. G. A.; Lopes, F. S.; Blanes, L.; da
Costa, E. T.; Rajh, V. D. T.; Hotta, G. M.; do Lago, C. L.; Anal. Methods2010, 2, 164.
31. Palgrossi, F. S.; Pedrotti, J. J.; Gutz, I. G. R.; Quim. Nova2001,
24, 689.
32. Chen, H. W.; Fang, Z. L.; Anal. Chim. Acta1997, 355, 135. 33. Montero, L.; Vasconcellos, P. C.; Souza, S. R.; Pires, M. A. F.;
Sanchez-Ccoyllo, O. R.; Andrade, M. F.; Carvalho, L. R. F.;
Environ. Sci. Technol.2001, 35, 3071.
34. Li, H. F.; Lin, J. M.; Anal. Bioanal. Chem.2009, 393, 555. 35. Liu, Y.; MacDonald, D. A.; Yu, X. Y.; Hering, S. V.; Collett, J. L.;
Henry, C. S.; Analyst2006, 131, 1226.
Submitted: April 12, 2011
Published online: September 23, 2011