Article
Printed in Brazil - ©2017 Sociedade Brasileira de Química0103 - 5053 $6.00+0.00*e-mail: [email protected]
A Straightforward Method for Determination of Al and Na in Aluminosilicates
Using ICP OES
Francisca S. O. Ramos,a Ramon K. S. Almeida,a Cícero A. Lopes Júnior,b,c
Marco Aurélio Z. Arrudab and Heloise O. Pastore*,a
aGrupo de Peneiras Moleculares Micro e Mesoporosas and bGrupo de Espectometria, Preparo de
Amostras e Mecanização, Instituto de Química, Universidade Estadual de Campinas, CP 6154, 13083-970 Campinas-SP, Brazil
cDepartamento de Química, Universidade Federal do Piauí, 64049-550 Teresina-PI, Brazil
The improvements on aluminosilicates dissolution through microwave-assisted acid decomposition procedures for Na and Al quantification by inductively coupled plasma optical emission spectrometry (ICP OES) are reported here. Complete dissolution of the samples is achieved employing 4 mL of HNO3 and 3-4 mL of HF thus reducing the total amount of these reactants in comparison with procedures found in the literature. Additionally, the type of crucibles used in the calcination for sample preparation step is also evaluated. Na and Al concentrations are in agreement with the expected values on the samples. Estimated silicon amount is achieved by difference of sodium and aluminum, and then Si/Al molar ratios were calculated for samples calcined in both porcelain (Si/Al is in the range 22-42) and platinum (Si/Al is in the range 27-40) crucibles, showing no difference between these procedures.
Keywords: sample preparation, ICP OES, microwave digestion, acid dissolution
Introduction
Inductively coupled plasma optical emission spectrometry (ICP OES) is a powerful multi-elemental technique applied to chemical analysis1 which requires a
sample preparation step involving only a simple dilution or total dissolution if the sample is a solid.1,2 Concerning
solid samples, methodologies involving suspensions prepared from finely powdered samples (slurries) have become acceptable1,3,4 as well as the application of
extraction methods5 depending the nature of sample. ICP
OES presents some advantages such as low degree of matrix-interference, high analytical frequency, linearity of calibration curves over several orders of magnitude and excellent reproducibility.1 Additionally, detection
and quantification limits allow the determination of a diversity of metals and nonmetals in a myriad of sample types such as cements, ceramics, silicates, geological materials, metallosilicates, refractory compounds, aluminophosphates, silicoaluminophosphates, clays, phyllosilicates, and coals.4,6-14
The chemical analysis of the inorganic solids mentioned above by ICP OES using conventional acid dissolution methods, in open flasks on hot plate,15 usually involves
costly and time-consuming procedures for sample preparation,3 requiring a long analysis time and large
amounts of reagents. Additionally, such conventional procedures do not assure complete dissolution of some solid inorganic samples, especially geological samples15,16
(including silicates8,13,17 and aluminosilicates)14,16 even when
a large amount of concentrated acids is used.3,8 Moreover,
these procedures allow analytes loses and samples contamination,4 with the accuracy, reproducibility, and
precision being affected.8 Another negative point of using a
large amount of acid mixture in open systems is a potential source of systematic error because of the use of ultra-pure reagents. HNO3 presents 1 and 0.01 ug L-1 of Al and Na,
respectively, while these values are 0.5 and 0.6 ug L-1 of Al
and Na, respectively, for HF.18 These impurities affect the
detectability method, making it impossible to determine elements in low concentrations.
materials,21-23 as carbon nanotubes24 and organo-functionalized
magnesium phyllosilicate.25 It is also widely and successfully
applied to sample decomposition, when combined with the use of sealed-vessels15,16,26 and concentrated, strong,
oxidizing and/or non-oxidizing acids (e.g., HNO3, HCl,
HF, H2SO4, HClO4, etc.).14,16,27-30 Microwave-assisted
digestion is a promising method to achieve this critical step of solids analysis10,31 because it attains fast dissolution
rate while avoiding analyte losses (mainly the volatile analytes),32 minimizes possible contamination of the digest,29
increases reproducibility32 and assures safety procedure.
Closed systems for sample decomposition require a lower acid volume, increases the reliability of the method, and, consequently, the figures of merit (accuracy, precision, sensitivity). Furthermore, digestion procedures performed in closed vessels are efficient because such systems can reach higher temperatures since the boiling points of the acids are raised by the pressure generated within the vessel.33
Both, increased temperature and pressure, lead to a higher reactivity of the reactants30,33 and a significantly decreased
time of analysis.33
Different inorganic solids can require different acid mixtures;30 both silicate and aluminosilicate matrixes
are dissolved only in the presence of HF.15,30 The strong
Si–O bonds are broken by complexing F− ions, forming SiF4 which volatilizes upon heating.30 Although HF has
been effective by itself, its combination with other strong mineral acids (HClO4, HNO3, HCl, aqua regia or H2SO4)
increases the capability of this non-oxidizing acid in sample decomposition.30
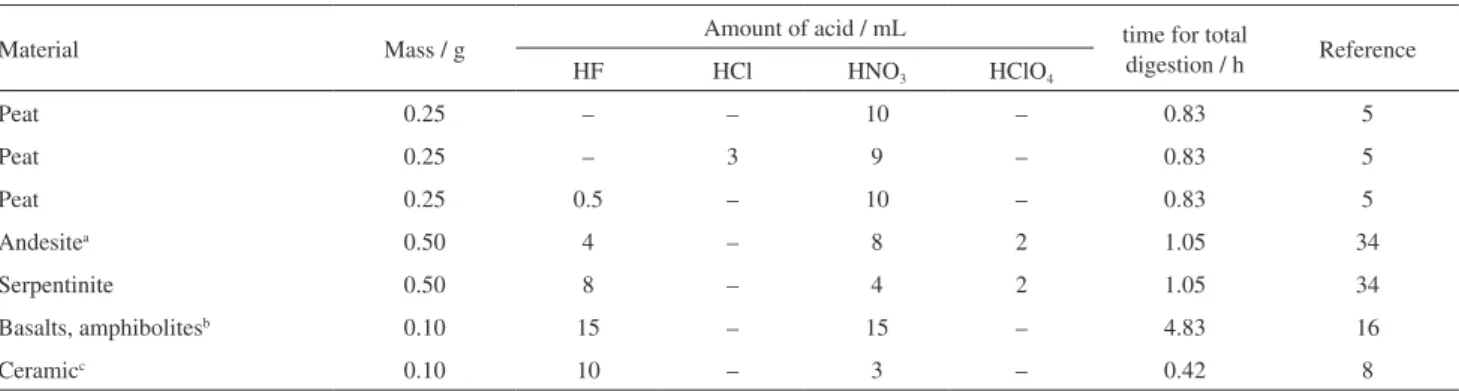
Yafa and Farmer5 performed microwave-assisted
dissolution of peat samples using acid mixtures of a range of compositions depending on the composition of the analyzed solids (Table 1). The peat sample with aluminosilicates in its composition required concentrated HNO3 (9 mL) and
concentrated HF (0.5 mL). Totland et al.34 reported that a
combination of 29, 16 and 12 mol L-1 of HF, HNO 3 and
HClO4, respectively, and three microwave digestion runs
was sufficient to obtain total dissolution of geological samples (Table 1). On the other hand, Navarro et al.16 used
a combination of 15, 15 and 15 mL of HF, HNO3 and water
to assure total dissolution of geological samples, following a decomposition procedure, which involved at least four microwave run steps, which took almost 5 h (Table 1).
Digestion of ceramic samples in open vessels took 7.5, 7.5, 7 and 10 mL of H2O, HNO3 (65%), HClO4 and
HF (48%), respectively.8 When the same samples were
submitted to microwave digestion (Table 1) the effective acidic mixture was: 3 mL of HNO3 (65%) and 10 mL of
HF (48%).8
Despite numerous reports concerning solid sample decomposition, an intensive development, dissemination of information besides improvements of methods is still very much necessary. In this way, the present study aims to develop/optimize the amount and relative acid composition (HNO3 + HF) in the mixture applied for dissolution of
aluminosilicate samples of Na-RUB-18 structure (also known as octosilicate) and quantify aluminum and sodium via ICP OES.
For these determinations, a microwave-assisted decomposition method was applied as an alternative to the traditional sample preparation procedures, which comprise dissolution steps in open flasks using hot plates. The limitations observed in these procedures, such as the incomplete sample decomposition, high probability of contamination, among others prompted the present study. The estimation of silicon concentration was made by taking into account aluminum and sodium concentration in calcined samples, and then, Si/Al molar ratios were calculated. Si/AlICP of these zeolitic materials is an
important property related to the acidity of these solids. Additionally, the calcination pre-treatment was performed
Table 1. Microwave decomposition to geological samples
Material Mass / g Amount of acid / mL time for total
digestion / h Reference
HF HCl HNO3 HClO4
Peat 0.25 – – 10 – 0.83 5
Peat 0.25 – 3 9 – 0.83 5
Peat 0.25 0.5 – 10 – 0.83 5
Andesitea 0.50 4 – 8 2 1.05 34
Serpentinite 0.50 8 – 4 2 1.05 34
Basalts, amphibolitesb 0.10 15 – 15 – 4.83 16
Ceramicc 0.10 10 – 3 – 0.42 8
in both porcelain and platinum crucibles in order to evaluate the influence of the crucible material in the obtained results. The hypothesis was that porcelain could decompose in the calcination temperature. This effect was proven absent and it was advantageous because platinum is quite expensive when compared to porcelain, using the last for the calcination in the sample preparation step allowed the simultaneous examination of repetition experiments.
Experimental
Reagents, materials and solutions
All reagents were of analytical grade, including HNO3 (65%, Sigma-Aldrich), HF (40%, Sigma-Aldrich),
NaCl (> 99%, Sigma-Aldrich), and H3BO3 (Vetec). Deionized
water (18.2 MΩ cm), obtained in a Milli-Q Millipore system was used to prepare all solutions. An aluminum standard solution of 1000 mg L-1 (Fluka Sigma-Aldrich) was used to
prepare a series of calibration standard solutions. A standard solution of 2000 mg L-1 Na was prepared, using dry NaCl
(Sigma-Aldrich). Then, 100 mg L-1 stock solutions of Al and
Na were prepared by diluting the above standard solutions. The six standard solutions of the analytical curves with concentrations ranging between 0.5 and 10 mg L-1 were
obtained through dilution of 100 mg L-1 stock solutions of Al
and Na. The volumes of all solutions were completed with 1% (v/v) HNO3 aqueous solution, which was used as a blank.
Aluminosilicates with the RUB-18 crystalline structure were previously synthesized with nominal Si/Al molar ratios of 15, 30 and 60 and named as [15Al]-RUB, [30Al]-RUB, and [60Al]-RUB, respectively.
Instrumentation
The pre-treatment step of the samples described below (Sample preparation sub-section) was performed in a muffle furnace model EDGCON 5P. The solid decomposition was performed using a Provecto Analítica DGT 100 Plus oven equipped with a twelve-positions tray for Teflon® PTFE
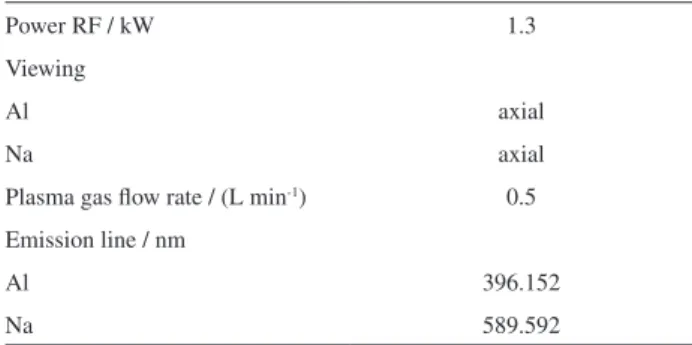
digestion vessels and a magnetron of 2450 ± 13 MHz with a nominal power of 1200 W. Measurements were performed in a Thermo Scientific iCAP 6000 ICP OES. The instrumental conditions used for quantitative determination of the elements are given in Table 2.
Sample preparation
The preparation of samples for the ICP OES analysis comprised a pre-treatment step and microwave digestion part described below.
Pre-treatment
First, each previously synthesized sample was distributed in both platinum and porcelain crucibles and heated from room temperature to 900 °C in a muffle furnace model EDGCON 5P, under argon atmosphere, at 2 °C min-1 heating rate. Then, the samples were maintained
at this temperature for 10 h under oxygen atmosphere and cooled down to room temperature. The oxygen was used in order to burn out any organic material present in the samples before the digestion step. After that, the samples were ground using an agate mortar and pestle to obtain fine powders (less than 500 µm), increasing the contact
area of the samples with the solvents to guarantee complete dissolution in the digestion step.
The calcination procedure was performed in order to destroy the crystalline structure of the solids and to obtain the oxides (Na2O, SiO2 and Al2O3). In the next
step, the samples were submitted to acidic decomposition (a mixture of 65% (v/v) HNO3 and 40% (v/v) HF) assisted
by microwave radiation as described below.
Optimization of the acid decomposition method assisted by microwave radiation of synthesized aluminosilicates
RUB-18 aluminosilicate samples, previously calcined in both platinum and porcelain capsules as described above, were submitted to the same acidic microwave decomposition program shown in Table 3.
The amount of each calcined sample used in the procedures was calculated to afford solutions with Table 2. Operating conditions of the ICP OES for quantitative Al and Na determinations
Power RF / kW 1.3
Viewing
Al axial
Na axial
Plasma gas flow rate / (L min-1) 0.5
Emission line / nm
Al 396.152
Na 589.592
Table 3. Microwave program for aluminosilicates decomposition
Step Power / W Plateau time / min
1 400 5
2 790 8
3 320 4
concentrations of 20-50 mg L-1 of Al3+, as shown in
Table 4. Then, diluted solutions of the totally dissolved samples were analyzed by ICP OES. The concentrations of both aluminum and sodium were calculated taking into account the amount of sample shown in Table 4 and two considerations: that the unit cell composition was Na8[SiyAlx(OH)8]·32H2O, y = 30 – 31.5; x = 0.5 – 2.0
and that all the aluminum added to the synthesis of the Na-RUB-18 was incorporated into the framework; the concentration of sodium was maintained as shown in the unit cell composition. After ICP OES analysis, the real concentrations of the both aluminum and sodium were compared with the expected values, to indicate the success of the synthesis procedure.
The nomenclature of the samples [15Al]-RUB, [30Al]-RUB and [60Al]-RUB was increased by “pt” and “por”, respectively, for better identification of each type of crucible, platinum or porcelain, used (Table 4).
Procedure 1
Optimization 1: interaction of microwave energy and acid volume
This optimization step involved the interaction of microwave energy and acid volume being applied to the samples [30Al]-RUB/por and [30Al]-RUB/pt.
A desired mass (Table 4) of the calcined sample [30Al]-RUB/por for obtaining 50 mL of a solution with ca. 50 mg L-1 of Al3+, was weighed into Teflon® PTFE
digestion vessels. Then 2 mL of 65% (v/v) HNO3 and
1 mL of 40% (v/v) HF were added initially to the vessels, which corresponds to triplicate analyses of the sample [30Al]-RUB/por, and the PTFE bombs were tightly sealed (Table 5). The vessels corresponding to triplicate analyses
of [30Al]-RUB/por and nine Teflon® PTFE digestion
vessels with only the same amount of acid mixture (2 mL
of 65% (v/v) HNO3 and 1 mL of 40% (v/v) HF) were
transferred to the microwave system, amounting to twelve bombs (Table 5, line 1), filling the whole microwave tray. The nine vessels containing only the acid mixture were
needed to ensure the same interaction of the microwave energy with all of them, as well as to dilute its intensity reducing the exposure time.
Then, the system was submitted to the first digestion run following the microwave program described in Table 3 using the masses shown in Table 4. Then the system was cooled down; visual inspection indicated that undissolved sample was still present in the flasks. Thus, a second run was performed, without any further addition of acids, to try to promote the total dissolution of samples. The procedure was not successful, undissolved solid was still found at the vessel (Table 5, run II).
In order to increase the exposure time of each vessel to the microwave radiation, from the third run onwards, only six Teflon® PTFE vessels were maintained in the oven,
alternating voids and vessels in the tray, thereby increasing the amount of microwave energy received by each one of them and, consequently, reducing the consumption of sample and reagents. Then 1 mL of 40% (v/v) HF + 2 mL 65% (v/v) of HNO3 were added to each vessel initially
submitted to a run equal to the first run program: three vessels corresponding to the triplicate of the sample and three other with only the acid mixture (Table 5, run III). Again, undissolved solid was observed in the bombs. The fourth run was the same as run II with six Teflon® PTFE
vessels in the tray (Table 5, run IV) to attempt complete dissolution of the sample. No success in the run IV since visual inspection showed undissolved sample.
After these failed runs, 1 mL of 40% (v/v) HF was added to each vessel and the system was submitted to the run V, Table 5. Finally, total dissolution of the sample was observed.
After total acid decomposition of the samples [30Al]-RUB/por and [30Al]-RUB/pt (Table 5, run V) and slight cooling, 900 mg of H3BO3 were added to each
Teflon® PTFE vessels, including the blank. A period of
Table 4. Sample massa in each procedure
Sample Mass / g
[15Al]-RUB/por 0.1001 ± 0.0001
[15Al]-RUB/pt 0.1004 ± 0.0025
[30Al]-RUB/por 0.1693 ± 0.0120
[30Al]-RUB/pt 0.1738 ± 0.0014
[60Al]-RUB/por 0.1384 ± 0.0005
[60Al]-RUB/pt 0.1382 ± 0.0002
aCalcined material; pt: platinum; por: porcelain.
Table 5. Digestion procedure for [30]-RUB-18/pt and [30]-RUB-18/por samples
Run
Amount of acid / mL
Teflon® PTFE / unit
Aspect of the digested 40% (v/v)
HF
65% (v/v) HNO3
I 1 2 12 undissolved sample
II 0 0 12 undissolved sample
III 1 2 6 undissolved sample
IV 0 0 6 undissolved sample
V 1 0 6 transparent/total
dissolution
ca. 40 min elapsed and the contents (including the blank) were transferred to volumetric flasks using filter paper, and the volume was completed to 50 mL with 1% (v/v) HNO3. Each solution was diluted to prepare a new one with
ca. 5 mg L-1 of Na+. This procedure was carried out to allow
for the measurement of the analyte within the linear range (1-10 mg L-1)in the ICP OESequipment.
Teflon® PTFE digestion vessels were placed in the
microwave system in alternate positions in the tray in all runs performed by this procedure.
All the steps described in such procedure above were also performed with the sample [30Al]-RUB/pt.
Procedure 2
Optimization 2: acid volume
This procedure was performed with the sample with Si/Alnominal molar nominal ratio of 60. Approximately
140 mg (Table 4) of sample were weighted into Teflon®
PTFE vessels and 4 mL 65% (v/v) HNO3 + 3 mL of
40% (v/v) HF were added. The vessels were sealed tightly and submitted to microwave decomposition according to the program described in Table 3. In order to promote total sample dissolution, 1 mL of 40% (v/v) HF was added, and the system submitted to a second run at the same conditions as above. At the end of the run, a solution was obtained. [15Al]-RUB samples were prepared with 4 mL 65% (v/v) HNO3 + 4 mL of 40% (v/v) HF in a single
microwave-assisted decomposition step.
Results and Discussion
The decomposition procedures performed in this study aimed to reduce the acid amount involved in the dissolution of these samples, to diminish volatilization and/or precipitation of analytes, to avoid both a long time of analysis3,29 and the damage of the vessels. All these efforts
were made by focusing on an efficient decomposition, leading to good recoveries29 of the analytes.
H3BO3 was added after total dissolution of the solids
to form a fluoride complex in the medium, resulting in the volatile BF3, avoiding the formation of precipitates. This
step also avoids the damage of the quartz torch by fluoride compounds as well as any other component of the ICP OES when the sample solution is introduced into the system and pre-optic interface. Additionally, the measurement using diluted samples is preferable for three reasons: (i) to make sure that the equipment detector will not be saturated; (ii) to avoid damages to the ICP OES apparatus due to concentrated acidic mixture; (iii) to make sure that the elements will be determined within the linear range of the analytical curve.
Progressive microwave-assisted acid decomposition steps were performed in the Procedure 1 until total dissolution of the samples was achieved (Table 5). In this way, five runs were performed with the initial amount of solid, adding acid, as shown in Table 5. The total digestion of the samples [30Al]-RUB/por and [30Al]-RUB/pt required 4 mL of 40% (v/v) HF and 3 mL of 65% (v/v) HNO3.Once aluminosilicates dissolution of the type
[30]-RUB was optimized, the digestion of [15Al]-RUB/por and [15Al]-RUB/pt was performed in a single microwave-assisted run with 4 mL of 40% (v/v) HF and 4 mL of 65% (v/v) HNO3.
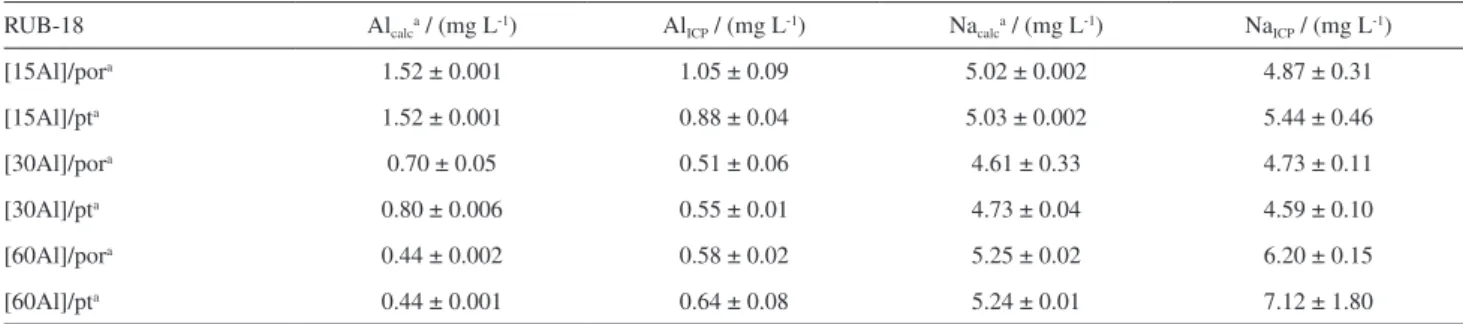
The aluminum and sodium calibration curves presented linear correlation coefficient of 0.9999 and 0.9998, respectively (Figures S1 and S2, Supplementary Information section). The results obtained for the samples are shown in Table 6 and good agreement was attained with expected concentrations when the samples were treated in both, platinum and porcelain crucibles, showing good recovery degrees of the elements examined after dissolution procedures.
The higher SiO2 concentration in [60Al]-RUB required
a larger amount of HF for its total dissolution. Even in that case, the amount of the acidic mixture and time are smaller than the ones used in procedures reported for similar materials.8,29
Table 6. Concentrations of Al and Na in the calcined samples submitted to microwave-assisted digestion and determined using ICP OES
RUB-18 Alcalca / (mg L-1) AlICP / (mg L-1) Nacalca / (mg L-1) NaICP / (mg L-1)
[15Al]/pora 1.52 ± 0.001 1.05 ± 0.09 5.02 ± 0.002 4.87 ± 0.31
[15Al]/pta 1.52 ± 0.001 0.88 ± 0.04 5.03 ± 0.002 5.44 ± 0.46
[30Al]/pora 0.70 ± 0.05 0.51 ± 0.06 4.61 ± 0.33 4.73 ± 0.11
[30Al]/pta 0.80 ± 0.006 0.55 ± 0.01 4.73 ± 0.04 4.59 ± 0.10
[60Al]/pora 0.44 ± 0.002 0.58 ± 0.02 5.25 ± 0.02 6.20 ± 0.15
[60Al]/pta 0.44 ± 0.001 0.64 ± 0.08 5.24 ± 0.01 7.12 ± 1.80
The present study showed an improvement on aluminosilicates dissolution, as well as considerable reduction on total analyses time, which is a limiting step for sample preparation focusing on ICP OES analysis. In contrast, when using conventional decomposition method in open flasks over hot plate, long times are currently devoted for sample dissolution. Ceramics, soil, silicates, and aluminosilicates demand large amounts of acids and lengthy heat treatments in comparison to the method described here sometimes without success.
The acid dissolution of aluminosilicates [Al]-RUB-18 was performed in our laboratory in open flasks using hot plate as heating source. Generally, after adding a large amount of a mixture of concentrated HClO4, HNO3 and
HF, at least three times more acid than what was described here, during several days, undissolved sample was still observed in the flasks.
Tsolakidou et al.8 also have spent a large amount
of acid in dissolving ceramics (0.15 g) in open vessels: 5, 5, 10 and 2 mL of HNO3 65%, H2O, HF and HClO4,
respectively, in a first digestion step. The addition of HF 48% and HClO4, 10 and 2 mL, respectively, was performed
in each subsequent digestion step until total dissolution of the solid. Then 5 mL of HClO4 and, at the final step, HNO3
(2.5 mL) and deionized water (2.5 mL) were added. This approach consumed 36.5 mL of acids to achieve dissolution of the material. Dissolution by the method proposed here employed ca. 4 times less volume of acid. Even through the authors used microwave digestion, a higher amount of acid mixture was used compared with our study: 3 mL of HNO3
65% and 10 mL of HF 48% to dissolve 0.1 g of ceramic. Having optimized the microwave-assisted acid decomposition procedure for Na-[Al]-RUB-18 layered aluminosilicates, such straightforward method was applied to dissolve pillared-layered aluminosilicates and to quantify Al and Na. The dissolution of these solids was performed with the microwave program shown in Table S1 (Supplementary Information section), using only 300 mg of H3BO3 after the single dissolution step. Si/AlICP
ratios were determined as described above with [Al]-RUB samples (Table S2, Supplementary Information section). This approach can be applied to the dissolution of synthetic talc, a well known 2:1 phyllosilicate, a clay. Since the 2:1 phyllosilicates lose their brucite layer in acid media, the silica layers remain free and are dissolved by the working up of the process. In fact, the procedure is simpler and faster for phyllosilicates; the octosilicate is very difficult to dissolve and analyze, and that was precisely the reason why we decided to report it as the main subject of this procedure. Furthermore, the acid dissolution process studied here was used to dissolve mordenite and omega zeolites (Table S3,
Supplementary Information section), aluminophosphates and silicoaluminophosphates (results not shown).
Additionally, it is noteworthy that the proposed method complies with the concepts of Green Chemistry because it reduces the use of reactants and generation of hazardous substances for the quantification of Al and Na in aluminosilicates.35
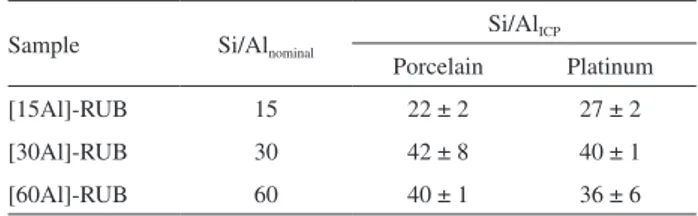
In this study, silicon was determined indirectly, and the Si/Al molar ratio was calculated by difference (Table 7),36
taking into account the amount of calcined sample in both type of crucibles, from aluminum and sodium values quantified by ICP OES (Table 6). The differences between the values obtained and calculated were not related to problems involving the recovery of the elements but to the synthesis method of the solids studied. The amount of heteroatom incorporated into zeolites and/or molecular sieves depends of the method of incorporation, framework type and nature of the heteroatom (Al3+, B3+, V5+, Ti4+, Fe3+,
etc.) to be incorporated, as observed in the literature.37-39
In order to evaluate if there is a difference between platinum and porcelain crucibles, the t-test was applied. There is no significant difference at 99% confidence level for sample [15Al]-RUB and 95% for [30Al]-RUB and [60Al]-RUB for results obtained using platinum and porcelain crucibles. In this way, aluminosilicates can be calcined at 900 °C in porcelain crucibles because the material does not interfere in the quantification of Na and Al.
Conclusions
The microwave-assisted decomposition procedures optimized in this study for aluminosilicates was shown to be effective, since a complete dissolution of the solids in a short period of time was observed while the consumption of acids was kept to a minimum. The procedures were applied to layered Na-[Al]-RUB-18 and to their pillared derivative, to two zeolite structures and are also adequate for clays, phosphates and aluminophosphates. By using porcelain or platinum crucibles for the calcination step, there was no difference on Si/Al molar ratios when the silicon concentration was obtained by difference of the Table 7. Si/Al molar ratio calculated from results obtained by ICP OES
Sample Si/Alnominal
Si/AlICP
Porcelain Platinum
[15Al]-RUB 15 22 ± 2 27 ± 2
[30Al]-RUB 30 42 ± 8 40 ± 1
amount of calcined sample. Finally, the strategies of sample preparation for Na and Al quantification by ICP OES allow high analytical frequency.
Supplementary Information
Supplementary information is available free of charge at http://jbcs.sbq.org.br as PDF file
Acknowledgments
The autors gratefully acknowledge the Fundação de Amparo à Pesquisa no Estado de São Paulo (FAPESP 2014/06942-0). F. S. O. R. and R. K. S. A. also acknowledge FAPESP (2012/09001-7 and 2013/25706-3) for the scholarships. Both H. O. P. and M. A. Z. A. acknowledge Conselho Nacional para o Desenvolvimento Científico e Tecnológico (CNPq) for the scholarships.
References
1. Marjanovic, L.; McCrindle, R. I.; Botha, B. M.; Hermanus Potgieter, J.; J. Anal. At. Spectrom.2000, 15, 983.
2. Chand, V.; Prasad, S.; Microchem. J.2013, 111, 53.
3. Silva, C. S.; Blanco, T.; Nóbrega, J. A.; Spectrochim. Acta, Part B2002, 57, 29.
4. Santos, M. C.; Nogueira, A. R. A.; Nóbrega, J. A.; J. Braz. Chem. Soc.2005, 16, 372.
5. Yafa, C.; Farmer, J. G.; Anal. Chim. Acta2006, 557, 296. 6. Balarama Krishna, M. V.; Chandrasekaran, K.; Chakravarthy,
S.; Karunasagar, D.; Fuel2015, 158, 770.
7. Chang, X.; Luo, H.; Cui, Y.; Zhu, X.; Zhai, Y.; Hu, Z.; He, Q.;
J. Mol. Struct.2008, 891, 45.
8. Tsolakidou, A.; Buxeda i Garrigós, J.; Kilikoglou, V.; Anal. Chim. Acta2002, 474, 177.
9. de Pietre, M. K.; Bonk, F. A.; Rettori, C.; Garcia, F. A.; Pastore, H. O.; Microporous Mesoporous Mater.2011, 145, 108. 10. Low, F.; Zhang, L.; Talanta2012, 101, 346.
11. Frenzel, M.; Ketris, M. P.; Gutzmer, J.; Miner. Deposita 2014,
49, 471.
12. Grünewald-Lüke, A.; Gies, H.; Müller, U.; Yilmaz, B.; Imai, H.; Tatsumi, T.; Xie, B.; Xiao, F.-S.; Bao, X.; Zhang, W.; de Vos, D.; Microporous Mesoporous Mater.2012, 147, 102. 13. Balaram, V.; Ramesh, S. L.; Anjaiah, K. V.; Fresenius’ J. Anal.
Chem.1995, 353, 176.
14. Jarvis, I.; Totland, M. M.; Jarvis, K. E.; Chem. Geol.1997, 143, 27.
15. Silva, J. S. A.; Maranhão, T. A.; de Oliveira, F. J. S.; Curtius, A. J.; Frescura, V. L. A.; J. Braz. Chem. Soc.2014, 25, 1062. 16. Navarro, M. S.; Andrade, S.; Ulbrich, H.; Gomes, C. B.; Girardi,
V. A. V.; Geostand. Geoanal. Res.2008, 32, 167.
17. Langmyhr, F. J.; Sween, S.; Anal. Chim. Acta1965, 32, 1. 18. Yengar, G, V.; Sansoni, B.; Elemental Analysis of Biological
Materials; Inernation Atomic Energy Agency: Vienna, 1980, p. 28
19. Morais, T. R.; Coutinho, A. P. R.; Camilo, F. F.; Martins, T. S.; Sartorelli, P.; Massaoka, M. H.; Figueiredo, C. R.; Lago, J. H. G.; J. Braz. Chem. Soc.2017, 28, 492.
20. Horbik, D.; Łowińska-Kluge, A.; Górski, Z.; Stanisz, E.; Zgoła-Grześkowiak, A.; J. Braz. Chem. Soc.2013, 24, 1478. 21. Baldassari, S.; Komarneni, S.; Mariani, E.; Villa, C.; Appl. Clay
Sci.2006, 31, 134.
22. Gharibeh, M.; Tompsett, G. A.; Conner, W. C.; Top. Catal.2008,
49, 157.
23. Vicente, I.; Salagre, P.; Cesteros, Y.; Medina, F.; Sueiras, J. E.;
Appl. Clay Sci.2010, 48, 26.
24. Amiri, A.; Maghrebi, M.; Baniadam, M.; Zeinali Heris, S.; Appl. Surf. Sci.2011, 257, 10261.
25. Moura, K. O.; Pastore, H. O.; Microporous Mesoporous Mater.
2014, 190, 292.
26. Muratli, J. M.; McManus, J.; Mix, A.; Chase, Z.; Talanta2012,
89, 195.
27. Yokoyama, T.; Makishima, A.; Nakamura, E.; Chem. Geol.
1999, 157, 175.
28. Hassan, N. M.; Rasmussen, P. E.; Dabek-Zlotorzynska, E.; Celo, V.; Chen, H.; Water, Air, Soil Pollut.2007, 178, 323.
29. Bettinelli, M.; Beone, G. M.; Spezia, S.; Baffi, C.; Anal. Chim. Acta2000, 424, 289.
30. Chao, T. T.; Sanzolone, R. F.; J. Geochem. Explor.1992, 44, 65. 31. Sandroni, V.; Smith, C. M. M.; Anal. Chim. Acta2002, 468, 335. 32. Enamorado-Báez, S. M.; Abril, J. M.; Gómez-Guzmán, J. M.;
ISRN Anal. Chem.2013, 2013, 1.
33. Hu, Z.; Gao, S.; Liu, Y.; Hu, S.; Zhao, L.; Li, Y.; Wang, Q.;
J. Anal. At. Spectrom.2010, 25, 408.
34. Totland, M.; Jarvis, I.; Jarvis, K. E.; Chem. Geol.1992, 95, 35. 35. Anastas, P. T.; Warner, J. C.; Green Chemistry: Theory and
Practice; Oxford University Press: New York, 1998, p. 30. 36. Corma, A.; Rey, F.; Valencia, S.; Jordá, J. L.; Rius, J.; Nat.
Mater.2003, 2, 493.
37. Superti, G. B.; Oliveira, E. C.; Pastore, H. O.; Bordo, A.; Bisio, C.; Marchese, L.; Chem. Mater.2007, 19, 4300.
38. de Pietre, M. K.; Bonk, F. A.; Rettori, C.; Garcia, F. A.; Pastore, H. O.; Microporous Mesoporous Mater.2012, 156, 244. 39. Ungureanu, A.; Dragoi, B.; Hulea, V.; Cacciaguerra, T.; Meloni,
D.; Solinas, V.; Dumitriu, E.; Microporous Mesoporous Mater.
2012, 163, 51.