Article
Printed in Brazil - ©2017 Sociedade Brasileira de Química0103 - 5053 $6.00+0.00*e-mail: [email protected]
An Investigation on Morphology and Fractal Dimension of Diesel and
Diesel-Biodiesel Soot Agglomerates
Aline L. N. Guarieiro,a Arantzazu Eiguren-Fernandez,b,c Gisele O. da Rochaa,d,e and
Jailson B. de Andrade*,a,d,e
aINCT em Energia e Ambiente, UFBA, 40170-290 Salvador-BA, Brazil
bDepartment of Environmental Health Safety, University of California, Los Angeles-CA, USA
cAerosol Dynamics, Inc., 935 Grayson St. Berkeley, 94710 Berkeley-CA, USA
dInstituto de Química, Universidade Federal da Bahia, 40170-290 Salvador-BA, Brazil
eCentro Interdisciplinar em Energia e Ambiente (CIEnAm), Universidade Federal da Bahia,
40110-040 Salvador-BA, Brazil
In this study, it is reported the fractal dimension and morphology of ultrafine particles emitted by a diesel engine run with B4, B50, and B100. Transmission electron micrographs evidenced two main groups of particles with characteristic and distinct morphological behaviors: (i) particle agglomerate structures self-organized within a fractal-like geometry, and (ii) amorphous and irregular particles with diffuse edges in a liquid-like particle appearance, mainly associated with some sub-fractions of samples collected from B50 and B100 combustion. Particles from (i) showed typical diesel soot morphology and fractal dimension. Primary particle diameter (Dpp) was 24 ± 4 nm, 23 ± 4 nm, and 20 ± 4 nm for B4, B50, and B100, respectively. Mean aggregate gyration diameters (Dg) ranged from 242 ± 140 nm for B4, 210 ± 135 nm for B50, and to 232 ± 140 nm for B100. In turn, fractal dimensions (Df) were 1.94, 1.89, and 1.99 for B4, B50, and B100, respectively. On the other hand, particle from (ii) had their morphology impaired from the addition of biodiesel to petrodiesel in a way it did not follow a fractal geometry.
Keywords: nanoparticles, morphology, fractal dimension, biodiesel/diesel emissions, soot
agglomerates
Introduction
Diesel engines are largely used in both stationary and mobile applications whenever is needed a high-power
source.1,2 They provide high thermal efficiency, and
consume relatively cheap fuel.2 However, diesel engines
emit a large amount of harmful particulate matter (PM),
which is associated with adverse health-related outcomes.3
Diesel engine exhaust is a complex multi-mixture of diverse pollutants found either in vapor- or in particle-phases. Examples of them are ultrafine particles (UFP, particle diameter (dp) < 100 nm) or nanoparticles (NP, dp < 50 nm),
organic carbon (OC), and elemental carbon (EC) as well as volatile and/or semi-volatile organic compounds (VOC and/or SVOC).4-9 Exposure to traffic-related air pollutants
has been linked to health effects by epidemiological
studies.3,10,11 Some of them have specifically supported
the adverse health effects of exposure to UFP and NP in addition to fine and/or coarse particulate matter.12 Health
problems include increased risk of reduced lung function, adverse respiratory symptoms, asthma, cardiovascular diseases, morbidity, and mortality.3,10-15
Diesel engine exhaust particles are very complex geometrically, being mainly composed by black carbon/ soot. They are principally formed during combustion in
the fuel rich regime of a combustion chamber.16-19 Diesel
carbonaceous soot aggregates consist of many spherical monomers ranging from 20-50 nm in diameter composed of graphite carbon typically coated with organics. Those aggregates are fractal agglomerates of solid primary
nanoparticles.5,16-18,20-22 The aggregates have mobility
respectively.21,23 The morphology of soot determines their
properties, their effect in the environment and how it can significantly affect their deposition in human respiratory system20,23 since it may affect the way particles interact with
lung epithelial cells.24 Typical morphologies are regarded
as aggregates, spheres, irregularly shaped, and/or bar-shaped particles.24,25 The size, structure, composition and
concentration of aggregate particles is normally modified by engine types, type and quality of fuel burned as well as operating conditions, such as load, speed, combustion temperature, air-to-fuel ratio, and injection pressure, among others.16,26
Furthermore, not only to determine the NP and UFP morphology but also the measurement of their size are important points to be addressed. Since the smaller the particle is the bigger is the surface area, having a higher probability to suffer modification in the composition, by absorbing/adsorbing fractions of potentially toxic organic compounds. In this way, it is related to the ability of participating in atmospheric chemistry as well as worsening possible health-related injuries. Additionally, the smaller the particle is the deeper it may go in the respiratory system and possibly higher would be the related health problems.1,3
In urban areas, carbonaceous particulate matter typically accounts for 25-50% of the ambient PM2.5 besides
having a significant impact on the global climate, either scattering or absorbing light. Soot particles are ubiquitous in the atmosphere and are generated by internal combustion engines, among other combustion sources. Despite its relevance, to date only few studies consider the actual ultrafine particle morphologies and further investigations to better understand the role of the particle shape in the atmosphere and how it contributes to some health effects still are necessary.
In spite the fact the recent advances in reducing diesel emitted particles by improving engine technologies, diesel engines still exhaust a relatively high concentration of NP and UFP to the atmosphere, which rise both relevant environmental and human health concerns. In the same way, it has been applied another alternative strategy to improve diesel emission quality, which is the partial replacing of fossil diesel by biodiesel. The use of biodiesel has gained much attention by the fact it has been regarded to be more environmental friendly and less carbon and particulate matter emitter during its combustion.16,26-32 But, if by one
hand biodiesel is pointed to emit less regulated pollutants, such as SO2, PM, CO, among others (except for NOx), on the
other hand, when non-regulated species are considered there is an opposite trend. For instance, when some unregulated
pollutants are studied, such as O3, carbonyl compounds,
polycyclic aromatic compounds (PAH), and size classified
particulate matter, it was found biodiesel generally emit
higher levels of them than mineral diesel.8,32-36 Indeed,
Guarieiro et al.8 has also reported that the more biodiesel
is added to fossil diesel, the higher levels of reactive oxygen species (ROS) are produced into particles then demonstrating biodiesel particles exhaustion would be more toxic, at least in relation to ROS, than mineral diesel. This would be likely to rise more human health-related problems. To date, investigations about physical characterizations (such as particle size, particle morphology, and fractal-like dimension) of nanoparticles and/or ultrafine particles emitted during biodiesel combustion, in comparison to fossil diesel burning emission, are rather insufficient to be completely understood.
In this study, we report results about fractal dimension and morphology of nanoparticles emitted by a diesel engine run with B4 (4% biodiesel added to fossil diesel), B50 (50% biodiesel added to fossil diesel), and B100 (100% waste cooking oil biodiesel) set on a stationary dynamometer/CVS system. Fractal dimension, primary particles diameters, gyration diameters and investigations about morphology of ultrafine particles were done
following the Neer and Koylu22 approach. Together to
that, EC/OC levels were also measured and results are critically discussed.
Experimental
Fuels, engine characteristics and sampling experiments
In this study, there were used three different fuel compositions: B4 (4% of commercial soybean oil biodiesel added to fossil diesel), B50 (50% of waste cooking oil biodiesel to fossil diesel), and B100 (100% waste cooking oil biodiesel). B4 was used in this investigation due to the fact no gas station in Brazil supplies pure mineral diesel (B0) since the Biodiesel Program has started at 2005. The B4 fuel was supplied by BR Petrobras Company (Petrobras Distribuidora, Brazil) and the B100 fuel was produced by the Biodiesel Pilot Plant from Federal University of Bahia (UFBA) (Salvador, Bahia, Brazil). The blend B50 was produced by mixing appropriate amounts of B4 and B100 fuels.
Emission studies were done with a diesel engine (Agrale, model M85, 10 HP) coupled to a steady-state dynamometer for sample collection. Details on the sampling experiments can be found in the first part of this
study, published on Guarieiro et al.8 Information about
and Figure S1, respectively. Briefly, the collection of samples was done at 1 m (PM2.5 system) and 4 m (PM2.5 and NanoMOUDI systems) away from the exhaust pipe and into the dilution chamber (Figure S1). The emission measurement system was operated under the constant volume principle (CVS), using a dilution tunnel (6 m long × 120 mm inner diameter). Engine exhausts were diluted with filtered scrubbed ambient air (air 0) in order to mimic real atmospheric dilution, which is likely to occur in ambient environments. The air flow in the CVS was set up to be under a constant dilution air-to-exhaust gas flow ratio of 15:1 (at 30 m3 min-1), with air velocity inside the
tunnel around 44 m s-1 and Reynolds number of 74,000 in
order to assure laminar air flow conditions.
Samples for chemical composition (OC/EC) were collected using two PM2.5 cyclone systems (PM2.5 Sharp cut cyclone, model VSCC-A, BGI Inc., USA), at point A and D (1 and 4 m away engine, respectively, Figure S1) in the dynamometer/CVS system. PM samples for
OC/EC were collected at a flow rate of 10 L min-1, onto
quartz filters (47 mm, 1 µm pore size, Sartorius, Germany) during 1 hour per fuel. Prior to sample collection, quartz filters were pre-baked at 550 °C for 8 h then were stored in baked aluminum foil-lined containers. After sample collection, filters were kept in teflon-taped polypropylene
Petri dishes (Waters, USA), and in the freezer under 4°C
until analysis. OC/EC measurements were done within 30 days after sampling.
Transmission electron microscope (TEM) samples were deposited on 3 mm TEM copper grid (Carbon Type-B, 300 mesh, Copper - Ted Pella, Inc., USA) attached to PTFE filter substrates placed in the 8th to 14th stages from
the NanoMOUDI (14 stages, model 125B MSP Co., USA). The NanoMOUDI impactor worked at a flow rate
of 30 L min-1, at point D (4 m away engine, Figure S1
only). The NanoMOUDI stages have the following nominal equivalent particle size cutoff diameter: 180-320 nm (stage #8, S8), 100-180 nm (S9), 56-100 nm (S10), 32-56 nm (S11), 18-32 nm (S12), 10-18 (S13), and dp < 10 nm (S14).
Prior to any sample collection the engine was ran for 20 min with the test fuel in order to avoid possible cross-sample contaminations. In order to avoid particle saturation (and avoid particle possible build ups and overlaps) on top of TEM grid, it was submitted to particle laden flow for a very short period of time (up to 5 min). Samples were collected in duplicate. Three blank tests were performed to assess data quality and analytical control. After each collection, grids were carefully removed from the probe by using tweezers and stored in a special protective box until TEM analyzes. TEM grid inspections started within 30 days after particle collection.
Analysis of OC and EC contents
EC/OC concentrations were measured by thermal optical transmittance (following the method proposed by Birch and Cary).37 Briefly, a 1.54 cm2 squared portion
punch was taken from the sampled filters for analysis in the OCEC Analyzer (Sunset Laboratories, USA). During analysis, organic carbon content was volatilized from the sample in a pure helium atmosphere as the temperature has being stepped up to 820 °C. The evolved carbon was then catalytically oxidized to CO, in a bed of granular MnO, (held at about 900 °C), then reduced to CH4 in a Ni/firebrick
methanator (at 450 °C), and quantified as CH4, by a flame
ionization detector (FID). During the second analysis step, pyrolysis correction and EC measurement were made. The oven temperature was reduced, oxygen (10%)-helium mix was introduced, and the oven temperature was then raised to about 860 °C. As oxygen entered the oven, EC pyrolytically-generated was oxidized and a concurrent increase in filter transmittance occurred. The carbon evolved in the first step was considered “organic” and carbon volatilized in the second step was considered “elemental”.
TEM image processing
Grid image inspections were done by using a transmission electron microscope. A JEM-1200EX Transmission Electron Microscope JEOL with resolution of 0.2 nm, and an accelerating voltage of 80 kV was used in this work. The magnifications considered during the TEM inspections were in the range of 6,000× to 200,000×. Magnifications above 150,000× were used for measurements of spherule sizing while lower magnifications, in the range 6,000× to 30,000×, were used for measuring aggregate sizes and morphologies. Micrographs were randomly taken at various locations across each grid surface due to the visual soot concentration to grid position in the exhaust stream.
in the structural information which could reflect in deviations of both actual particle shape and in the
fractal-like dimension (Df) results. Nevertheless, this approach
is well-accepted and has been used by a number of studies,9,22,38-41 which demonstrates the image processing
method applicability and reliability. Error propagations from the measurements to the calculated parameters were estimated within the 95% confidence level.
Particle size and fractal dimension analyses were performed using particle morphologies presented on TEM images. Image analyses (general aspect morphology of aggregates, measurement of primary particle diameter (Dpp),
projected aggregate areas (Aa), characteristic aggregate
lengths (L), and aggregates gyration diameters (Dg)) were
done using the Image J, which is an open source java image processing program software usually applied to processing and statistical analysis. Primary particles diameters (Dpp)
were found by measuring 60 primary particles at each TEM image from each fuel studied (B4, B50 and B100). In turn,
aggregate gyration diameters (Dg) were also measured
at each TEM image sample. For Dg measurements, it
was measured from 150 to 750 aggregates in each grid.
Uncertainties in Dpp and Dg were mostly due to some
ambiguities with identifying spherule borders in the images and the conversion from pixel to nanometer scales.
According to Neer and Koylu,22 N
pp, Dpp, Dg, Aaare
directly related to fractal dimension (Df) as stated by
equations 1 and 2, below:
(1)
where Aa is the aggregate projected area, Ap is the average
primary particle area (πd¯p2 /4), and ka = 1.15 and α = 1.09 are mathematical approachs for considering the likely of primary particles to have point overlap in the aggregates.22
Indeed, those ka and α values are also consistent with the
findings from Brasil et al.38 and Wozniak et al.39 Yet, the
primary particle number, Npp, and its characteristic length
(L) or aggregate gyration diameter (Dg) are related as
follow:
(2)
where Df is the fractal dimension, kL is a correlation
constant, and kf is the fractal prefactor (or a structural
coefficient for possible void positions in the aggregate structure).22,38-41 The fractal-like dimension and the gyration
diameter are considered to be as key parameters to describe
aggregate morphology as well as soot properties.39
In this study, projected areas (Aa) and maximum lengths
(L) of 75 to 125 aggregates were directly measured from low-magnification (6,000× to 30,000×) TEM images for each engine condition. Npp has correlated well with L when
considering more than one thousand spherules, for all engine conditions and fuels tested. In this way, the power slope of the least square fit of the log-log plot Nppvs. Dg/Dpp
gave the fractal-like dimension (Df) of each fuel studied.
In which the closer the Df value is to 1.0 the more
chain-like the aggregate structure is. On the other hand, the more
Df tends to 3.0 the rounder and the more compact is the
aggregate.22,42
Results and Discussion
In regard to fuel composition, it is noteworthy to mention their related differences and/or similarities for each case. Firstly, fossil diesel is mainly composed by
aliphatic saturated hydrocarbons (n-alkanes) with carbon
number ranging from n-C6 up to n-C20. The dominant
portion of n-alkanes in the fossil diesel is mainly
composed by n-tetradecane (n-C14), n-pentadecane (n-C15),
and n-hexadecane (n-C16). Other straight-chain alkanes
gradually decline from the main compounds (n-C14 to
n-C16) to either higher or lower carbon numbers, but they
are minor constituents of petrodiesel. Branched alkanes
and aromatics are presented in even lesser amount.33,43,44
On the other hand, pure soybean biodiesel presents as main components the methyl esters from the following acids: linoleic acid, oleic acid, and palmitic acid, as well as linolenic acid and stearic acid, in lesser amount. Taking into consideration waste cooking oil (WCO) in Brazil is mainly soybean oil which was used in successive thermal oxidative processes prior to its discharging, it is reasonable to assume WCO biodiesel is also mainly composed of the same major methyl esters but with a bigger contribution of minor short-chain organic components originated from the breakdown of the unsaturated fatty acids produced
via temperature rising during cooking processes.8,33,43-45
Summing up, a priori, the employment of two biodiesels
in this study did not interfere significantly in our results since we used chemically similar biodiesels (please also see Guarieiro et al.8,33,34 and references therein).
In addition, possible changes in morphology and/or in the fractal dimension of particles emitted by burning of different fuels is negligible or has not been observed
whatsoever.6,16,18 In this way, we may assume fractal
dimension (Df) and other particle structure parameters,
such as Dg, Dpp, and Npp, would not be effectively affected
OC/EC emission factors
Organic carbon (OC) and elemental carbon (EC) samples were collected in both point A (1 m away from exhaust mix) and point D (4 m away from exhaust mix) on the dynamometer/CVS system as observed in Figure S1. OC and EC factor emissions were calculated as
micrograms (µg) of either OC or EC emitted per kilogram
of burned fuel mix (µg kgfuel-1). Organic carbon factor
emissions (units in µg kgfuel-1) ranged from 842 (point A)
to 1243 (point D), 466 (point A) to 895 (point D), and 508 (point A) to 892 (point D) for B4, B50, and B100, respectively. In the same way, EC factor emissions (units in µg kgfuel-1) were 399 (point A) to 692 (point D),
219 (point A) to 413 (point D), and 667 (point A) to 1144 (point D), B4, B50, and B100, respectively.
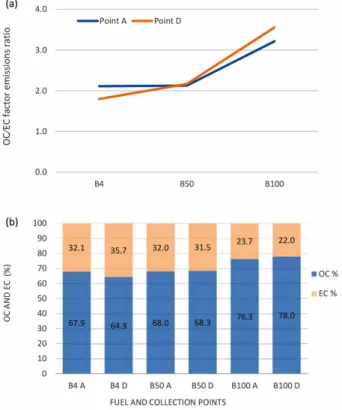
In considering the values of OC and EC emission factors individually as well as the ratio OC/EC emission factors (Figure 1a), OC emission factors were about 2 times higher than EC emission factors, for every studied fuel or fuel mix. Additionally, results from Figure 1b show a similar emission profile for points A and D but the point D OC and EC percentages in total carbon were 2-3 times higher than those ones from point A, for either B4, B50, or B100. Higher levels in point D than in point A are related to the exhaustion cooling as it goes through the CVS and gradually moves away from the engine. This makes particle size growing by successive condensation, nucleation and/or agglomeration processes and more efficient gas-to-particle conversions. When comparing OC emission factors among the tested fuels, this is observed an increase in OC emission when more biodiesel is added to fossil diesel. On the other hand, EC emission factor decreases when more biodiesel is added. The increase trend of OC and the decrease trend of EC emission factors may influence directly the aggregate particle physical properties since they act as supporting substrates for condensation of weakly volatile gaseous and/or liquid species on aggregated particles surfaces. This could probably contribute to make changes in the structure, size, morphology, and therefore, in the fractal dimension of aggregated particles emitted by the burning of diesel/ biodiesel blends.
Another useful point of view is to consider the combustion process by itself for explaining the OC/EC emission trend observed in this study. Taking in consideration combustion is an inherent oxidative process, which, in the hypothetically rigorously efficient conditions should convert all organic matter content into carbon dioxide
and water. In this way, under these conditions, n-alkanes
(as those presented by fossil diesel) would be gradually oxidized and be converted to alcohols, then to carbonyl
compounds, then to carboxylic acids, then to esters and finally yielding to carbon dioxide. However, it is known and well-accepted that no real engine system possesses such efficiency and, therefore, total conversion of organic matter to carbon dioxide and water does not happen in real world conditions. There would have an array of conditions (such as oxygen-to-fuel ratio, combustion temperature, energy, compression rate, among others) during fuel burning in the combustion chamber that results in a lower combustion efficiency.
In this way, in real and incomplete combustion conditions, it also is formed elemental carbon (EC, the less oxidized combustion product) and a number of different
organic products (from n-alkanes to alcohols, carbonyls,
carboxyls, and esters), which are represented here as organic carbon or OC, and/or finally carbon dioxide, which is the most oxidized product.8,33,44 On the other hand, when
Our findings are consistent with this mechanistic discussion about fuel combustion.
Another portion of OC levels observed in the present study is likely to be derived from the unburned petrodiesel and/or biodiesel. Due to the same inherent inefficiency of any diesel engine, during fuel combustion a portion of the fuel admitted in the combustion chamber does not meet the characteristic parameters needed to be actually burned. In this way, some fuel remains unburned and then it is expelled off the engine nearly chemically unmodified. Due to the high temperature and pressure this unburned fuel portion was undertaken in the combustion chamber, it is likely to be released within the exhaust as low-volatile vapor or as part of OC content of particulate matter (PM). Yet, during the exhaust cooling process in the CVS, this portion of unburned fuel primarily emitted as low-volatile vapor probably is transferred onto pre-existing PM, possibly being either absorbed or adsorbed or both. This would contribute for the particle size growth, increasing primary
particle diameter (Dpp) or generating and adding up new
primary particles (increasing Npp) to agglomerates and
then increasing particle size (or increasing agglomerate
gyration diameter, Dg). Depending on how much this
process happens it would be virtually possible to modify the fractal dimension (Df) in some extension.
TEM observations
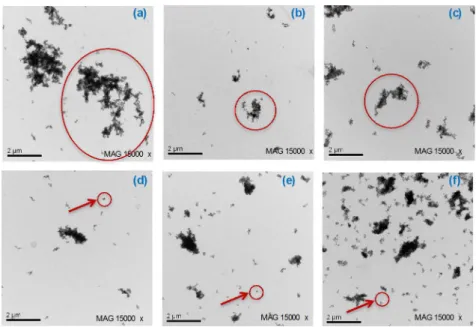
Typical particles TEM images are shown in Figures 2 and 3. In these figures, there are particles emitted by a diesel
engine fueled with B4, B50, and B100, at low conditions (low load). TEM samples were collected in the stages S8 (180-320 nm), S9 (100-180 nm), S10 (56-100 nm), S11 (32-56 nm), S12 (18-32 nm), S13 (10-18 nm), and S14 (< 10 nm) of a NanoMOUDI sampler.
In general, TEM images have demonstrated essential features of diesel soot emission, with apparent fractal geometry, which are similar to those reported elsewhere.6,16,22
However, it was not possible to distinguish different particle formats among the tested fuels (B4, B50, and B100). For all fuels, particles presented slightly different shapes with grapelike structures and cluster-cluster type formations, as indicated by red circles in Figure 2. Some of those small particle aggregates are composed of some tens to few hundreds of primary particles. These small new particles could have been nucleated in the combustion chamber and freshly emitted by the engine.
Indeed, those such small particles or particle aggregates are of major environmental and human health concerns. In the environmental point of view, those very small particles are likely to possess large superficial area, which become a very active surface for both chemical (diverse reactions) and physical (condensation/evaporation, coagulation, gas-to-particle conversions) processes to occur, or absorption and adsorption processes, respectively. These multiple processes can potentially modify particles’ compositions and influence air quality of a given region. In turn, regarding human health, ultrafine freshly emitted particles as seems to have happened during tests done using B4, B50, and B100, are able to go more profoundly
in the human respiratory system, which may trigger a series of health endpoints.
High magnification TEM micrographs (Figures 2 and 3) were taken in order to identify more detailed structures from different fuels (and also from the latter stages of NanoMOUDI). In Figure 3c, it is noted a different type of structure for particle aggregates in B100 (collected in the S13 but also stages S11, S12, and S14), which does not follow a fractal geometry anymore. The same occurs for particles from S13 and S14 for both B50 and B100 (as exemplified by Figures 3b and 3c). In these occurrences, it is not possible to observe any primary particles anymore. They are rather better classified as amorphous and irregular particles, with diffuse borders. When comparing them to particles found in B4 (which have shown themselves as primary particles aggregates as grapelike formations in all stages for all fuels), it could be interpreted that the increase in the biodiesel addition to fossil diesel is likely to have contributed to modify the particle formats from B50 and B100, and may be the reason particle aggregates does not follow a fractal structure anymore in these cases. The morphological profile on irregular amorphous particles with mainly diffuse edges emitted from B100 burning was
found S10-S14 stages. According to Barone and Zhu,24
this kind of particle formations are solids composed by low volatility liquids, which are formed depending on the potency and engine operation conditions. In the Figures 3b and 3c particles look like as if they were several liquid-like particles without defined spherules nor fractal geometry structures. Since our samples were collected at low load conditions, we observe particle images with particles’ appearance of a nebulous and amorphous structures. Our findings are also consistent with some studies with collected particles within similar conditions, also using biodiesel as fuel.46
Considering that OC levels are increased in B100 in relation to B4 as well as the PAH emission factors are higher in B100 (in comparison to B4), as demonstrated in the first part of our study (found on Guarieiro et al.),8 these findings
are related to each other. These irregularities in the particle
shapes could be due to higher levels of low volatility viscous organic compounds emitted during B100 burning, derived either from the incomplete burned fuel or from the low-volatile vapor unburned fuel fractions or both. In turn, if OC levels rise, the EC levels decreases when biodiesel (B100) is used. In this way, carbonaceous particles from EC is limited in B100 exhaust what could difficult to promote a more defined structure such as grapelike soot particles as in typical diesel soot formations. This would also favor the formation of liquid-like particles in the case more biodiesel (B50 and B100) is available in the fuel burned. Also, if the amount of organic species and the probable large variety of them would be the main substances composing smaller particles from B100 burning, this could be an indicative that such particles would be more toxic than particles emitted from fuel blends with lower biodiesel content (as found in DTT assay results at Guarieiro et al.).8
Particle size and fractal dimension measurements
Quantifications of particle size by measuring primary particle diameter (Dpp) and aggregate gyration diameter (Dg)
were made for each fuel, from S8-S11 NanoMOUDI stages. Results from S12 and S13 stages were not used in the present study since they did not present enough number of spherules for having been consistently measured. The apparent primary particles profiles were visually detected at high magnifications around the edges of multiple aggregates.
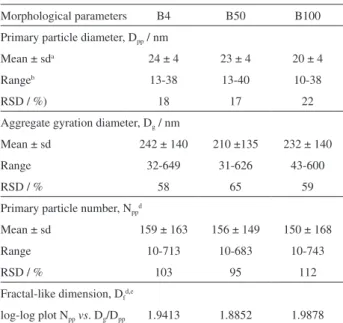
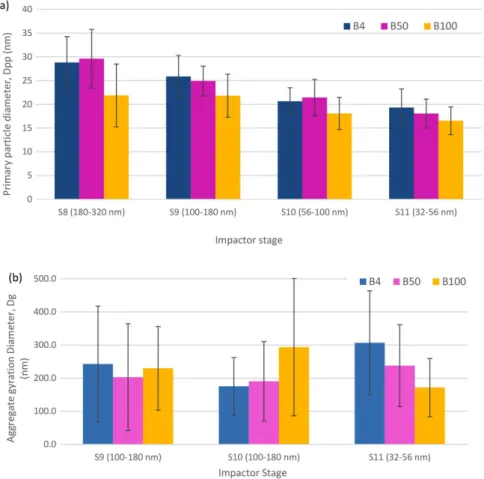
Figure 4a and Table 1 present statistical primary particle diameter measurements for each fuel in S8-S11 stages
samples. The number-averaged Dpp is 24 ± 4 nm for B4,
23 ± 4 nm for B50, and 20 ± 4 nm for B100. A narrow Dpp
range (13-38 nm for B4, 13-40 nm for B50, and 10-38 nm for B100) together with small standard deviation values show the low variability of primary particle size.
This is indicative the particle aggregates are nearly monodispersed and they are representative of fractal structures, as expected to be from diesel soot particles.
Although it is observed a weak trend of Dpp reduction
when increasing the relative amount of biodiesel added to petrodiesel, this is not enough to consider those small differences in the primary particle diameter statistically significant. In this way, we consider the average Dpp weak
variability among different fuels or fuel mixes is within the random experimental error. Therefore, agglomerate particles were constituted by spherules with nearly the same size, regardless the fuel composition.
In turn, aggregate gyration diameters (Dg) ranged from
242 ± 140 nm, 210 ± 135 nm, and to 232 ± 140 nm for B4, B50, and B100, respectively (Table 1 and Figure 4b).
An average primary particle number (Npp) of 159 ± 163,
156 ± 149, and 150 ± 168 were found for B4, B50, and
B100, respectively (Table 1). As we can see, for both Dg
and Npp there are a large variation of those values around
the mean values, indicating a found relatively wide Dg
range (32-649 nm (B4), 31-626 nm (B50), and 43-600 nm
(B100)) as well as wide Npp range (10-713 spherules (B4),
10-683 spherules (B50), and 10-743 spherules (B100)) thus indicating fuel combustion in the diesel engine yielded agglomerate particles constituted ranging from few monomers to larger and probably more structured agglomerates arranged within a fractal geometry. Considering our sampling setup, when particles and/or low-volatile vapor were freshly exhausted out the engine under laminar flow, they were allowed to be cooled down and then reorganize in fractal soot structures within a 4 m long dilution tunnel from CVS system. This particle sizing
range found here is a result of many physical and chemical successive processes (such as nucleation, gas-to-particle conversion, agglomeration, condensation, among others) exhaust underwent in order to organize itself into fractal soot agglomerates within such size ranges.
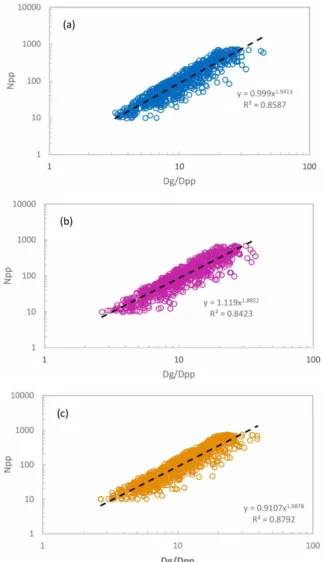
Primary particle number (Npp) correlated well with Dg
for B4, B50, and B100 fuels, presenting a few more than one thousand spherules. Fractal dimensions (Df) were calculated
by the logarithmical relation of Npp versus Dg/Dpp for B4
(Figure 5a), B50 (Figure 5b), and B100 (Figure 5c). Both calculated Df were 1.94, 1.89, and 1.99 and kL were 1.00,
1.12, and 0.91 for B4, B50, and B100, respectively. When trying to compare Npp, Dg, kL, and Df, we do not see any
trend according to fuel composition. So, in regard to those morphological parameters, burning of B4, B50, and/or B100 yielded soot with similar fractal structure for those agglomerates from stages S8-S11 from the NanoMOUDI.
Besides the parameters Npp, Dpp, Dg and Df already
presented here, another important parameter is the fractal prefactor, kf, in order to fully characterize the morphology
and size of particle agglomerates. Small kf values implies
more elongated and larger overall dimensions even for a pool of aggregates with the same Npp and Df values.22 One
such limitation is related to not being possible to measure kf
directly in studies about diesel engines. However, according to Neer and Koylu22 k
f can be calculated by the following
relationship:
(3)
In this way, in our calculations we found kf to be equal
to 1.99, 2.22, and 1.82 for B4, B50, and B100, respectively. We tentatively interpret these values as indicative primary particles are nearly round, regardless the fuel composition.
Neer and Koylu22 (and references therein) found fractal
prefactor values in the range 1.3-2.4 for internal combustion
engines. The found kf values in this study are consistent
with those accepted values.
According to fractal models stated by Schaefer42we
may consider particle formation, aggregation, transport and growth was done under diffusion-limited cluster
aggregation (DLCA). According to Schaefer42 when
exhausts exit the combustion chamber very small particle nuclei (or spherules and/or single primary particles) are randomly moving into the CVS dilution tunnel as they cool down. Eventually few single primary particles meet each other forming a chain-like, and then grapelike structure and the fractal self-organization is started. As these grapelike primary particle agglomerates continue to move away from the engine, a union of some of them is formed and then a Table 1. Fractal-like parameters measurements (Dpp and Dg) or calculated
(Npp)
Morphological parameters B4 B50 B100
Primary particle diameter, Dpp / nm
Mean ± sda 24 ± 4 23 ± 4 20 ± 4
Rangeb 13-38 13-40 10-38
RSD / %) 18 17 22
Aggregate gyration diameter, Dg / nm
Mean ± sd 242± 140 210 ±135 232 ± 140
Range 32-649 31-626 43-600
RSD / % 58 65 59
Primary particle number, Nppd
Mean ± sd 159 ± 163 156 ± 149 150 ± 168
Range 10-713 10-683 10-743
RSD / % 103 95 112
Fractal-like dimension, Dfd,e
log-log plot Nppvs. Dg/Dpp 1.9413 1.8852 1.9878 aArithmetic mean ± one standard deviation; binterval between the minimum and maximum found values; crelative standard deviation in terms of percentage; dN
cluster is formed and it moves as a unit. The result of this process is an open fractal structure with avoid positions with no obvious center, as we see in Figures 2 and 3. Indeed, the DLCA condition, generally soot agglomerates are arranged in a fractal geometry though they present hollow, less dense structures. If particle agglomerates are relatively hollow they are likely to stay suspended in the air for a longer time than a more compact agglomerate. When particle agglomerate soot is formed under DLCA regime, the theoretical accepted value of Df is around 1.80. In Table 2,
we compare our results with other reported studies, which used either diesel, biodiesel or natural gas in their studies. In these studies, Df ranged from 1.50 to 2.18. Taking into
consideration these studies have used different experimental setups, different combustion regimes, and different engine technologies, we consider our results are in good agreement
with them. In the same way, we also say our results for Dg
and Dpp are consistent with the literature (Table 2).
Adopting the fractal geometry concept to describe carbonaceous diesel soot may rise practical implications in different areas. First of all, for practical purposes, in many aspects of Atmospheric Sciences we assume an atmospheric
particle as a sphere with density of 1 g cm-3. And with
of health-related symptoms. By not considering the exact particle geometry it may be contributing to inaccurate understandings and accepted models. Finally, in terms of engine technology, the consideration of the fractal geometry of soot particles may help to develop more efficient engines by improving the combustion step as well as automobile catalyst systems able to emit ultrafine particle in lower levels, minimizing air pollution around large cities. If also considering the formation of amorphous particles when more biodiesel is added to fossil diesel it may contribute to the synthesis of new additives for oxygenate fuels in order to improve combustion characteristics and predict particle geometry.
Conclusions
This study investigated the fractal nature of diesel soot agglomerates emitted from combustion of diesel and biodiesel blends. Results from this study indicates that OC/EC content of PM2.5 samples was altered by the addition of biodiesel to
petrodiesel as well as general aspect morphologies. When more biodiesel was added to petrodiesel, a larger contribution of non-fractal particles with diffuse edges were observed. TEM images showed liquid-like particles mostly present for B50 and B100 for particles collected after the 10th stage
of the NanoMOUDI impactor.
On the other hand, particle agglomerates collected from the 8th to 11th impactor stages showed fractal-like geometry.
In these cases, average particle size was 242 nm (B4), 210 nm (B50), and 232 nm (B100), being composed by round spherules of 24 nm (B4), 23 nm (B50), and 20 nm (B100). Figure 5. Statistical determinations of average fractal properties for
particles emitted during (a) B4, (b) B50, and (c) B100 combustions.
Table 2. Comparisons of fractal dimension and morphology of soot agglomerates among previously published studies and the present investigation
Publication Engine type (B/D)a D
f Dgb / nm Dppb / nm
This study diesel engine, 6.0 L, 2 cylinders, (B/D) 1.94 (B4) 1.89 (B50) 1.99 (B100)
242 ± 140 (B4) 210 ± 135 (B50) 232 ± 140 (B100)
24 ± 4 (B4) 23 ± 4 (B50) 20 ± 4 (B100) Mustafi and Raine2 diesel engine, (D/natural gas) 1.73-1.88 (D/NG)
1.69 (D)
ND 26.9-29.5 (D/NG)
26.4 (D) Savic et al.16 diesel engine, Euro IV car, 4 cylinders, (B/D) 2.18 ± 0.1 (B)
1.71 ± 0.1 (D)
55-155 12-19 (B)
19-23 (D)
Neer and Koylu22 diesel engine, 5.9 L, (D) 1.77 ± 0.13 160-350 20-35
Ajtai et al.23 diesel engine, 6 cylinders, (B/D) ND ND 7-10
Lapuerta et al.29 diesel engine, 1.7 L, 4 cylinders, (D) ND ND 23.51 ± 6.41
Traviss et al.31 non-road diesel engine, (B20/D) 1.63 (D) 1.61 (B20)
109 ± 16.1 (D) 99 ± 9.7 (B20)
10.8 ± 3.8 (D) 10.7 ± 3.2 (B20)
Seong et al.47 diesel engine, 0.48 L, 1 cylinder (B/D) 1.57-1.73 22-31 11-17
Lu et al.48 diesel engine, 4 cylinders, (D) ND ND 23.8-28.5
Chandler et al.49 non-road diesel engine, 5.9 L, (D) 1.70-1.90 78-135 20-30
Lee et al.50 diesel engine, 1.7 L, 4 cylinders, (D) 1.50-1.70 77-134 22 ± 2
Lee et al.51 diesel engine, 1.7 L, 4 cylinders, (D) 1.46-1.73 50-102 32 ± 3 aB = biodiesel fuel, and D = mineral diesel fuel; bin some studies it is reported r
Fractal dimension of aggregates were 1.94 (B4), 1.89 (B50), and 1.99 (B100), which shows formation and growth under diffusion-limited cluster aggregation. Morphological parameter results show agglomerates were self-arranged in fractal geometry, with similar fractal dimension values, regardless the fuel composition.
Supplementary Information
Supplementary information is available free of charge at http://jbcs.sbq.org.br as a PDF file.
Acknowledgments
Authors are thankful for Prof Dr Leonardo S. G. Teixeira for analyses of both commercial diesel and biodiesel and Prof Dr Antonio H. Miguel for his helpful suggestions in this work. We acknowledge Prof Dr Ednildo A. Torres and Prof Dr João Victor S. Santos for helping in the particle sampling and Marina C. Rodrigues for helping in the image processing. Authors also thank for the following funding resources: PETROBRAS S/A, CNPq, CAPES, FAPESB, CNPq/FAPESB/PRONEX.
References
1. Wang, Y.; Liang, X.; Shu, G.; Dong, L.; Sun, X.; Yu, H.; Tribol. Int.2015, 92, 379.
2. Mustafi, N. N.; Raine, R. R.; Aerosol Sci. Technol. 2009,43, 951.
3. Broday, D. M.; Rosenzweig, R.; J. Aerosol Sci.2011, 42, 372. 4. Shukla, P. C.; Gupta, T.; Agarwal, A. K.; Aerosol Air Qual. Res.
2014, 14, 934.
5. Chin-Hsiang, L.; Whey-May, L.; Jiun-Jian, L.; J. Environ. Sci.
2009, 21, 452.
6. Choi, S.; Myung, C. L.; Park, S.; Int. J. Automot. Technol. 2014,
15, 219.
7. Myung, C. L.; Ko, A.; Park, S.; Int. J. Automot. Technol. 2014,
15, 203.
8. Guarieiro, A. L. N.; Santos, J. V. S.; Eiguren-Fernandez, A.; Torres, E. A.; da Rocha, G. O.; de Andrade, J. B.; Fuel 2014,
116, 490.
9. Kam, W.; Liacos, J.W.; Schauer, J. J.; Delfino, R. J.; Sioutas, C.; Atmos. Environ. 2012, 55, 90.
10. Pope, C. A.; Dockery, D.; J. Air Waste Manage. Assoc.2006,
56, 709.
11. Pope, C. A.; Ezzati, M.; Dockery, D. W.; New Engl. J. Med.
2009, 360, 376.
12. Ayres, J. G.; Borm, P.; Cassee, F. R.; Castranova, V.; Donaldson, K.; Ghio, K.; Harrison, R. M.; Hider, R.; Kelly, F.; Kooter, I. M.; Inhal. Toxicol.2008, 20, 75.
13. Tzamkiozis, T.; Ntziachristos, L.; Mamakos, A.; Fontaras, G.; Samaras, Z.; Aerosol Sci. Technol.2011, 45, 587.
14. Klot, S. V.; Wölke, G.; Tuch, T.; Heinrich. J.; Dockery, D. W.; Schwartz, J.; Kreyling, W. G.; Wichman, H. E.; Peters, A.; Eur. Respir. J. 2002, 20, 69.
15. Fanning, E. W.; Froines, J. R.; Utell, M. J.; Lippmann, M.; Oberdörster, G.; Frampton, M.; Godleski, J.; Larson, T. V.;
Environ. Health Persp.2009, 117, 167.
16. Savic, N.; Rahman, M. M.; Miljevic, B.; Saathoff, H.; Naumann, K. H.; Leisner, T.; Riches, J.; Gupta, B.; Motta, N.; Ristovski, Z. D.; Carbon2016, 104, 179.
17. Eggersdorfer, M. L.; Kadau, D.; Herrmann, H. J.; Pratsinis, S. E.; J. Aerosol Sci.2012, 46, 7.
18. Chen, N.; Song, C.; Lv, G.; Song, J.; Gao, J.; Zhang, Z.;
Combust. Flame2015, 162, 4649.
19. Park, K.; Kittelson, D. B.; McMurry, P. H.; Aerosol Sci. Technol.
2004, 38, 881.
20. China, S.; Salvatori, N.; Mazzoleni, C.; Environ. Sci. Technol.
2014, 48, 3128.
21. Chung, A.; Lall, A. A.; Paulson, S. E.; Atmos. Environ.2008,
42, 2129.
22. Neer, A.; Koylu, U. O.; Combust. Flame2006, 146, 142. 23. Ajtai, T.; Pinter, M.; Utry, N.; Kiss-Albert, G.; Gulyas, G.;
Pusztai, P.; Puskas, R.; Bereczky, A.; Szabados, Gy.; Szabo, G.; Konya, Z.; Bozoki, Z.; Atmos. Environ. 2016, 134, 109. 24. Barone, T. L.; Zhu, Y.; Atmos. Environ. 2008, 42, 6749. 25. Xiong, C.; Friedlander, S. K.; Proc. Natl. Acad. Sci. USA2001,
98, 11851.
26. Salamanca, M.; Mondragon, F.; Agudelo, J. R.; Benjumea, P.; Santamaria, A.; Combust. Flame2012, 159, 1100.
27. Karavalakis, G.; Stournas, S.; Bakeas, E.; Atmos. Environ. 2009,
43, 1745.
28. Ballesteros, R.; Hérnandez, J. J.; Lyons, L. L.; Atmos. Environ.
2010, 44, 930.
29. Lapuerta, M.; Martos, F. J.; Herreros, J. M.; J. Aerosol Sci.
2007, 38, 455.
30. Agarwal, A. K.; Gupta, T.; Kothari, A.; Renewable Sustainable Energy Rev.2011, 15, 3278.
31. Traviss, N.; Li, M.; Lombard, M.; Thelen, B. A.; Palmer, B. C.; Poynter, M. E.; Mossman, B. T.; Holmen, B. A.; Fugakawa, B. T.; Air .Qual. Atmos. Health2014, 7, 59.
32. Betha, R.; Balabramanian, R.; Engling, G. In Biodiesel - Feedstocks, Production and Applications; Fang, Z., ed.; Intech, 2013, ch. 17, DOI: 10.5772/53476.
33. Guarieiro, L. L. N.; Pereira, P. A. D.; Torres, E. A.; da Rocha, G. O.; de Andrade, J. B.; Atmos. Environ.2008, 42, 8211. 34. Guarieiro, L. L. N.; de Souza, A. F.; Torres, E. A.; de Andrade,
J. B.; Atmos. Environ. 2009, 43, 2754.
36. Kim, J.; Jang, J.; Lee, K.; Lee, S.; Oh, S.; Int. J. Automot. Technol. 2014, 15, 183.
37. Birch, M. E.; Cary, R. A.; Aerosol Sci. Technol.1996, 25, 221. 38. Brasil, A. M.; Farias, T. L.; Carvalho, M. G.; J. Aerosol Sci.
1999, 30, 1379.
39. Wosniak, M.; Onofri, F. R. A.; Barbosa, S.; Yon, J.; Mroczka, J.; J. Aerosol Sci.2012, 47, 12.
40. Brasil, A. M.; Farias, T. L.; Carvalho, M. G.; Koylu, U. O.;
Aerosol Sci.2001, 32, 489.
41. Koylu, U. O.; McEnally, C. S.; Rosner, D. E.; Pfefferle, L. D.;
Combust. Flame1997, 110, 494. 42. Schaefer, D. W.; MRS Bull.1988, 13, 22.
43. Peng, C.-Y.; Lan, C.-H.; Dai, Y. T.; Chemosphere 2006, 65, 2054.
44. Mkoma, S. L.; da Rocha, G. O.; Regis, A. C. D.; Domingos, J. S. S.; Santos, J. V. S.; de Andrade, S. J.; Carvalho, L. S.; de Andrade, J. B.; Fuel 2014, 115, 109.
45. da Silva, T. O.; Pereira, P. A. P.; J. Agric. Food Chem. 2008, 56, 3129.
46. Jung, Y.; Bae, C.; Fuel2015, 161, 312.
47. Seong, H.; Lee, K.; Choi, S.; Adams, C.; Foster, D.; SAE Tech. Pap. Ser. 2012,No. 2012-01-0441.
48. Lu, T.; Cheung, C. S.; Huang, Z.; J. Aerosol Sci. 2012, 47, 27. 49. Chandler, M. F.; Teng, Y.; Koylu, U. O.; Proc. Combust. Inst.
2007, 31, 2971.
50. Lee, K. O.; Cole, R.; Sekar, R.; Choi, M. Y.; Kang, J. S.; Ba, C. S.; Shin, H. D.; Proc. Combust. Inst.2002, 29, 647. 51. Lee, K.; Zhu, J.; Ciatti, S.; Yozgatligil, A.; Choi, M. Y.; SAE
Tech. Pap. Ser. 2003, No. 2003-01-3169.