Article
Printed in Brazil - ©2017 Sociedade Brasileira de Química0103 - 5053 $6.00+0.00
*e-mail: [email protected]
Non-Synergistic UV-A Photocatalytic Degradation of Estrogens by Nano-TiO
2Supported on Activated Carbon
Suzamar M. C. Rosa, Arlene B. S. Nossol, Edson Nossol, Aldo J. G. Zarbin and Patricio G. Peralta-Zamora*
Departamento de Química, Universidade Federal do Paraná, CP 19032, 81531-980 Curitiba-PR, Brazil
Many studies have reported significant improvements in the photocatalytic degradation capacity of TiO2 immobilized in carbonaceous materials, mainly due to a well-characterized synergistic
effect. The photocatalytic degradation of the estrogens 17β-estradiol and 17α-ethynylestradiol was evaluated using 1 mg L-1 aqueous solutions, employing a nanocomposite containing TiO
2
and activated carbon (TiO2-AC) prepared by sol-gel technique. The synthesized materials were
characterized by thermogravimetric analysis (TGA), X-ray diffraction (XRD), Raman spectroscopy and scanning electron microscopy (SEM). These techniques allowed to estimate the carbon proportion (11.4 wt.%), the phase composition (anatase: 80.2%, brookite: 14.0%, and rutile: 5.8%) and the superficial morphology. Using UV-A radiation provided by a high pressure mercury vapor lamp (125 W) and the synthesized photocatalysts, it was observed the almost complete removal of both estrogens in times shorterthan 10 minutes. Considering the similarity between the degradation percentage of nanocomposites (TiO2 and TiO2-AC), no synergistic effects between AC and TiO2
could be assumed.
Keywords: titanium dioxide/activated carbon, nanocomposite, photocatalysis, estrogens
Introduction
Over the last two decades, many studies have demonstrated the high degradation capacity of advanced
oxidation processes (AOPs). In general, homogeneous1
and heterogeneous systems2 promote fast degradation
of resistant substrates, mainly due to the high oxidizing
capacity of the in situ generated hydroxyl radical.3
In the context of the AOPs, heterogeneous photocatalysis occupies a prominent place, particularly when assisted by
titanium dioxide.4 Many recalcitrant organic pollutants have
been efficiently degraded by TiO2-photocatalysis, including
azo dyes,5 pharmaceuticals6 and estrogens.7 Typically,
the process is applied as slurry systems, consisting in
a suspension of fine powdered TiO2. Because of these
characteristics, the separation of the catalyst is expensive and time demanding, which often causes a significant reduction in the benefits of the usual mineralization of the
organic substrates.8
To overcome this negative aspect, the use of immobilized
photocatalysts has been proposed since 1993.8 Many
chemical and physical methods have been employed to
prepare TiO2 coatings on various supports, such as glass,9
silica,10 zeolite,11 among other materials. The sol-gel method
and the subsequent thermal treatment usually leads to
highly crystalline anatase TiO2,12 proving to be a simple
and reliable alternative for preparation of mechanically
stable TiO2 films.13
Combinations between TiO2 and carbonaceous materials
have been widely explored since the 1990s, with results that demonstrate significant synergistic effects that increase
the catalytic activity.14 In this context, the use of activated
carbon (AC) is particularly attractive, because of providing a high surface area for distribution and immobilization of
TiO2.14 According to the current literature, the synergistically
enhanced photocatalytic activity observed with the use
of TiO2-AC composites may be explained by the high
adsorption capacity of AC and by the consequent enrichment
of target molecules around the catalyst.14-17 Although the
positive effect of AC on the photocatalytic efficiency of
TiO2 is observed with simple mechanical mixtures,18 it is
admitted that the synergetic effect can be maximized by a more intimate contact between the components, which can
In general, it was observed that several studies address on the photocatalytic degradation of emerging contaminants, which represent a wide range of compounds produced naturally or synthetically (i.e., steroid hormones, pesticides,
personal care products).19 Moreover, there are few reports
about the degradation of estrogens employing TiO2-AC.
Natural (estrone-E1, 17β-estradiol-E2 and estriol-E3)
and synthetic (17α-ethynylestradiol-EE2) hormones are
the most commonly steroid hormones found in aquatic ecosystems, mainly because of incomplete removal during
wastewater treatment processes.20 Consequently, the
proposal of new treatment technologies appears relevant to remove estrogens from sewage treatment plants effluents and to avoid the potential risks caused by their presence in aquatic environments.
Therefore, the aim of the present work was to investigate the photocatalytic degradation of natural
(17β-estradiol-E2) and synthetic (17α
-ethynylestradiol-EE2) estrogens in aqueous solution in presence of catalyst
Degussa P25 (commercial TiO2), sol-gel TiO2 or AC-TiO2
composite (20% activated carbon).
Experimental
Chemicals
Commercial nanosized titanium dioxide powder,
TiO2-P25(80 wt.% anatase/20 wt.% rutile by X-ray
diffraction, BET surface area of 50 m2 g-1), was purchased
from Degussa-Hüls AG. Activated carbon (AC) with 1-2 mm of diameter, large pore size distribution and
specific surface area of approximately 800 m2 g-1, was
obtained from BRASILAC and previously sieved between 50 and 390 mesh. The organic solvents, methanol
(CH3OH, JT Baker) and acetonitrile (C2H3N, Panreac)
were of HPLC grade.
Stock solutions (1,000 mg L-1) of the model
substrates (17β-estradiol-E2, Sigma-Aldrich, 98%, and
17α-ethynylestradiol-EE2, Sigma-Aldrich, 99%) were
prepared in acetonitrile. Working samples (1 mg L-1) were
prepared in ultrapure water (Millipore system, resistivity
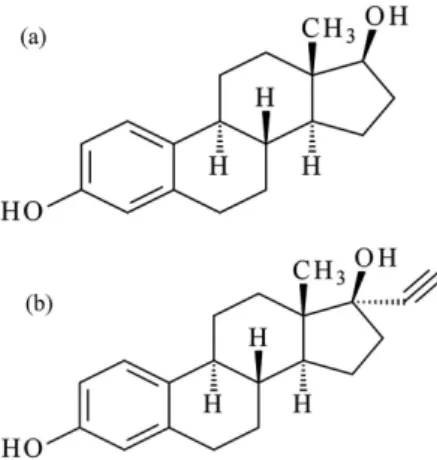
of 18 MΩ cm). The chemical structure of the estrogens is
shown in Figure 1.
Sodium hydroxide (0.1 mol L-1, Biotec) and
hydrochloric acid (0.1 mol L-1, Qhemis) were used to
adjust the pH. Micro glass fiber filters (Macherey-Nagel) of 0.6 µm pore size were used to remove remaining particles from the solutions of estrogens. The other
reagents such as titanium isopropoxide, Ti[OCH(CH3)2]4,
(Acros Organics) and 2-propanol (Panreac) were of analytical grade.
Synthesis of nanomaterials
TiO2 nanoparticles were prepared at ambient temperature
by the sol-gel method, according to procedures adapted from
Oliveira et al.21 (Figure S1). Step 1: in a glovebox (under
argon atmosphere) a mixture containing 20 mL of titanium isopropoxide and 20 mL of 2-propanol was added dropwise
to a solution containing HCl (120 mL, 0.2 mol L-1). Step 2:
to obtain the gel, the precipitate of the first step was kept on reflux system at 60 °C during 8 h. To obtain a dry gel, the 2-propanol and water were evaporated at 80 °C. The material
obtained was denominated sol-gel TiO2.
The TiO2-AC nanocomposite was obtained in a similar
way, adding a weighed amount of AC (20% of the expected
mass of TiO2) before the formation of the precipitate (step 1,
Figure S1).
Characterization techniques
Powder X-ray diffraction patterns were recorded on
a Shimadzu XRD-6000 apparatus, with Cu Kα radiation
(λ = 1.5418 Å) at 40 kV and 30 mA. The XRD patterns
were collected over the 2θrange 10°-80°, at a scan rate
of 2° min-1.The mean crystallite size (d) was estimated
based on the Scherrer’s equation.22 The materials phase
composition ratio was calculated using the equations
proposed by Zhang and Banfield.23
Raman spectra were recorded on a Renishaw
Raman-Image spectrophotometer. A He-Nelaser (λ = 514.5 nm)
was used with 2 mW incidence potency over the
200-3000 cm−1 region. The relative intensities of bands D
and G (ID/IG) were calculated according to Wang et al.24
The morphology and structure of the samples were verified by scanning electron microscopy using a Mira FEG-SEM (TESCAN) equipped with an energy dispersive spectrometer (EDS).
The composition of the samples was investigated by thermogravimetric analysis (TGA) and differential scanning calorimetry (DSC), carried out on a SDT Q600 analyzer. The characterization was realized from room temperature
to 1,000 °C at a heating rate of 10 °C min−1 under synthetic
air atmosphere (White Martins).
Degradation studies
The photocatalytic degradation of the substrates was carried out in a jacketed glass cylindrical photoreactor (height: 17 cm, internal diameter: 5.5 cm, useful volume: 200 mL), equipped with magnetic stirring and continuous refrigeration by water (temperature: 25 ± 2 °C). The UV-A radiation was provided by a 125 W low pressure mercury vapor lamp (NARDS), without the original glass bulb,
immersed in the solution with the protection of a Pyrex®
glass jacket. Under these conditions, the measured UV-A
(320-400 nm) photon flux was 9.7 × 10⁻⁵ Einstein s-1
(uranyl-oxalate actinometry).
The solution containing an EE2/E2 mixture (200 mL,
1 mg L-1) was placed in the reactor and irradiated up
to 10 min, using photocatalyst mass and working pH previously optimized by factorial design. The pH of the samples was adjusted with aqueous solutions of HCl and NaOH. Aliquots were collected at intervals of 2 min, filtered through a micro glass fiber filter (0.6 µm) to remove solid material and submitted to analytical control.
Analysis
The degradation of E2 and EE2 was monitored by high performance liquid chromatography with diode array detection (HPLC-DAD, 197 nm), using a Varian 920 LC equipment. Routine determinations were carried out on a Varian Microsorb-MV100-5 C18 column (250 × 4.6 mm, 5 µm), using a Metaguard pursuit 5 µm C-18 (4.6 mm) pre-column. The mobile phase was constituted of acetonitrile:water (50:50 v/v, isocratic mode) and used
at a flow rate of 0.8 mL min−1. Analytical curves were
established between 0.1 and 1 mg L-1 (n = 10, R2 > 0.99).25
Results and Discussion
The synthesized nanocomposite (TiO2-AC) and the raw
materials (sol-gel TiO2 and AC) were firstly characterized
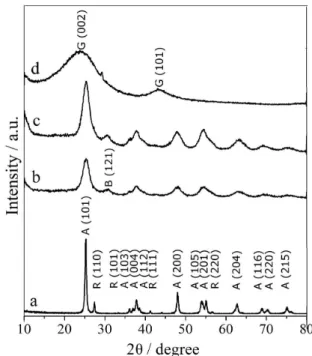
by XRD (Figure 2). As a reference, Degussa P25 TiO2
(Figure 2a) was also characterized, showing a sharper
and stronger peak at 2θ= 25.3 corresponding to the (101)
plane of the anatase structure of titania. Other less intense
anatase peaks were observed at 2θ values of 36.8 (103),
37.8 (004), 38.5 (112), 48.0 (200), 54.0 (105), 55.2 (211), 62.6 (204), 68.8 (116), 70.2 (220) and 75.0 (215). Lower intensity peaks at 27.4 (110), 35.9 (101), 41.2 (111) and
56.5 (220) were assigned to the rutile phase.26
In general, it is accepted that pure anatase phase is
more catalytically active than rutile.27,28 Nevertheless, it is
also recognized that anatase/rutile mixtures, as observed
in Degussa P25-TiO2, shows synergistic effects, which
enhances the photocatalytic activity, due to the reduction
of the electron/hole recombination.29,30
In the X-ray diffraction patterns of sol-gel TiO2
(Figure 2b) and TiO2-AC nanocomposite (Figure 2c)
anatase appears as a dominant phase (71.9% for sol-gel
TiO2 and 80.2% for TiO2-AC). The small signal at
2θ = 30.5 (121) was assigned to brookite (16.4% for
sol-gel TiO2 and 14.0% for TiO2-AC) while less intense
rutile peaks were observed at 2θ values of 27.4 (11.7%
for sol-gel TiO2 and 5.8% for TiO2-AC). A preliminary
interpretation about the effect caused by the presence of brookite is a very difficult task, due to the existence of
reports about its low photochemical activity,31 its “superior
photoactivity”32 and the synergistic effect of anatase/
brookite mixtures.33 Recently, Di Paola et al.32 published a
review about the “least known” brookite phase. According to these authors, the use of pure brookite in heterogeneous photocatalysis is not justifiable, by reason of the laborious preparation methods. In contrast, the use of mixtures of brookite with anatase and/or rutile proves to be interesting, due to a synergetic effect that hinders the electron/hole
Figure 2. XRD pattern of (a) TiO2-P25; (b) sol-gel TiO2; (c) TiO2-AC
pair combination and improves the overall efficiency of the photochemical process.
Furthermore, broad peaks suggest smaller particle
size for sol-gel TiO2 and TiO2-AC nanocomposite, with
typical anatase crystallite size of approximately 10 nm
(based on the Scherrer’s equation).22 Since photocatalysis
is essentially a surface phenomenon, the overall efficiency of the process tends to be significantly influenced by
the particle size of the photocatalyst.34 Consequently, it
is expected that the synthesized materials shows higher photocatalytic performance than the commercial Degussa
P25 TiO2 (crystallite size around 40 nm), even with a less
favorable crystalline phase ratio.
The X-ray diffraction patterns of AC (Figure 2d)
shows two broad peaks at 2θ=23.8 and 43.2, which can
be assigned to the characteristic (002) and (101) planes. The Raman spectra presented on Figure 3 confirms the XRD data, demonstrating the presence of anatase (A), brookite (B) and rutile (R) in the synthesized materials.
The AC and TiO2-AC spectra is characteristic of disordered
carbon, showing two bands centered at approximately 1,600
(G) and 1,340 cm-1 (D).
The ID/IG ratio is often used to evaluate the disorder
of carbon materials,35 where I
D represents the intensity of
the D band (which is associated with the disorder) due to the breathing carbon bonded modes that require a defect
for its activation, and IG represents the intensity of the
high frequency E2g phonon at the Brillouin zone center
(G band), which is characteristic of sp2 carbon.36,37 The
raw AC shows an estimated ID/IG of 2.1, which corresponds
to substantially disordered carbon. Besides, the presence
of TiO2 in the nanocomposite increased the estimated
value of this ratio (2.9), which suggests the introduction of significant changes in the structure of the starting material and, consequently, an intimate contact between the photocatalyst and the carbonaceous matrix.
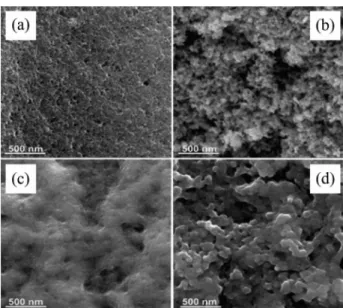
The superficial morphology of AC, TiO2-P25, sol-gel
TiO2 and TiO2-AC powders was evaluated by scanning
electron microscopy (SEM), and the results are shown in Figure 4. In the SEM images of activated carbon (AC) it is observed a typical porous and rough surface, while
TiO2-P25 images show aggregates of spherical-shaped
particles, similar to the observed by Jo and Kang.38 The
images of the sol-gel TiO2 also show particle agglomeration,
however, with irregular distribution and smaller dimensions than the commercial product. Finally, the SEM image of the
TiO2-AC nanocomposite shows agglomerates of titanium
dioxide nanoparticles covering the whole surface of the carbonaceous matrix.
The carbon mass in the synthesized nanocomposite was estimated by thermogravimetric analysis (TGA). As
shown in Figure 5, when the TiO2-AC is heated from the
room temperature to 1,000 °C in an air flow, the TG curve shows three-step of weight loss. The first thermal event appears between 23-154 °C with a weight loss of 9.1 wt.%, probably due to the endothermic removal of physically and
chemically adsorbed water from the TiO2 nanoparticles.39,40
In the second step, a weight loss of 6.5 wt.% at the temperature range of 154-419 °C may be associated with the decomposition of amorphous carbon layers and loss of
hydroxyl groups on the TiO2 nanocrystal,40,41 and the final
weight loss from 419 to 616 °C (3.9 wt.%) refers to an exothermic process and can be attributed to the combustion
of carbon39 and to the anatase to rutile phase transition.42
Figure 3. Raman spectra of (a) TiO2-P25; (b) sol-gel TiO2; (c) TiO2-AC
and (d) raw AC.
Figure 4. SEM images of (a) AC; (b) TiO2-P25; (c) sol-gel TiO2; (d)
In the thermal characterization of AC, an exothermic event was observed between 352 and 583 °C, with a high weight loss, approximately 80% (Figure S2), assigned to
the combustion of carbonaceous material.The TGA/DTG
(derivative thermogravimetry) of nano TiO2 is shown in
Figure S3.
Based on the previously exposed results, the carbon content on the synthesized nanocomposite was estimated in 11.4 wt.%.
Photocatalytic activity
Initially, the effects of two relevant operational variables (pH and catalyst concentration) were evaluated
by a factorial design (22), using TiO
2 Degussa P25 as a
model photocatalyst, a mixture of E2 and EE2 (1 mg L-1)
as substrate and photocatalytic processes assisted by artificial UV-A radiation (i.e., mercury vapor lamp). In this study (Table S1, Supplementary Information), higher degradation efficiency was observed at pH 6 using
250 mg L-1 of photocatalyst, condition employed in all
subsequent studies.
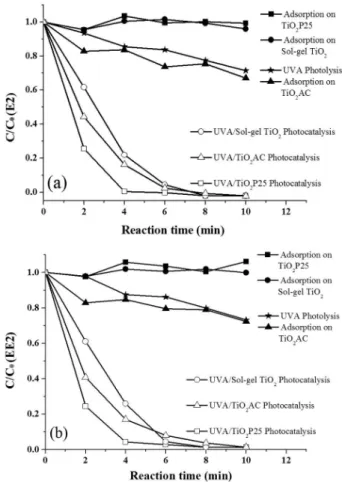
Under these conditions, the UV-A photolytic degradation of both estrogens was similar, reaching values of about 30% in exposure times of 10 min (Figure 6). Although many studies show a significant degradation of estrogens
by direct photolysis,43 it is admitted that their contribution
in photocatalytic processes is less relevant. Furthermore, many studies report the photolytic formation of reaction intermediates that can exhibit greater toxicity than the
starting compounds.44
The adsorption capacity shown by TiO2-P25 and the
synthesized TiO2 nanoparticles was quite similar, allowing
removals lower than 5% for both estrogens. This result is consistent with the low porosity of these materials, as
highlighted by García-Muñoz et al.45 As expected, the
adsorption capacity shown by the TiO2-AC nanocomposite
waslarger (removal near 30% in contact time of 10 min),
due to the characteristic high porosity and surface area of the carbonaceous materials.
In photocatalytic processes the degradation efficiency
of TiO2-P25 was superior, allowing almost complete
removal of both estrogens in treatments of 4 min. The
linear correlation between ln (C/C0) and t (ln C/C0 = kappt t,
where C0 represents the initial concentration and C represents
the concentration at a particular time, t) indicates that the photocatalytic degradation follows a pseudo first-order
kinetics, with apparent rate constants (kapp) of approximately
1 min-1. In the presence of TiO
2 nanoparticles the degradation
process was slower (kapp ca. 0.5 min-1), requiring treatment
times of 8 min to complete estrogen’s removal.
The superiority of the commercial TiO2-P25, even with
smaller surface area, demonstrates that the photocatalytic activity is not only dependent on the particle size, being governed by other important characteristics, such as
availability of active sites.46 A complementary explanation
for the higher photocatalytic activity of TiO2-P25 is based
on the composition of crystalline phases. The commercial product consists in a mixture of anatase (80%) and rutile
Figure 5. TGA, DTG and DSC profiles of the TiO2-AC nanocomposite.
(20%), with a recognized synergistic effect,47,48 while the
synthesized TiO2 nanoparticles comprise a mixture of
anatase (71.9%), brookite (16.4%) and rutile (11.7%), with lower photochemical activity.
The AC presence in the nanocomposite containing TiO2
nanoparticles causes a slight increase in the degradation
capacity of the photocatalytic process (kapp ca. 0.6 min-1).
However, due to the higher adsorption capacity introduced by AC, this effect cannot be considered as synergistic.
This result disagrees with many reports that describe an important synergistic effect between these
components.8,14,45,49,50 Although there is a consensus on this
synergistic effect, assuming that the presence of AC favors the approximation between substrate and photocatalyst, there are additional arguments that suggest a much more
complex effect. According to Cordero et al.51 the differences
in the photoactivity of TiO2 depends on the physicochemical
properties of activated carbons, particularly the existence of active sites on their surface. In studies involving the degradation of 4-chlorophenol it was observed that L-type AC can induce beneficial or unfavorable effects on
the TiO2 activity, depending on the presence of organic
functional groups (i.e., carboxylic acid groups) that can
transfer electronic density to the TiO2, thus inhibiting the
recombination process.
According to observations carried out by Asenjo et al.52
the apparent synergy between the activated carbon and
TiO2 particles, claimed by several authors, is resulting from
an incorrect use of the first-order form of the Langmuir-Hinshelwood (LH) equation. In studies involving the photocatalytic degradation of phenol, the authors showed that the use of the extended form of the LH equation demonstrates that the synergy is only apparent.
Finally, it is important to remark that many studies do not show adequate experimental controls in order to verify, for instance, the contribution of concomitant processes such as photolysis and adsorption. Furthermore, some studies
compare the photocatalytic efficiency of TiO2/AC and pure
TiO2 using the same mass of TiO2, while others may use
the same overall mass.14
Conclusions
Sol-gel TiO2 and TiO2-AC nanocomposite were
prepared by sol-gel methods. Both materials showed high degradation efficiency of E2 and EE2 estrogens, allowing removal greater than 90% at reaction times of
6 min. Commercial TiO2-P25 showed higher degradation
efficiency than the synthesized sol-gel TiO2, probably
because of its more favorable anatase/rutile ratio. Under the conditions of this study, no synergistic effect was observed.
Supplementary Information
Supplementary data are available free of charge at http://jbcs.sbq.org.br as PDF file.
Acknowledgments
Financial support from CNPq, CAPES, NENNAM (Pronex F. Araucária/CNPq) and Fundação Araucária is gratefully acknowledged.
References
1. Babuponnusami, A.; Muthukumar, K.; J. Environ. Chem. Eng. 2014, 2, 557.
2. Fujishima, A.; Zhang, X.; Tryk, D. A.; Int. J. Hydrogen Energy 2007, 32, 2664.
3. Loaiza-Ambuludi, S.; Panizza, M.; Oturan, N.; Oturan, M. A.; Catal. Today2014, 224, 29.
4. Nakata, K.; Fujishima, A.; J. Photochem. Photobiol., C 2012, 13, 169.
5. Bianchi, C. L.; Colombo, E.; Gatto, S.; Stucchi, M.; Cerrato, G.; Morandi, S.; Capucci, V.; J. Photochem. Photobiol., A 2014, 280, 27.
6. De la Cruz, N.; Dantas, R. F.; Giménez, J.; Esplugas, S.; Appl. Catal., B2013, 130-131, 249.
7. Coleman, H. M.; Abdullah, M. I.; Eggins, B. R.; Palmer, F. L.; Appl. Catal., B 2005, 55, 23.
8. Shan, A. Y.; Ghazi, T. I. M.; Rashid, S. A.; Appl. Catal., A 2010, 389, 1.
9. Shen, C.; Wang, Y. J.; Xu, J. H.; Luo, G. S.; Chem. Eng. J.2012, 209, 478.
10. Nakano, R.; Chand, R.; Obuchi, E.; Katoh, K.; Nakano, K.; Chem. Eng. J.2011, 260, 176.
11. Amereh, E.; Afshar, S.; Mater. Chem. Phys.2010, 120, 356. 12. Hu, C.; Duo, S.; Liu, T.; Xiang, J.; Li, M.; Appl. Surf. Sci.2011,
257, 3697.
13. Panniello, A.; Curri, M. L.; Diso, D.; Licciulli, A.; Locaputo, V.; Agostiano, A.; Comparelli, R.; Mascolo, G.; Appl. Catal., B2012, 190, 122.
14. Leary, R.; Westwood, A.; Carbon 2011, 49, 741.
15. Gao, B.; Yap, P. S.; Lim, T. M.; Lim, T. T.; Chem. Eng. J.2011, 171, 1098.
16. Ravichandran, L.; Selvam, K.; Swaminathan, M.; J. Mol. Catal. A: Chem.2010, 317, 89.
17. Gu, L.; Chen, Z.; Sun, C.; Wei, B.; Yu, X.; Desalination 2010, 263, 107.
18. Silva, C. G.; Wang, W.; Faria, J. L.; J. Photochem. Photobiol., A2006, 181, 314.
20. Silva, C. P.; Otero, M.; Esteves, V.; Environ. Pollut. 2012, 38, 165.
21. Oliveira, M. M.; Schnitzler, D. C.; Zarbin, A. J. G.; Chem. Mater.2003, 15, 1903.
22. Mandal, S. S.; Bhattacharyya, A. J.; Talanta 2010, 82, 876. 23. Zhang, H.; Banfield, J. F.; J. Phys. Chem. B2000, 104, 3481. 24. Wang, Z.; Lu, Z.; Huang, Y.; Xue, R.; Huang, X.; Chen, L.; J.
Appl. Phys. 1997, 82, 5705.
25. Marinho, B. A.; de Liz, M. V.; Lopes Tiburtius, E. R.; Nagata, N.; Peralta-Zamora, P.; Photochem. Photobiol. Sci.2013, 12, 678.
26. Venkatachalam, S.; Hayashi, H.; Ebina, T.; Nanjo, H.; Optoelectronics - Advanced Materials and Devices; Pyshkin, S., ed.; InTech: Rijeka, 2013, ch. 5.
27. Aruldoss, U.; Kennedy, L. J.; Judith Vijaya, J.; Sekaran, G.; J. Colloid Interface Sci. 2011, 355, 204.
28. Hofer, M.; Penner, D.; J. Eur. Ceram. Soc. 2011, 31, 2887. 29. van der Meulen, T.; Mattson, A.; Österlund, L.; J. Catal.2007,
251, 131.
30. Liao, J.; Luo, R.; Li, Y. B.; Zhang, J.; Mater. Sci. Semicond. Process.2013, 16, 2032.
31. Zhang, J.; Yan, S.; Fu, L.; Wang, F.; Yuan, M.; Luo, G.; Xu, Q.; Wang, X.; Li, C.; Chin. J. Catal. 2011, 32, 983.
32. Di Paola, A.; Bellardita, M.; Palmisano, L.; Catalyst 2013, 3, 36.
33. Yu, J. C.; Zhang, L.; Yu, J.; Chem. Mater.2002, 14, 4647. 34. Alzamani, M.; Shokuhfar, A.; Eghdam, E.; Mastali, S.; Prog.
Nat. Sci. 2013, 23, 77.
35. Tai, F. C.; Lee, S. C.; Wei, C. H.; Tyan, S. L.; Mater. Trans. 2006, 47, 1847.
36. Cançado, L. G.; Jorio, A.; Ferreira, E. H. M.; Stavale, F.;
Achete, C. A.; Capaz, R. B.; Moutinho, M. V. O.; Lombardo, A.; Kulmala, T. S.; Ferrari, A. C.; Nano Lett. 2011, 11, 3190. 37. Ferrari, A. C.; Basko, D. M.; Nat. Nanotechnol.2013, 8, 235. 38. Jo, W.-K.; Kang, H.-J.; Mater. Chem. Phys. 2013, 143, 247. 39. Gundogdu, A.; Duran, C.; Senturk, H. B.; Soylak, M.;
Imamoglu, M.; Onal, Y.; J. Anal. Appl. Pyrolysis2013, 104, 249.
40. Xia, T.; Zhang, W.; Wang, Z.; Zhang, Y.; Song, X.; Murowchick, J.; Battaglia, V.; Liu, G.; Chen, X.; Nano Energy2014, 6, 109. 41. Hu, Y.; Tsai, H. L.; Huang, C. L.; J. Eur. Ceram. Soc. 2003, 23,
691.
42. Liu, X.; Powder Technol.2012, 224, 287.
43. Li Puma, G.; Puddu, V.; Tsang, H. K.; Gora, A.; Toepfer, B.; Appl. Catal., B 2010, 99, 388.
44. Chowdhury, R. R.; Charpentier, P. A.; Ray, M. B.; J. Photochem. Photobiol., A 2011, 219, 67.
45. García-Munõz, P.; Carbajo, J.; Faraldos, M.; Bahamonde, A.; J. Photochem. Photobiol., A 2014, 287, 8.
46. Carp, O.; Huisman, C. L.; Reller, A.; Prog. Solid State Chem. 2004, 32, 33.
47. Tian, G.; Fu, H.; Jing, L.; Tian, C.; J. Hazard. Mater.2009, 161, 1122.
48. Li, G.; Gray, K. A.; Chem. Phys.2007, 339, 173.
49. Rivera-Utrilla, J.; Sánchez-Polo, M.; Abdel daiem, M. M.; Ocampo-Pérez, R.; Appl. Catal., B 2012, 126, 100.
50. Kavitha, R.; Devi, L. G.; J. Environ. Chem. Eng.2014, 2, 857. 51. Cordero, T.; Duchamp, C.; Chovelon, J. M.; Ferronato, C.;
Matos, J.; J. Photochem. Photobiol., A 2007, 191, 122. 52. Asenjo, N. G.; Santamaría, R.; Blanco, C.; Granda, M.; Álvarez,
P.; Menéndez, R.; Carbon 2013, 55, 62.
Submitted: March 16, 2016