Radiol Bras. 2016 Mai/Jun;49(3):137–143 137
Predictive performance of BI-RADS magnetic resonance imaging
descriptors in the context of suspicious (category 4) findings
*
Desempenho preditivo dos descritores de ressonância magnética do BI-RADS no contexto de achados suspeitos (categoria 4)
Almeida JRM, Gomes AB, Barros TP, Fahel PE, Rocha MS. Predictive performance of BI-RADS magnetic resonance imaging descriptors in the context of suspicious (category 4) findings. Radiol Bras. 2016 Mai/Jun;49(3):137–143.
Abstract
R e s u m o
Objective: To determine the positive predictive value (PPV) and likelihood ratio for magnetic resonance imaging (MRI) characteristics of category 4 lesions, as described in the Breast Imaging Reporting and Data System (BI-RADS®
) lexicon, as well as to test the predictive performance of the descriptors using multivariate analysis and the area under the curve derived from a receiver operating characteristic (ROC) curve.
Materials and Methods: This was a double-blind review study of 121 suspicious findings from 98 women examined between 2009 and 2013. The terminology was based on the 2013 edition of the BI-RADS.
Results: Of the 121 suspicious findings, 53 (43.8%) were proven to be malignant lesions, with no significant difference between mass and non-mass enhancement (p = 0.846). The PPVs were highest for masses with a spiculated margin (71%) and round shape (63%), whereas segmental distribution achieved a high PPV (80%) for non-mass enhancement. Kinetic analyses performed poorly, except for type 3 curves applied to masses (PPV of 73%). Logistic regression models were significant for both patterns, although the results were better for masses, particularly when kinetic assessments were included (p = 0.015; pseudo R2 = 0.48; area under the curve = 90%).
Conclusion: Some BI-RADS MRI descriptors have high PPV and good predictive performance—as demonstrated by ROC curve and multivariate analysis—when applied to BI-RADS category 4 findings. This may allow future stratification of this category.
Keywords: Magnetic resonance imaging; Breast neoplasms; Predictive value of tests; Likelihood functions.
Objetivo: Determinar o valor preditivo positivo (VPP) e a razão de verossimilhança positiva de características de ressonância magnética (RM) de lesões da categoria 4, como descritas no léxico do Breast Imaging Reporting and Data System (BI-RADS®
), e testar o desempenho preditivo dos descritores por meio de análise multivariada e área sob a curva derivada da curva receiver operating characteristic (ROC).
Materiais e Métodos: Foi realizado um estudo revisional duplo-cego de 121 achados suspeitos em 98 mulheres examinadas entre 2009 e 2013. A terminologia foi baseada na edição de 2013 do BI-RADS.
Resultados: Dos 121 achados suspeitos, 53 (43,8%) eram de fato lesões malignas, sem diferença significativa entre nódulos e realce não nodular (p = 0,846). Nódulos com margem espiculada (71%) e forma redonda (63%) apresentaram os maiores VPPs, ao passo que a distribuição segmentar teve alto VPP para realce não nodular (80%). Apenas a curva cinética do tipo 3 teve bom desempenho quando aplicada a nódulos (VPP = 73%). Modelos de regressão logística foram significantes para os dois padrões principais, embora os nódulos tenham apresentado resultados melhores, particularmente com a introdução da análise cinética (p = 0,015; pseudo-R2 = 0,48; área sob a curva = 90%).
Conclusão: Alguns descritores de RM do BI-RADS têm alto VPP e bom desempenho preditivo – demonstrado por curva ROC e análise multivariada – quando aplicados a achados da categoria 4 segundo o BI-RADS. Isso pode permitir futura estratificação dessa categoria.
Unitermos: Ressonância magnética; Neoplasias da mama; Valor preditivo dos testes; Funções de verossimilhança.
* Study conducted at the Clínica de Assistência à Mulher (CAM), Salvador, BA, Brazil.
1. PhD, Physician, Department of Diagnostic Imaging, Clínica de Assistência à Mulher (CAM), Salvador, BA, Brazil.
2. Physician, Department of Diagnostic Imaging, Clínica de Assistência à Mulher (CAM), Salvador, BA, Brazil.
3. Professor, Biomedical Scientist, Escola Bahiana de Medicina e Saúde Pública, Salvador, BA, Brazil.
4. Physician, Department of Pathology, Clínica de Assistência à Mulher (CAM), Salvador, BA, Brazil.
5. PhD, Assistant Professor of Medicine, Escola Bahiana de Medicina e Saúde Pública, Salvador, BA, Brazil.
Mailing address: Dr. João Ricardo Maltez Almeida. Clínica de Assistência à
Mu-INTRODUCTION
Mainly because of its high sensitivity, magnetic reso-nance imaging (MRI) has progressively attained a promi-nent position in the diagnosis of breast cancer and screen-ing of high-risk women(1,2). That triggered the widespread
dissemination of the method and brought challenges to re-ferring physicians, particularly breast care specialists and
João Ricardo Maltez de Almeida1, André Boechat Gomes2, Thomas Pitangueiras Barros3, Paulo Eduardo
Fahel4, Mário de Seixas Rocha5
lher. Avenida ACM, 237, Ed. Prof. Carlos Aristides Maltez, Itaigara. Salvador, BA, Brazil, 41825-000. E-mail: [email protected].
oncologists; old treatment paradigms had to be reassessed in light of the (relatively) new technique, leading to a fair amount of uncertainty(3,4).
One frequent claim concerns the proportionately low specificity of breast MRI when compared with mammogra-phy and ultrasound(5,6). This argument, albeit fallacious— given that the slightly lower specificity of breast MRI is partly credited to its unparalleled sensitivity—is frequently coupled with questions regarding the high number of false-positive results reported(7,8). These potential limitations would in-crease the numbers of unnecessary operations and aggres-sive procedures applied to any suspicious abnormality(3). As
a consequence, the capability of MRI to distinguish between benign and malignant lesions with accuracy has always been under scrutiny within the medical community(9).
In an effort to address some of these matters, the Ameri-can College of Radiology (ACR) Breast Imaging Reporting and Data System (BI-RADS®) included MRI in its two lat-est editions(10,11). The concepts of standardized terminology
(lexicon) and general assessment categories were adjusted to the particularities of MRI, similar to what had previously been done for mammography and ultrasonography. Never-theless, stratification guidelines for MRI category 4 findings— which have estimated cancer likelihoods ranging from > 2% to < 95%(11)—were not issued, in contrast to what is already
the norm for the other imaging methods(12,13). In order to achieve this feat, it is paramount to examine the predictive values of individual descriptors in this particular context.
The aim of this study is to establish the positive predic-tive values (PPVs) and posipredic-tive likelihood ratios (PLRs) for BI-RADS descriptors applied to category 4 abnormalities. We also identified the most cancer-related features and probed them in a multivariate model.
MATERIALS AND METHODS
This retrospective cross-sectional study stems from a graduate (sensu stricto) project sponsored by an academic medical institution and a regional private referral clinic in women’s healthcare. The independent review board of the medical school approved the study (Report no. 518.466) and waived the requirement for written informed consent.
Study design and population
Between November 2009 and December 2013, 1973 breast MRI studies were performed at our private practice. Of those 1973 studies, 238 (12.06%) revealed one or more suspicious findings (BI-RADS 4 lesions). It is our standard practice to schedule visits with premenopausal women be-tween the 5th and 14th days of their menstrual cycle. This protocol is bypassed only when the requesting physician considers the situation urgent.
Our information technology team restored and anony-mized 158 MRI studies to an independent image databank linked to a restricted version of the electronic medical record database of the institution (80 records could not be accessed
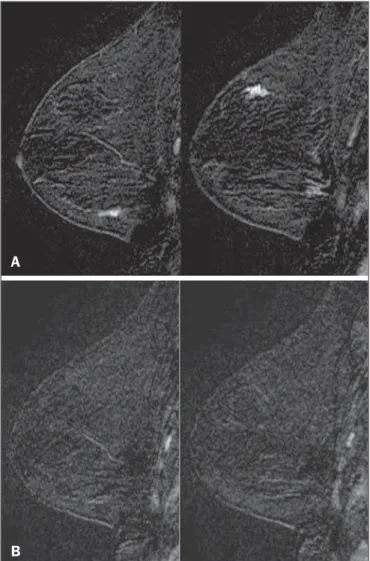
due to random data corruption secondary to defective me-dia). Exclusion criteria were: Records related to repeated investigations of the same patient without new findings were excluded (only the first one was included in the analyses), as were those related to small lesions (less than 5 mm), those including reports of pronounced image artifacts (such as patient movement and field inhomogeneity), and those in which there was no histopathologic outcome or adequate site correspondence between the MRI finding(s) and the patho-logic description. We decided to include 13 records related to lesions with diagnostic cytology only, because they were conclusive and had been monitored for at least two years. We also included one record related to a patient with two suspicious areas of enhancement that disappeared during follow-up and were not more aggressively investigated (Fig-ure 1). We excluded a total of 60 records—42 due to lack of follow-up, 16 because of image artifacts, and two because
Figure 1. Patient presenting with synchronous areas of non-mass enhancement on sagittal T1-weighted post-contrast fat-saturated images after subtraction. Despite being considered suspicious, the findings were followed only by MRI. A:
First examination, showing linear and focal areas of enhancement on the right breast, at approximately 6 and 12 o’clock, respectively, without representation on non-contrasted images (not shown). B: Control scan obtained six months after the first examination, showing no areas of enhancement. After 2 years of follow-up, the patient displayed no new abnormalities and the areas were categorized as probable functional asymmetric enhancement.
A
the lesions were considered foci. Therefore, the final study sample comprised 98 patients, with ages ranging from 28 to 88 years (mean of 51.5 years), among whom 121 findings were classified as BI-RADS 4 lesions.
MRI protocol
Images were acquired in a single 1.5 T MRI scanner (Signa Excite HdxT; GE Healthcare, Madison, WI, USA) with a dedicated, bilateral, 8-channel phased-array coil, while the patient was in the prone position. The standard protocol at the facility consists of sagittal T1-weighted fast spin-echo sequences (repetition time/echo time [TR/TE], 400/15; echo-train length, 5; bandwidth, 41.7 MHz; number of excitations, 1; matrix size, 320 × 224; field of view, 200 × 200 mm; slice thickness, 4 mm; intersection gap, 0.5), sagittal fat-suppressed T2-weighted images (TR/TE, 4500/85; echo-train length, 17; bandwidth, 25.0 MHz; number of excitations, 3; matrix size, 256 × 192; field of view, 200 × 200 mm; slice thickness, 4 mm; intersection gap, 0.5), and dynamic contrast-enhanced MRI acquisitions with three-dimensional fast spoiled gradi-ent-recalled echo sequence using Volume Imaging for BReast Assessment (VIBRANT) parallel imaging (GE Healthcare) in the sagittal plane (TR/TE, 5.5/2.7; flip angle, 15°; bandwidth, 50.0; number of excitations, 1; matrix size, 320 × 192; field of view, 200 × 200 mm; slice thickness, 3 mm; intersection gap, 0 mm; reduction factor, 2). The dynamic study is com-posed of pre-contrast images followed by five acquisitions spaced at 75-s intervals after bolus injection of 0.1 mmol/kg of body weight of gadoterate meglumine (Dotarem; Guerbet, Paris, France). We also acquire a late axial isotropic sequence: single-phase VIBRANT (TR/TE, 5.0/2.4; flip angle, 15°; bandwidth, 62.5; number of excitations, 1; matrix size, 350 × 350; field of view, 340 × 340 mm; slice thickness, 1 mm; intersection gap, 0 mm; reduction factor, 2).
Image analysis and data collection
The selected examinations were stored in an offline Advantage Windows workstation, version 4.4, with the Functool Software Package (GE Healthcare) for post-pro-cessing. Two examiners with at least 1000 breast MRI read-ings to their credit, blinded to the clinical data and pathologic outcomes, independently reviewed the images and described suspicious findings strictly according to the BI-RADS MRI lexicon. No studies were reclassified under a different BI-RADS category after review. Subsequently, the reviewers reanalyzed divergent descriptions and achieved a consensus in all cases. The same procedure was implemented for the semi-quanti-tative kinetic assessment, with regions of interest (contain-ing at least four pixels) positioned over the most suspicious area of enhancement, and the kinetic curve generated was classified as type 1, 2 or 3, corresponding to the delayed phases (persistent, plateau, and washout, respectively).
Mass and non-mass enhancement (NME) were equally described in terms of the internal enhancement pattern, T2 signal intensity, and type of curve, mostly based on the
ter-minology of the 2013 (5th) edition of the ACR BI-RADS(11).
Masses were termed specifically for shape and margin, while symmetry (when applicable) and distribution were defined for NME, because we opted to keep symmetry as an NME find-ing, according to the 2003 edition of the ACR BI-RADS(10).
Pathologic outcome
A pathologist specialized in breast diseases, with more than 10 years of experience, reevaluated and dichotomized the available reports as positive or negative for malignancy. By doing so, lesions considered to be indeterminate or high-risk in nature (atypical findings, lobular neoplasia, complex sclerosis, or papillary lesions) were categorized as non-ma-lignant. In cases with mixed histological features, the most aggressive pattern was used as the grouping indicator. The 13 cases investigated only by cytology were also validated, because they were compatible with imaging findings and showed benign evolution during follow-up.
Statistical analysis
Lexicon descriptors were categorized and correlated with the outcome (malignant or non-malignant). We considered positive cancer diagnoses as true positives for individual descriptors and, based on that assumption, PPVs and PLRs were calculated with 95% confidence intervals (95% CIs).
The association between independent descriptors and cancer frequencies were explored using the chi-square test of independence and, when fewer than five occurrences were expected, by Fisher’s exact test. We adopted a 5% level of significance (p < 0.05) for two-tailed tests. Predictor vari-ables were assessed by univariate logistic regression, and those with a p < 0.20 were inserted into separate multivari-ate predictive models for masses and NME. Each covarimultivari-ate had a minimum of six least frequent outcomes, and, because there was more than one finding for some participants (av-erage of 1.24 findings), the intracluster correlation coeffi-cient was employed. In addition, should any significant pre-dictor demonstrate relevant collinearity—defined as variance inflation factor above 3.5—it would be discarded. Odds ra-tios (ORs) and 95% CIs were calculated for significant pre-dictors. The fit and explained variability of the models were assessed by the Hosmer-Lemeshow test and pseudo R2. We also generated receiver operating characteristic (ROC) curve for the best model and derived its area under the curve (AUC). For those computations, we used Stata statistical soft-ware, version 12.0 (StataCorp LP; College Station, TX, USA).
RESULTS
Patients and subjects
ductal carcinomas in situ. The remaining 68 (56.2%) were determined to be non-malignant lesions, of which 17 (25.0%) were classified as indeterminate/high risk lesions—compris-ing 1 case of atypical columnar hyperplasia; 5 cases of un-specified atypical findings; 1 complex sclerosing lesion; and 10 papillary lesions—whereas 51 (75.0%) were classified as benign—including 15 fibroadenomas; 17 proliferative or nonproliferative fibrocystic changes; 11 inflammatory con-ditions; 2 pseudoangiomatous stromal hyperplasias; 1 pro-nounced peritumoral angiogenesis; 1 fibrous nodule; 2 con-clusive cases of negative cytologic studies; and 2 enhance-ment abnormalities that progressively disappeared.
The pathologic material originated from 21 (17.4%) mammography or ultrasound-guided core biopsies, 3 (2.5%) mammography-guided mammotome excisions, 1 (0.8%) MRI-guided mammotome excision, 12 (9.9%) fine-needle-aspirations, and 1 (0.8%) nipple discharge study (the last two with additional 2-year imaging follow-up). Of the 121 sus-picious MRI findings, the majority—81 (66.9%)—were de-fined on the basis of samples obtained during surgical pro-cedures (excisional biopsy or treatment). No pathologic confirmation was obtained for 2 (1.7%) of the suspicious MRI findings: both were NMEs observed in a single participant and progressively disappeared during MRI follow-up (there-fore being considered benign functional abnormalities). We did not find a significant difference between surgical and nonsurgical procedures in terms of the cancer yield (p = 0.084 from Fisher’s exact test).
Cancer likelihood based on morphology and T2 signal intensity
The main enhancement patterns demonstrated similar frequencies of malignancy, 24 (42.9%) of the 56 masses and
29 (44.6%) of the 65 NMEs being categorized as positive (p = 0.846 from the chi-square test), as shown in Tables 1 and 2. However, 14 (87.5%) of the 16 ductal carcinomas in situ presented as NMEs, whereas the majority—22 (59.5%)— of the 37 invasive cancers appeared as masses.
The individual mass descriptors with the highest PPVs were spiculated margin (71%) and round shape (63%), both of which had equally high PLRs (Table 1). In the NME group, segmental distribution had a high PPV (80%), there was one case of multiple regions of enhancement, and there were three cases of clumped internal pattern, all four cases being categorized as positive for malignancy (Table 2).
In the univariate analyses of descriptors for masses, T2 signal intensity did not achieve the cutoff significance level to be introduced into the multivariate logistic regression (p
= 0.252). The model including shape, margin, and internal enhancement as predictor variables could significantly dis-tinguish between malignant and non-malignant lesions (p = 0.038; pseudo R2
= 0.24), round shape independently reach-ing significance (OR: 12.91; 95% CI: 2.33–71.45; p = 0.003) and rim enhancement reaching marginal significance (OR: 7.15; 95% CI: 0.96–53.19; p = 0.055).
NME-related terms performed more poorly, only dis-tribution and internal enhancement being eligible for mul-tivariate modeling. The logistic regression analysis was sig-nificant (p = 0.031; pseudo R2
= 0.16) mainly because multiple regions of enhancement and clumped internal pat-tern were seen in a small number of all positive cases.
Cancer likelihood based on enhancement kinetics
Semi-quantitative kinetic analyses displayed different levels of performance when considered in association with the main patterns of enhancement. Washout (type 3) curves
Table 1—Characteristics of BI-RADS 4 findings classified as masses.
Lesions* Positive lesions
Descriptor
Mass Shape
Oval Round Irregular Margin
Circumscribed Irregular Spiculated Internal enhancement
Homogeneous Heterogeneous Rim enhancement Dark internal septations T2 signal
Low High
N(%)
56 (46.28)
19 (33.93) 16 (28.57) 21 (37.50)
7 (12.50) 42 (75.00)
7 (12.50)
26 (46.43) 17 (30.36) 13 (23.21)
0
18 (32.14) 38 (67.86)
N
24
4 10 10
1 18 5
7 10 7 0
10 14
PPV†[95% CI]
43 [30–57]
21 [6–46] 63 [35–85] 48 [26–70]
14 [0.4–58] 43 [28–59] 71 [29–96]
27 [12–48] 59 [33–82] 54 [5–81]
—
56 [31–79] 37 [22–54]
PLR†[95% CI]
0.96 [0.65–1.42]
0.36 [0.14–0.94] 2.22 [0.94–5.27] 1.21 [0.62–2.38]
0.22 [0.03–1.73] 1.00 [0.74–1.36] 3.33 [0.71–15.7]
0.49 [0.25–0.98] 1.90 [0.85–4.27] 1.56 [0.60–4.04]
—
1.67 [0.78–3.58] 0.78 [0.53–1.15]
did have a high PPV (73%) but only when associated with masses; as for NME, none of the kinetic curves were sub-stantially linked to malignancy (Table 3).
When the kinetic analyses were inserted into the pre-dictive models, the one for NME showed no significant improvement. Masses, however, displayed better model fit, with increased significance and explained variability (p = 0.015; pseudo R2
= 0.48), with four significant adjusted descriptors: round shape, type 3 curve, heterogeneous en-hancement, and rim enhancement (Table 4). The ROC curve for this model showed an AUC of 90% (Figure 2).
DISCUSSION
The capability of MRI to differentiate between malig-nant and non-maligmalig-nant findings has occasionally been called into question because of the overlapping characteristics be-tween the two and the variable predictive values(14–16). Sus-picious (category 4) lesions are even more problematic, because they present, by definition, an unacceptably wide
Table 2—Characteristics of BI-RADS 4 lesions classified as non-mass enhancement.
Lesions* Positive lesions
Descriptor
Non-mass enhancement Distribution and symmetry
Focal Linear Segmental Regional Multiple regions Diffuse Symmetric Asymmetric Internal enhancement Homogeneous Heterogeneous Clumped T2 signal Low High N(%) 65 (53.72) 25 (38.46) 11 (16.92) 15 (23.08) 4 (6.15) 1 (1.54) 0 0 9 (13.85) 8 (12.31) 54 (83.08) 3 (4.62) 47 (72.31) 18 (27.69) N 29 7 4 12 1 1 0 0 4 1 25 3 21 8
PPV†[95% CI]
45 [32–58] 28 [12–49] 36 [11–69] 80 [52–96] 25 [63–81] 100 [0.03–100] — — 44 [14–79] 13 [32–53] 46 [33–60] 100 [29–100] 45 [30–60] 44 [22–69]
PLR† [95% CI]
1.03 [0.74–1.44] 0.48 [0.23–1.00] 0.71 [0.23–2.19] 4.97 [1.55–15.90] 0.41 [0.05–3.77] — — — 0.99 [0.29–3.37] 0.18 [0.02–1.36] 1.07 [0.86–1.33] — 1.00 [0.74–1.36] 0.99 [0.45–2.19]
* Data in parentheses are percentages of the total number of non-mass enhancement (n = 65), except on the first row, where they are percentages of the total number of lesions (n = 121). †Expressed as %. —, Values that could not be calculated due to a lack of the finding in the study sample.
Table 3—Enhancement characteristics of BI-RADS 4 lesions, based on semi-quantitative kinetic analysis.
Lesions* Positive lesions
Type of curve
Mass (n = 51) Type 1 Type 2 Type 3
Non-mass enhancement (n = 62) Type 1 Type 2 Type 3 N(%) 8 (15.69) 28 (54.90) 15 (29.41) 27 (43.55) 29 (46.77) 6 (9.68) N 3 9 11 12 14 3
PPV†[95% CI]
38 [0.09–76] 32 [16–52] 73 [45–92] 44 [26–65] 48 [29–68] 50 [11.8–88.2]
PLR†[95% CI]
0.73 [0.20–2.74] 0.58 [0.33–1.02] 3.35 [1.23–9.12] 0.91 [0.51–1.61] 1.06 [0.63–1.81] 1.14 [0.25–5.21]
* Data in parentheses are percentages of the total number of lesions by main enhancement pattern: mass and non-mass enhancement. † Expressed as %.
Table 4—Multivariate model for mass descriptors applied to BI-RADS 4 lesions with kinetic curve assessment.
Predictor variable Shape Oval Round Irregular Margin Circumscribed Irregular Spiculated Internal enhancement Homogeneous Heterogeneous Rim enhancement Kinetic curve Type 1 Type 2 Type 3 Beta coefficient 0.00 4.35 0.69 0.00 3.00 3.89 0.00 3.33 3.54 0.00 –1.74 2.25
Odds ratio [95% CI]
range of malignancy likelihoods(11,17). In this study, we
dis-played positive predictive measures for each BI-RADS descrip-tor and applied simple multivariate logistic regression models to test their performance in this context. The observed results indicate that stratification of category 4 findings based on lexicon-established terminology might also possible for MRI. There are a large number of works about predictive val-ues of breast MRI characteristics(15,18,19). However, to our
knowledge, this is the first study to focus exclusively on BI-RADS 4 lesions. Most studies of this topic have investigated categories 4 and 5 together, and some have also included categories 0 through 3(14,15). The reader should bear this in
mind if comparing our results with those of other authors. The prevalence of malignancy in our sample (43.8%) is within the range specified by the BI-RADS as one of the MRI screening benchmarks(11). The BI-RADS stipulates that the
biopsy yield of malignancy (PPV3)—comprising categories
4 and 5—should be within the 20–50% range. Our finding is also consistent with most of the reported values, which range from 20% to 60%(20,21). Nevertheless, to account for pretest
probability, we provided the corresponding likelihood ratios. We detected almost equivalent frequencies of malignancy between masses and NMEs, similarly to Liberman et al.(18).
However, the vast majority of intraductal carcinomas (87.5%) appeared as NME, in accordance with most of the published results, in which reported frequencies range from 53.8% to 90%(18,22,23). Nevertheless, among all of the non-mass
find-ings, ductal carcinoma in situ was in the minority: only 14 out of 29 (48.3%) had no invasive component. One plau-sible explanation for this is that when more than one patho-logic feature was found in a single lesion, we focused only on the most aggressive feature.
The single mass-specific descriptor with the highest predictive measures was spiculated margin (PPV of 71%), because this term is often considered highly suggestive of malignancy. Unexpectedly, round shape was the second most predictive descriptor (PPV of 63%). Round shape is variably
associated with cancers, particularly of the triple-negative subtype, depending on the imaging method studied. Liberman et al.(24) noted a 42% frequency of malignancy as a function
of that descriptor applied to mammography. In contrast, Rahbar et al.(25) found that only 6% of the round masses
iden-tified by ultrasonography were malignant. The other pattern-specific terms in our sample, including irregular margin, had poorer predictive performances, with PPVs below 60%.
There were two non-mass descriptors with PPVs of 100%—clumped internal pattern and multiple regions of enhancement—the latter representing an invasive multicen-tric lobular carcinoma (Figure 3). Although the first term is commonly linked to higher cancer frequencies(14,26), the
small number of both findings in our sample precludes fur-ther conclusions. Segmental distribution also had substan-tial predictive power (PPV of 80%), although not enough to be included as a category 5 descriptor, in contrast with the findings of Kuhl et al.(27).
Logistic regression analyses showed good performance for masses, especially when kinetic curves were considered, as demonstrated by the ROC curve (AUC of 90%), although not for NME. These findings are somewhat similar to those reported by Yamaguchi et al.(28), who, like us, found that only a few of the adjusted variables were significantly pre-dictive. To account for correlated BI-RADS descriptors, as shown by Benndorf et al.(29), we ran model diagnostics and
excluded predictors with high degrees of collinearity. Our group elected to define the kinetic signal intensity graphic only by the composite description of the early and delayed enhancement phases, characterized as type 1, 2, or 3 curves. By taking this approach, analogous to that proposed by Kuhl et al.(30), we avoided the independent appraisal of the two distinct phases, which departs from our clinical rou-tine. We observed a likelihood of malignancy for type 3 curves higher than that previously reported(15,30), although only
when associated with masses.
This study has certain limitations. We excluded a con-siderable number of examinations, for various causes.
How-Figure 2. Receiver operating characteristic curve generated from the logistic re-gression model for nodules. Shape, margin, internal enhancement, and kinetic curve assessment were the independent variables. The performance of the model was considered highly satisfactory because it achieved an area under the curve of 90%.
ever, most were excluded because of digital storage issues. Although we do not identify any systematic bias, because the data corruption was apparently random, we acknowledge that there is a potential for unknown bias. For some of the de-scriptors, the data were insufficient to generate reliable PPVs and PLRs with manageable 95% CIs. In addition, the PPVs presented here are valid only when considering the stratifi-cation of BI-RADS 4 findings (4A, 4B, and 4C) and should not be generalized to other categories. Furthermore, some terms—“dark internal septations”, “symmetric”, “diffuse”, and “clustered ring”—were not utilized in this sample. We also chose to keep 15 findings (12.4%) that had no histopathologic validation. That was done in order to minimize selection bias and avoid an increase in the number of positive outcomes, which would have occurred had we kept only the findings submitted to aggressive investigation. The small number of MRI-guided procedures was an expected shortcoming, de-spite our facility being the only center in the region that is equipped for such procedures. We also had some correlated observations, as some patients presented more than one find-ing. However, we corrected them statistically by running multivariate models with cluster-robust standard errors.
CONCLUSION
We have shown that PPVs of certain BI-RADS descrip-tors can be used to discriminate malignant outcomes in the particular context of MRI category 4 abnormalities. The re-sults presented here suggest that stratification of these lesions into low (4A), moderate (4B), and high (4C) suspicion sub-groups is feasible and might be achieved in future editions of the ACR BI-RADS as larger studies are published.
REFERENCES
1. Kuhl C. The current status of breast MR imaging. Part I. Choice of technique, image interpretation, diagnostic accuracy, and transfer to clinical practice. Radiology. 2007;244:356–78.
2. Morris EA. Diagnostic breast MR imaging: current status and fu-ture directions. Magn Reson Imaging Clin N Am. 2010;18:57–74. 3. Turnbull L, Brown S, Harvey I, et al. Comparative effectiveness of MRI in breast cancer (COMICE) trial: a randomised controlled trial. Lancet. 2010;375:563–71.
4. Pediconi F, Miglio E, Telesca M, et al. Effect of preoperative breast magnetic resonance imaging on surgical decision making and can-cer recurrence rates. Invest Radiol. 2012;47:128–35.
5. Piccoli CW. Contrast-enhanced breast MRI: factors affecting sen-sitivity and specificity. Eur Radiol. 1997;7 Suppl 5:281–8. 6. Sung JS, Dershaw DD. Breast magnetic resonance imaging for
screening high-risk women. Magn Reson Imaging Clin N Am. 2013; 21:509–17.
7. Baltzer PA, Benndorf M, Dietzel M, et al. False-positive findings at contrast-enhanced breast MRI: a BI-RADS descriptor study. AJR Am J Roentgenol. 2010;194:1658–63.
8. Hoogerbrugge N, Kamm YJ, Bult P, et al. The impact of a false-positive MRI on the choice for mastectomy in BRCA mutation car-riers is limited. Ann Oncol. 2008;19:655–9.
9. Mariscotti G, Houssami N, Durando M, et al. Accuracy of mam-mography, digital breast tomosynthesis, ultrasound and MR imag-ing in preoperative assessment of breast cancer. Anticancer Res. 2014;34:1219–25.
10. D’Orsi CJ, Mendelson EB, Ikeda D, et al. ACR BI-RADS® Atlas, Breast Imaging Reporting and Data System. 4th ed. Reston, VA: American College of Radiology; 2003.
11. D’Orsi CJ, Sickles EA, Mendelson EB, et al. ACR BI-RADS® At-las, Breast Imaging Reporting and Data System. 5th ed. Reston, VA: American College of Radiology; 2013.
12. Sickles EA, D’Orsi CJ, Bassett L, et al. ACR BI-RADS® Mam-mography. In: D’Orsi CJ, Sickles EA, Mendelson EB, et al., edi-tors. ACR BI-RADS® Atlas, Breast Imaging Reporting and Data System. 5th ed. Reston, VA: American College of Radiology; 2013. 13. Mendelson EB, Böhm-Vélez M, Berg W, et al. ACR BI-RADS® Ultrasound. In: D’Orsi CJ, Sickles EA, Mendelson EB, et al., edi-tors. ACR BI-RADS® Atlas, Breast Imaging Reporting and Data System. 5th ed. Reston, VA: American College of Radiology; 2013. 14. Mahoney MC, Gatsonis C, Hanna L, et al. Positive predictive value
of BI-RADS MR imaging. Radiology. 2012;264:51–8.
15. Smith H, Chetlen AL, Schetter S, et al. PPV3 of suspicious breast MRI findings. Acad Radiol. 2014;21:1553–62.
16. Liberman L, Mason G, Morris EA, et al. Does size matter? Positive predictive value of MRI-detected breast lesions as a function of le-sion size. AJR Am J Roentgenol. 2006;186:426–30.
17. Torres-Tabanera M, Cárdenas-Rebollo JM, Villar-Castaño P, et al. Analysis of the positive predictive value of the subcategories of BI-RADS(®) 4 lesions: preliminary results in 880 lesions. Radiología. 2012;54:520–31.
18. Liberman L, Morris EA, Lee MJ, et al. Breast lesions detected on MR imaging: features and positive predictive value. AJR Am J Roentgenol. 2002;179:171–8.
19. Tozaki M, Igarashi T, Fukuda K. Positive and negative predictive values of BI-RADS-MRI descriptors for focal breast masses. Magn Reson Med Sci. 2006;5:7–15.
20. Lehman CD, Isaacs C, Schnall MD, et al. Cancer yield of mammog-raphy, MR, and US in high-risk women: prospective multi-institu-tion breast cancer screening study. Radiology. 2007;244:381–8. 21. Niell BL, Gavenonis SC, Motazedi T, et al. Auditing a breast MRI
practice: performance measures for screening and diagnostic breast MRI. J Am Coll Radiol. 2014;11:883–9.
22. Tozaki M, Fukuda K. High-spatial-resolution MRI of non-masslike breast lesions: interpretation model based on BI-RADS MRI de-scriptors. AJR Am J Roentgenol. 2006;187:330–7.
23. Baur A, Bahrs SD, Speck S, et al. Breast MRI of pure ductal carci-noma in situ: sensitivity of diagnosis and influence of lesion charac-teristics. Eur J Radiol. 2013;82:1731–7.
24. Liberman L, Abramson AF, Squires FB, et al. The Breast Imaging Reporting and Data System: positive predictive value of mammo-graphic features and final assessment categories. AJR Am J Roentgenol. 1998;171:35–40.
25. Rahbar G, Sie AC, Hansen GC, et al. Benign versus malignant solid breast masses: US differentiation. Radiology. 1999;213:889–94. 26. Sakamoto N, Tozaki M, Higa K, et al. Categorization of
non-mass-like breast lesions detected by MRI. Breast Cancer. 2008;15:241– 6.
27. Kuhl CK, Schrading S, Bieling HB, et al. MRI for diagnosis of pure ductal carcinoma in situ: a prospective observational study. Lancet. 2007;370:485–92.
28. Yamaguchi K, Schacht D, Sennett CA, et al. Decision making for breast lesions initially detected at contrast-enhanced breast MRI. AJR Am J Roentgenol. 2013;201:1376–85.
29. Benndorf M, Baltzer PA, Kaiser WA. Assessing the degree of col-linearity among the lesion features of the MRI BI-RADS lexicon. Eur J Radiol. 2011;80:e322–4.