M. Soares Filho
M. J. R. Guimarães
C. L. Sahlit
and J. L. V. Brito
Department of Civil Engineering Brasília University 70910-900 Brasília, DF. Brazil [email protected] [email protected] [email protected] [email protected]
Wind Pressures in Framed Structures
with Semi-rigid Connections
In the analysis and design of framed structures, the traditional methods are based on the simplified assumption that the joints are completely either pinned or rigid. However, the experimental investigations show that the frame connections present an intermediate behaviour between these two extreme cases. The present work is concerned with the dynamic elastic analysis of semi-rigid plane frames subjected to wind pressures. The dynamic excitation induced by the wind is estimated by adopting the simulation method of Monte Carlo. The wind flutuation pressures are decomposed into a limited quantity of harmonic components that are then combined many times, making possible the accomplishment of a probabilistic analysis and the choice of a characteristic response. The frame is considered as a set of contiguous bar elements, connected to each other at the nodes, and the connections are modelled as zero-length rotational springs. A nodal description of the kinetic and kinematic laws is given under the restriction of small displacements. The behaviour of the frame material and connections is described by linear elastic moment-rotation relationships, which are presented in the stiffness form. In order to take into account the effect of the semi-rigid behaviour of beam-to-column connections, the mass and stiffness matrices are developed as the sum of the conventional finite element matrices and correction matrices that incorporate the flexibility of the end joints. The problem of forced vibrations is then solved by means of the numerical integration of the motion equations.
Keywords: Semi-rigid frames, wind forces, vibration analysis, dynamic response
Introduction
The methods commonly used in the analysis and project of framed structures are developed under the supposition of a simplified behavior of the connections between beams and columns. The joint is considered either totally pinned (pinned-joint connection) or totally rigid (rigid-joint connection). However, the experimental investigations show that most connections present an intermediate behavior between these two extreme cases; due to this fact, they should, therefore, be classified as semi-rigid (Stelmack et al., 1986; Lee & Moon, 2002; Popov & Takhirov, 2002). The semi-rigid connection is the one that has a capacity of moment transmission intermediate between the rigid and the pinned ones. It permits that, under the action of a load, the interconnected elements present a relative rotation and can transmit part of the active moment among them.1
A connection beam-to-column of plane frame can be modeled considering three degrees of freedom. However, as the influence of the shear and axial deformations is, in general, small in relation to the rotational deformation (Jones et al., 1983), the behavior of the semi-rigid connection is described, in the present work, by the relation between the moment transmitted by it and the relative rotation between the two interconnected elements.
In spite of the behavior of most connections is not linear along all the moment-rotation curve, the linear approach is, in general, enough for the analysis of frames submitted to service loads (Lui & Chen, 1987). Therefore, the moment-rotation relation of the connection is considered herein as being linear elastic.
The behavior of the connection is an important factor to be considered in the analysis of frames submitted to dynamic loads (Osman et al., 1993). However, the literature on the dynamic analysis of semi-rigid structures is still very limited. Shi & Atluri (1989) and Chan & Ming Ho (1994) proposed methods for analysis of free vibrations of semi-rigid frames, without however coming up with the coefficients of the involved elementary matrices. The influence of the flexibility of the joints in the free vibrations of framed structures was studied by Soares Filho & Sahlit (1997a).
Paper accepted March, 2004. Technical Editor:Edgar Nobuo Mamiya.
These authors analyzed the behavior of semi-rigid structures subject to dynamic excitation considering, initially, the moment-rotation relationship of the connection as being linear elastic (Sahlit & Soares Filho, 1997) and, soon afterwards, assuming that the semi-rigid connections can be characterized by similar relations to the governing equations of an elastic, perfectly plastic material, using then the optimization methods of the mathematical programming (Soares Filho & Sahlit, 1997b).
The present work is concerned with the dynamic elastic analysis of semi-rigid plane frames subjected to wind pressures. The frame is considered as a set of contiguous bar elements, connected to each other at the nodes, and the connections are modeled as zero-length rotational springs. A nodal description of the kinetic and kinematic laws is given under the restriction of small displacements. The behavior of the frame material and connections is described by linear elastic moment-rotation relationships, which are presented in the stiffness form.
In order to take into account the effect of the semi-rigid behavior of beam-to-column connections, the mass and stiffness matrices are developed as the sum of the conventional finite element matrices and correction matrices that incorporate the flexibility of the end joints.
The dynamic excitation induced by the wind is estimated by adopting the Monte Carlo simulation method. This technique consists basically in the simulation of wind fluctuating pressures that are obtained from a local wind spectrum. The fluctuating pressures are decomposed into a limited quantity of harmonic components which are then combined many times for a possible gust center. For each combination obtained, a value of a relevant response is registered. Taking a reasonable quantity of relevant response values into consideration, a characteristic value is obtained by means of a statistic analysis, in which a probability of 95% of occurrence is considered. The random combination of the harmonic components, corresponding to the response value which is the nearest to the characteristic value, furnishes the characteristic wind excitation which simulates the wind fluctuating behavior.
©
Nomenclature
Latin Letters
L = lengh of element
xbi = deformation of the bar (element)
xic = deformation of the connection
xi = total deformation
ki = stiffness connection
Xi = bending moment
qi(t) = cinematic nodal displacement
t = time
E = elasticity modulus
I = identity matrix
B = matrix of the effect of the flexibility of semi-rigid connections
M0= conventional consistent-mass matrix M= modified consistent-mass matrix
m= mass for unit of length
Pi = fixity factor of semi-rigid connection
Ri = stiffness index of semi-rigid connection
WT = total potential energy
EI = flexural stiffness
u(t) = vector of the dynamic nodal displacements
g
M = global mass matrix
g
C = global damping matrix
g
K
= global stiffness matrixi
a = proportionality factors V0 = basic wind velocity
VK = characteristic wind velocity
S1 and S3 = statistical factors
S2 = topografic factor
q(z) = dynamic pressure at the heigth z Ca = drag coefficient
Fa = wind drag force
b, Fr and p = meteorological factors Ae = frontal area of the structure p600 = mean pressure
p3 = peak pressure
f = frequency
S(f) = power spectrum of wind velocity
*
u = friction velocity
U0 = mean wind velocity at 10 m high
Sp’(z,f) = power spectrum of fluctuating pressures car = aerodynamic coefficient
Uz = mean velocity at the heigth z
Uy1 = top displacement p’(t) = fluctuating pressures
Greek Symbols
w(y,t) = field of displacements
Ψi (y) = form functions
ξ = damping ratio
)
(
t
g
λ
= vector of the applied nodal loadsωi = frequencies of vibration
φi = natural vibration modes
ρ = air density
) ' ( 2
p
σ = mean square value of p’(t)
∆z0k = gust dimension
Mass Matrix
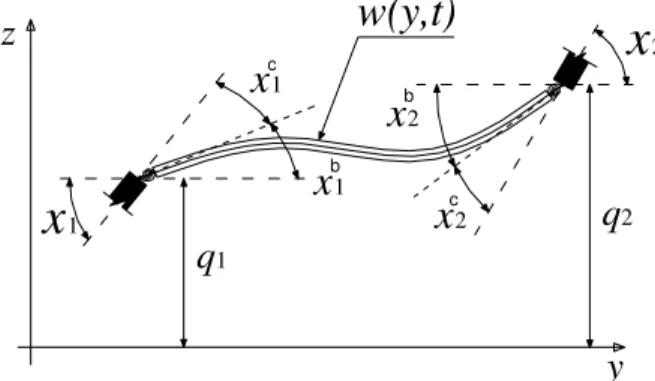
Consider the structural element, of length L, with semi-rigid
connections shown in Fig. 1, where xbi is the deformation of the bar
(element), xci is the connection deformation and xi is the total deformation, that is, the relative rotation between the linked elements by the connection.
c
b
c b
x
1x
1w(y,t)
x
2x
2x
1x
2y
q
2q
1z
Figure 1. Deformed structural element with semi-rigid connections.
From Fig. 1, the total deformation may be written as
c i b i
i x x
x = + (1)
where the connection deformation c i
x , introduced by its flexibility, depends on the rigidity of the connection ki and the bending moment
Xi,being given by
i
i c i
k X
x = (2)
For the dynamic analysis of a beam element, the field of the displacements w(y, t) can be defined in terms of four form functions
) (y
i
Ψ and of the nodal displacements q1(t), x1b(t), q2(t) and x2b(t),
in the instant of time t, as
[
]
⎥ ⎥ ⎥ ⎥ ⎥
⎦ ⎤
⎢ ⎢ ⎢ ⎢ ⎢
⎣ ⎡ =
=
) t ( x
) t ( q
) t ( x
) t ( q
) y ( ) y ( ) y ( ) y ( ) t ( q ) y ( ) t y, ( w
b b
2 2 1 1
4 3 2
1 Ψ Ψ Ψ
Ψ
ψ (3)
where
1 3 2
2 2
3 3
1 = − +
L y L
y ) y (
Ψ (4a)
y L y
L y ) y
( = − +
2
2 3
2
2
Ψ (4b)
2 2
3 3 3
3 2
L y L
y ) y
( =− +
Ψ (4c)
L y L y ) y (
2
2 3
4 = −
Taking into account the additional rotation due to the connection, Eq. (2), the field of displacements, Eq. (3), for a beam element with semi-rigid joints becomes
{ }
[
]
⎪ ⎪ ⎪ ⎭ ⎪ ⎪ ⎪ ⎬ ⎫ ⎪ ⎪ ⎪ ⎩ ⎪ ⎪ ⎪ ⎨ ⎧ ⎥ ⎥ ⎥ ⎥ ⎥ ⎥ ⎥ ⎦ ⎤ ⎢ ⎢ ⎢ ⎢ ⎢ ⎢ ⎢ ⎣ ⎡ − ⎥ ⎥ ⎥ ⎥ ⎥ ⎦ ⎤ ⎢ ⎢ ⎢ ⎢ ⎢ ⎣ ⎡ = − = 2 k ) t ( 2 X 1 k ) t ( 1 X ) t ( 2 x ) t ( 2 q ) t ( 1 x ) t ( 1 q ) y ( 4 ) y ( 3 ) y ( 2 ) y ( 1 ) t ( Z ) t ( u ) y ( ) t y, ( w 0 0 Ψ Ψ Ψ Ψ ψ ’ (5)Considering the form functions (4) and replacing (5) into
0
1(t)=−EIw′′(y,t) y=
X (6a)
L y ) t , y ( w EI ) t (
X2 = ′′ = (6b)
the following equations may be obtained
⎥ ⎥ ⎥ ⎥ ⎦ ⎤ ⎢ ⎢ ⎢ ⎢ ⎣ ⎡ ⎥ ⎦ ⎤ ⎢ ⎣ ⎡ − − = ⎥ ⎦ ⎤ ⎢ ⎣ ⎡ ⎥ ⎦ ⎤ ⎢ ⎣ ⎡ + + ) t ( x ) t ( q ) t ( x ) t ( q L L L L L EI ) t ( X ) t ( X W W W W 2 2 1 1 2 2 1 2 1 2 1 4 6 2 6 2 6 4 6 4 1 2 2 4 1 (7)
where Ri=Lki/EI=1/Wi represents the stiffness index of the connection at the end i (i=1, 2).
Admitting that ∆=
[
(1+4W1)(1+4W2)−4W1W2]
and after some algebraic manipulations, the Eq. (7) may be written as⎥ ⎥ ⎥ ⎥ ⎦ ⎤ ⎢ ⎢ ⎢ ⎢ ⎣ ⎡ ⎥ ⎦ ⎤ ⎢ ⎣ ⎡ + + − + + − + + = ⎥ ⎦ ⎤ ⎢ ⎣ ⎡ ) t ( x ) t ( q ) t ( x ) t ( q ) W ( L ) W ( L ) W ( L ) W ( ) W ( L ) W ( L EI ) t ( X ) t ( X 2 2 1 1 1 1 1 2 2 2 2 2 1 3 1 4 2 1 6 2 2 1 6 2 2 1 6 3 1 4 2 1 6 ∆ (8)
Introducing Eq. (8) into Eq. (5) of the field of displacements,
w(y, t), and considering that
⎥⎦ ⎤ ⎢⎣
⎡− + − + + −
= 1 1 2 1 1 2 1 1 2 1
1 2 2
6 3 4 2 6 W ) W W W ( L ) W W W ( ) W W W ( L BT (9) and ⎥⎦ ⎤ ⎢⎣ ⎡− + − + − +
= (W WW ) (W WW )
L W ) W W W ( L
B2T 6 2 2 1 2 2 2 6 2 2 1 2 4 2 3 1 2
(10)
the following relation is obtained
⎥ ⎥ ⎥ ⎥ ⎦ ⎤ ⎢ ⎢ ⎢ ⎢ ⎣ ⎡ ⎥ ⎥ ⎥ ⎥ ⎥ ⎦ ⎤ ⎢ ⎢ ⎢ ⎢ ⎢ ⎣ ⎡ = = ) ( ) ( ) ( ) ( 0 0 1 -) ( 1 -) ( 2 2 1 1 2 1 t x t q t x t q t t T T T T B B Bu Z ∆ ∆ (11)
Finally, the field of the displacements w(y, t) can be expressed in terms of the nodal displacements q1(t) and q2(t) and of the end rotations x1(t) e x2(t) as
) ( 1 ) ( )
(y,t y t
w I B u
⎭ ⎬ ⎫ ⎩ ⎨ ⎧ + = ∆
ψ (12)
where the presence of the matrix B reflects the effect of the flexibility of the semi-rigid connections. It is important to note that, if the connections are rigid, all the terms in B will be zero and Eq. (12) will be reduced to the classic definition of the displacement field in terms of the nodal displacements.
To obtain a consistent-mass matrix of a disconnected element with semi-rigid joints, it is used the expression of the kinetic energy
T for a beam element with mass per unit of length m, which is
[
]
∫ = L dy t y w y mT 0 ( ) ( , )2 2
1
(13)
Evaluating the first time derivatives of the field of displacements, Eq. (12), and replacing the result in Eq. (13) one gets
[
()]
1 ( )[
( )]
( ) 1 ()2 1
0 m y y y dy t
t
T u T I BT L T ⎢⎣⎡ +I B⎥⎦⎤u
⎭⎬ ⎫ ⎩⎨ ⎧ ⎥⎦ ⎤ ⎢⎣ ⎡ + =
∫
∆∆ ψ ψ
(14)
The integral in Eq. (14) denotes the conventional consistent-mass matrix M0. Hence, this equation can be rewritten as
[
()]
1 1 1 1 ( )2 1 0 0 0 0 t t
T u T M M B BTM BTM B u
⎭ ⎬ ⎫ ⎩ ⎨ ⎧ + + + = ∆ ∆ ∆ ∆ (15)
The kinetic energy is then expressed as
[ ]
(){
}
() 2 1 1 0 t tT = u T M +M u (16)
where B M B M B B M M ∆ ∆ ∆ ∆ 1 1 1 1 0 0 0 1 T T + +
= (17)
represents the matrix of correction of the conventional consistent-mass matrix so as to take into consideration the presence of semi-rigid connections. The consistent-mass matrix M , modified by the inclusion of semi-rigid joints, is given therefore by the sum of the two matrices M0 and M1.
The presence of the semi-rigid joints does not affect the stiffness coefficients related to the axial effects. Therefore, the mass matrix of an element with semi-rigid joints is given by
(
)
(
)
(
)
(
)
(
)
(
)
(
)
(
)
(
)
(
)
⎥⎥ ⎥ ⎥ ⎥ ⎥ ⎥ ⎥ ⎦ ⎤ ⎢ ⎢ ⎢ ⎢ ⎢ ⎢ ⎢ ⎢ ⎣ ⎡ − − − = 1 2 5 2 1 2 2 2 1 6 2 2 1 4 1 2 1 1 2 4 2 1 3 2 2 1 5 2 2 1 2 2 1 1 2 2 2 _ , 4 , 2 0 , , , 4 0 , , 2 140 0 0 , 4 , 2 symmetric , 4 0 0 70 0 0 140 420 P P f L P P Lf P P f L P P Lf P P f P P Lf P P f D P P f L P P Lf P P f D D D L m M (18) where©
f1(P1, P2) = (560 + 224P1 + 32P12 - 196P2 - 328P1P2 –
55P12P2 + 32P22 + 50P1P22 + 32P12P22) (19b)
f2(P1, P2) = (224 P1 + 64 P1 2
- 160 P1 P2 - 86 P1 2
P2 + 32
P1P22 + 25 P12P22) (19c)
f3(P1, P2) = (560 - 28 P1 - 64 P12 - 28 P2 - 184P1P2 + 5 P12P2 - 64P22 + 5
P1P22 + 41 P12P22) (19d)
f4(P1, P2) = (392 P2 - 100 P1 P2 - 64 P1 2
P2 - 128 P2 2
–
38 P1P22 + 55 P12P22) (19e)
f5(P1, P2) = (32 P12 - 31 P1 2 P2 + 8 P12P22) (19f)
f6(P1, P2) = (124 P1P2 - 64 P1 2
P2- 64 P1P2 2
+ 31 P1 2
P2 2
) (19g)
In Eqs. (19a-g), Pi(i=1, 2) is the fixity factor of semi-rigid connection at the end i, defined in relation to the stiffness index Ri as i i i R R P + =
3 (20)
Stiffness Matrix
Considering the relation of the displacement field (12), the stiffness matrix of a disconnected element with semi-rigid joints may be obtained. For that, the expression of the total potential energy WTis used for a beam element, modifying the expression of the kinetic energy (13). This expression, for an element with flexural stiffness EI, is composed of two parts: one, due to the elastic deformation of the beam, which can be written as
[
]
∫
′′= L
v EIw(y,t) dy
W 0 2 2 1 (21)
and another, which is due to the rotational flexibility of the connection, given by
[ ]
[ ]
2 2 2 2 1 1 2 1 21 c c
c k x k x
W = + (22)
By replacing the second derivative of Eq. (12) in relation to y in Eq. (21), it follows that
[
( )]
1{
[
( )] [
( )]
}
1 ()2 1
0EI y y dy t
t
W T T L T
v u I B I B⎥⎦u
⎤ ⎢⎣ ⎡ + ′′ ′′ ⎥⎦ ⎤ ⎢⎣ ⎡ + =
∫
∆∆ ψ ψ
(23)
Knowing that the integral in Eq. (23) denotes the conventional stiffness matrix K0, for instance (Paz, 1992), this relation may be
rewritten as
[
()]
1 1 1 1 ()2 1 0 0 0 0 t t
Wv u T K K B BTK BTK B u
⎭ ⎬ ⎫ ⎩ ⎨ ⎧ + + + = ∆ ∆ ∆ ∆ (24) Considering that B K B K B B K K ∆ ∆ ∆ ∆ 1 1 1 1 0 0 0 1 T T + +
= (25)
the potential energy due to the elastic deformation of the beam is then expressed as
[ ]
(){
}
() 2 1 1 0 t tWv= u T K +K u (26)
On the other hand, it is known from Eq. (2) that
) ( 1 t k X
x Ti
i i c
i ∆ B u
− =
= (27)
Introducing Eq. (27) into Eq. (22), it follows that
[ ]
[
1 1 1 2 2 2]
2 ) ( ) ( 2 1 ∆ t k k tWc= u T BBT+ B BT u (28)
Calling 2 2 2 2 1 1 1
2 /∆
T T
k
kB B B B
K = + (29)
the expression of the total potential energy may be obtained as
[ ] {
()}
() 2 1 2 1 0 t t W WWT= v+ c= u T K +K +K u (30)
where K1 and K2 represent the correction matrices of the
conventional stiffness matrix so as to take the presence of semi-rigid connections into consideration. The stiffness matrix modified by the inclusion of semi-rigid joints is obtained therefore through the sum of three matrices
2 1
0 K K
K
K = + + (31)
As for the mass matrix, the presence of semi-rigid joints does not affect the stiffness coefficients related to the axial effects. Therefore, the stiffness matrix of the element with semi-rigid joints is ⎥ ⎥ ⎥ ⎥ ⎥ ⎥ ⎥ ⎥ ⎥ ⎥ ⎥ ⎥ ⎥ ⎥ ⎥ ⎦ ⎤ ⎢ ⎢ ⎢ ⎢ ⎢ ⎢ ⎢ ⎢ ⎢ ⎢ ⎢ ⎢ ⎢ ⎢ ⎢ ⎣ ⎡ + − + + + + − + + − − + + + = L EIB L ) B B ( EI L EIB L ) B B ( EI L ) B B B ( EI L ) B B ( EI L ) B B B ( EI L EA L EA L EIB L ) B B ( EI symmetric L ) B B B ( EI L EA K 22 2 22 12 12 2 22 12 3 22 12 11 2 12 11 3 22 12 11 11 2 12 11 3 22 12 11 4 2 2 0 2 2 2 0 4 0 2 2 4 0 0 0 4 2 2 0 4 0 (32) where 2 1 1 11 4 3 P P P B −
= (33a)
2 1 2 1 12 4 3 P P P P B −
= (33b)
2 1 2 22 4 3 P P P B −
Equations of Motion of the Dynamic System
The equations of motion for the analysis of forced vibrations of a structure with semi-rigid connections may be expressed as
) ( ) ( ) ( )
(t g t g t g t
gu +C u +K u =λ
M (34)
where
M
g,g
C and
g
K , of order (n x n), are respectively the
global mass, damping and stiffness matrices of the structure, obtained from the matrices of the structural elements, properly modified by the presence of semi-rigid joints; u, u and u, of order (n x 1), are respectively the nodal acceleration, velocity and displacement vectors of the structure; and λg(t) is the vector, of order (n x 1), of the applied nodal loads. The system (34) is solved, in the present work, by the numeric integration scheme of Newmark.
For the forced vibration analysis, the typical expression for the damping matrix, called Rayleigh damping matrix,
g g g a M aK
C = 0 + 1 (35)
is used, where a0 and a1 are proportionality factors that can be obtained by means of two natural frequencies of vibration and corresponding damping ratios ξ.
When the applied forces in the structure are null, λg(t) = 0, the solution of Eq. (34) turns into an eigenvalue or characteristic value problem, given by
(
−ω2)
φ=0g
g M
K (36)
whose solution provides the values of the natural frequencies of vibration
ω
i and their corresponding natural vibration modesφ
i (i=1, ..., n). In the present work, the Jacobi method is used for the calculation of the eigenvalues and corresponding eigenvectors or mode shapes.Characteristic Wind Excitation by the Simulation Method
of Monte Carlo
In the simulation method of Monte Carlo, the fluctuating pressures of the wind are generated starting from a given wind spectrum, where the fluctuating pressure is decomposed into a limited quantity of harmonic components. These are then combined many times for a possible gust center and, in each combination, a value of the relevant response of top displacement, in the present case, is registered.
Thus, a considerable quantity of values of this response is at disposal, making a statistical analysis possible in order to obtain a characteristic value, corresponding to a probability of 5% of being exceeded. Defined this characteristic value, the random combination of the harmonic forces can be determined whose maximum response is the nearest to the characteristic one. Finally, the structure is again excited by this random combination and the characteristic values for all displacements and member forces are then obtained with good approximation (Franco, 1993; Guimarães, 2000).
Aerodynamic Loads
The aerodynamic loads are obtained, in the present work, from the continuous profile of the dynamic pressures, according to the procedure proposed by Blessmann (1988), considering the values of the basic wind velocity Vo, the topographical and statistical factors
and the drag coefficients Ca, all provided by the Brazilian Code NBR-6123 (1987) and taking into account, besides, the geometric parameters of the construction.
The characteristic wind velocity, Vk, is obtained by the expression
Vk=VoS1S2S3 (37)
being the factor S2, at the heigth z, given by
p
r z
F b
S2 = ( /10) (38)
The dynamic pressure can then be calclated as
6 . 1 ) (
2
k
V z
q = (39)
where q(z) is given in N/m2 and Vk in m/s.
The wind drag force, Fa, at each pavement level is given by
Ae z q Ca
Fa= ( ) (40)
where Ae is the frontal area of the structure exposed to the wind.
Simulation of Monte Carlo
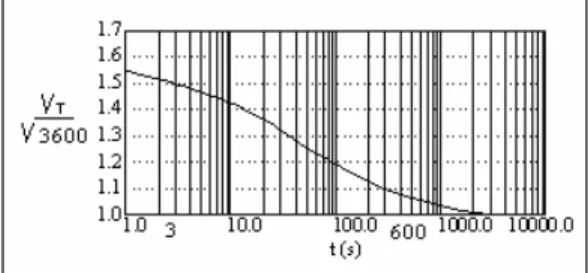
The mean wind is conventionally measured in time intervals that vary from 10 minutes to 1 hour. Many codes, however, among which the Brazilian Code, define values for the peak velocity measured in very short time intervals (2 to 5 seconds) (Franco, 1993).
Starting from these values, which are practically instantaneous, it is possible to determine the mean velocity measured in a time interval of, say, 10 minutes. Thus, it is possible to obtain a ratio between the mean pressure and the fluctuating maximal pressure through the graph shown in Fig. 2. The ratio between the mean pressure, considered when t =600 s and the peak one, assuming t = 3 s, will be given by
(
0.69)
0.48 )2 / 1 (
) 2 / 1
( 2
2
3 600 2
3 2 600 2 3 2 600
3
600 = =
⎟⎟ ⎠ ⎞ ⎜⎜ ⎝ ⎛ = = =
V V
V V
V V p
p
ρ ρ
(41)
meaning that 48% of the total pressure is constant and 52% is due to the fluctuating pressures.
Figure 2. Equivalence between hourly wind and average wind on t seconds.
©
0 3
/ 4 2 2
2 *
1220 ;
) 1 ( 4 ) (
U f x x
x
u f S
f =
+
= (42)
where Uo is the mean wind velocity at 10 m high in an open terrain,
u* is the friction velocity and f is the frequency in Hz.
Assuming that the intensity of the turbulence is low, the spectral density function of the fluctuating pressures Sp’ (z, f) can be written as a function of the velocity spectrum as
) , ( ) (
) ,
( 2
' z f c U S z f
Sp = ρ ar z (43)
where ρ is the air density, car is the aerodynamic coefficient at the considered point and Uz is the mean velocity at the height z.
With sufficient precision, the spectrum of fluctuating pressures can be considered as being proportional to the spectrum of velocities as
2
'( , ) [ ( , )]; ( ar z)
p z f PS z f P c U
S = = ρ (44)
The fluctuating pressure p’(t) at all points of the structure corresponds to 52% of the total pressure p(t), constituting a random, stationary, ergodic and gaussian process. The pressure p’(t) may be represented through a Fourier integral as
∫
+∞
∞ −
−
= C f ft f df
t
p'( ) ( )cos[2π θ( )] (45)
where
) ( ) ( )
(f A2 f B2 f
C = + (46)
) (
) ( tan )
( 1
f A
f B f = −
θ (47)
∫
∞ ∞ −
= p t ftdt f
A( ) '( )cos2
π
(48)∫
∞
∞ −
= p t sin ftdt
f
B( ) '( ) 2π (49)
The mean square value of p'(t), supposedly defined over a sufficiently long time interval T, is given by
∫ ∫
−
∞
=
= /2
2
/ 0
2 2
2( ') 1 T ' () 2 ( )
T
df f C T dt t p T p
σ (50)
If T→∞, the following equation may be written
∫
∞
= 0
2(p') S (z,f)df
' p
σ (51)
where )Sp'(z, f is the spectral density function of p’(t) and
) , (
' z f
Sp d(f) represents the elementary contribution, associated to
the frequency interval df, to the mean square value.
Instead of an infinite number of functions, p’(t) may be represented in an approximate way by a finite number m of harmonical functions, conveniently chosen in such a way that their periods span uniformly over the time interval of interest, which goes from 600 to 0.5 seconds. Franco (1993) proposes the use of, at least,
eleven harmonical functions (m≥11), having the period of one of them coinciding with the fundamental period of the structure and the other periods taken as multiple of the fundamental period.
The Equation (45) now becomes
∑ = ⎟⎟
⎠ ⎞ ⎜⎜
⎝ ⎛
−
≅ m
k k
k r
k t
r T C t
p'() 1 cos 2π θ (52)
where the coefficients Ck and rk are given by
∫
= ) (
'( , )
2 k
p
k S z f df
C (53)
r k k
r =2 − (54)
being r the index of the resonant component and rk the index of the other components.
The maximal amplitude of the fluctuating pressure is
p’(t)=0.52p. Now the amplitudes for the m harmonic components of
p’(t) are given by
' '
1
' p c p
C C
p k
m
k k
k
k = =
∑
=
(55)
The random nature of the process is characterized by the random combination of the phase angles of the m harmonical functions.
To obtain the spatial correlation between velocities and fluctuating pressures, the concept of gust dimension is used. Thus, the height ∆zok of the equivalent gust can be given by
k k
k
f Uo z d U
f z z
7 ) ( 14
exp 2
0 0
0 ⎟⎟ ∆ =
⎠ ⎞ ⎜⎜
⎝
⎛ ∆
− =
∆ ∞
∫
(56)Figure 3. Equivalent gusts (a) and reduction coefficients of fluctuating pressures (b).
The gust of frequency fk, whose correlation coefficients are represented by double exponential curves, may be approximated by the perfectly correlated gust of height ∆zok=Uo/7fk, or, as it is used in the present work, by the gust defined by two triangles which implies in a decaying linear correlation from 1 to 0 in an area with total length of 2∆zok=2Uo/7fk, according to Fig. 3-a.
In the present work, the gust center is adopted as located at 85% of the structure height. Thus, the fluctuating pressures should be multiplied by the linear decaying coefficient, as in Fig. 3-b, whose value varies from 1 to 0.
Once chosen a relevant generalized coordinate, which in the present case is the top displacement, the structure was simultaneously excited by the m functions, with random phase angles θk. For each combination of θk values, an analysis in the time
domain, corresponding to the duration of the gust - which is supposed to be nearly 600 seconds - is taken place and the maximal value of the relevant coordinate is determined.
With the several values of top displacement Uy1, the
characteristic value of the associated response to this coordinate will be evaluated by means of a statistical analysis assuming type I extremes distribution (Gumbel), with 5% of probability of being exceeded. In the present work, twenty analyses in the time domain have been done, which corresponds to twenty sets of random phase angles for each type of structural connection considered.
It is now necessary to determine the characteristic values of all the displacements and of the member forces in the structure. To achieve this purpose it suffices to select, among the random loading combination, one whose response is the nearest to the characteristic value of top displacement. By exciting the structure with this characteristic load, the characteristic values of response for the whole structure are found, and so is the dynamic analysis completed.
To obtain the final response, the combined analysis has been done considering 48% of the value of the response given by the static analysis, plus the characteristic value obtained from the Monte Carlo simulation.
Numerical Results
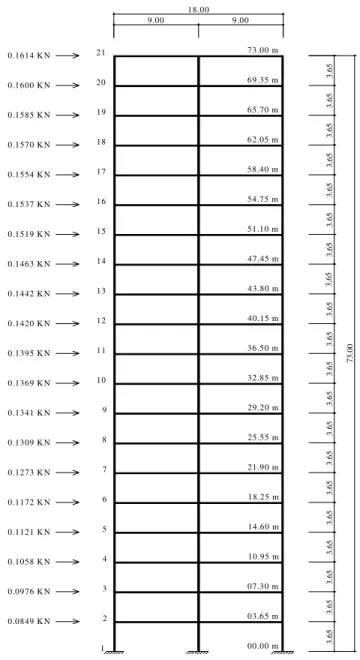
The dynamic analysis of a twenty floors steel frame with semi-rigid connections, subjected to wind pressures, is presented. The frame dimensions, in meters, are specified in Fig. 4. The semi-rigid connections are only considered in the connections of the beams with the columns, being assumed that they behave elastically and being taken into account two fixation factors: Pi = 0.5 (semi-rigid joints) and Pi = 1.0 (rigid joints).
The characteristics of the metallic profiles are shown in Table 1. It is used steel ASTM A-36, with modulus of elasticity E = 210.00 x 10⁶ KN/m2 and density ρ= 78.255 KN/m3.
Table 1. Data of the metallic profiles used in the steel frame.
Element Cross section
(m2)
Moment of inertia (m4) Columns (1st to 4th floors) 0.08650 0.00300520 Columns (5th to 8th floors) 0.06520 0.00204370 Columns (9th to 14th floors) 0.05010 0.00146930 Columns (15th to 20th floors) 0.04010 0.00111134
Beams (all) 0.01826 0.00087410
It is aimed to study the influence of the semi-rigidity of the connections in the dynamic response of the structure, with regard to the values of the natural frequencies of vibration and corresponding modal forms, as well as the maximum displacements and distribution of structural internal forces produced by the wind action. The technique used to evaluate the active load at the structure in the direction of the wind is based on the method of simulation of Monte Carlo, as described in item 5. It is considered that the structure presents a damping ratio ξ = 0.05. The time of analysis for each combination of the harmonic components of the wind is of 10 minutes, having been used a total of 85650 time steps
1 2 3 4 5 6 7 8 9 10 11 12 13 14 15 16 17 18 19 20 21
0.0849 K N 0.0976 K N 0.1058 K N 0.1121 K N 0.1172 K N 0.1273 K N 0.1309 K N 0.1341 K N 0.1369 K N 0.1395 K N 0.1420 K N 0.1442 K N 0.1463 K N 0.1519 K N 0.1537 K N 0.1554 K N 0.1570 K N 0.1585 K N 0.1600 K N 0.1614 K N
00.00 m 07.30 m 10.95 m 14.60 m 18.25 m 21.90 m 25.55 m 29.20 m 32.85 m 36.50 m 40.15 m 43.80 m 47.45 m 51.10 m 54.75 m 58.40 m 62.05 m 65.70 m 69.35 m 73.00 m
03.65 m
3
.6
5
7
3
.0
0
3
.6
5
3
.6
5
3
.6
5
3
.6
5
3
.6
5
3
.6
5
3
.6
5
3
.6
5
3
.6
5
3
.6
5
3
,6
5
3
.6
5
3
.6
5
3
.6
5
3
.6
5
3
.6
5
3
.6
5
3
.6
5
3
.6
5
9.00 18.00
9.00
Figure 4. Steel frame of 20 floors under the action of the static wind load.
The static analysis of the structure was done by using a program of linear static analysis of plane frames with semi-rigid connections, developed by Soares Filho (1997). In this analysis, the static load of the wind was determined according to a procedure described in the Brazilian Code NBR-6123 (1987). Table 2 presents the values of the static horizontal displacements at the top frame, for the cases of rigid and semi-rigid joints.
Table 2. Static horizontal displacements of the node 21.
Connection Displacement (m)
Rigid (Pj=1.0) 0.11969
Semi-rigid (Pj=0.5) 0.256043
©
Table 3. Frequencies considering the two types of connections.
Connection Frequencies
(rad/s) Rigid (Pj = 1.0) Semi-rigid (Pj = 0.5)
ω1 4.850 3.350
ω2 15.439 10.152
ω3 25.102 17.307
ω4 35.691 25.257
ω5 47.010 34.826
ω6 59.674 45.998
Figures 5 and 6 show the modal displacements of the left column of the frame, allowing the analysis the variations suffered by the first and second vibration modes, when the flexibility of the connections is taken into consideration.
0 4 8 12 16 20
0 0,04 0,08 0,12
le
v
e
l
rígid semi-rígid
Figure 5. Variation in the first natural vibration mode.
0 4 8 12 16 20
-0.15 -0.1 -0.05 0 0.05 0.1 0.15
le
v
e
l rígid
semi-rígid
Figure 6. Variation in the second natural vibration mode.
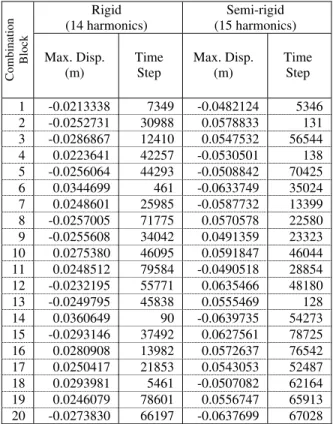
In Table 4, the maximum responses of the top displacement are presented, one for each combination of the 20 blocks of random numbers (phase angles of the harmonic components), obtained from the analysis in the time domain for the rigid and semi-rigid structural models.
By using the values of the maximal displacements listed in Table 4, a probabilistic analysis is carried out (Gumbel - Type I): one for the rigid structure and another for the semi-rigid one, in which the characteristic values are determined, with a probability of 95% of occurrence. The results of the analysis can be seen in Table 5, where µ is the mean, σ is the standard deviation; p is the probability of occurrence of the characteristic value; ϖ, α and xb are
parameters of Gumbel for extreme values; and Xc is the
characteristic value of Gumbel corresponding to the probability p. In Table 5, it is also indicated the excitation block whose maximum is the nearest to the characteristic value Xc, which is considered as the block of the characteristic excitation.
Table 4. Maximum horizontal displacements of the node 21.
Rigid (14 harmonics)
Semi-rigid (15 harmonics)
Combination
Block Max. Disp.
(m)
Time Step
Max. Disp. (m)
Time Step
1 -0.0213338 7349 -0.0482124 5346
2 -0.0252731 30988 0.0578833 131
3 -0.0286867 12410 0.0547532 56544
4 0.0223641 42257 -0.0530501 138
5 -0.0256064 44293 -0.0508842 70425
6 0.0344699 461 -0.0633749 35024
7 0.0248601 25985 -0.0587732 13399
8 -0.0257005 71775 0.0570578 22580
9 -0.0255608 34042 0.0491359 23323
10 0.0275380 46095 0.0591847 46044
11 0.0248512 79584 -0.0490518 28854
12 -0.0232195 55771 0.0635466 48180
13 -0.0249795 45838 0.0555469 128
14 0.0360649 90 -0.0639735 54273
15 -0.0293146 37492 0.0627561 78725
16 0.0280908 13982 0.0572637 76542 17 0.0250417 21853 0.0543053 52487 18 0.0293981 5461 -0.0507082 62164 19 0.0246079 78601 0.0556747 65913 20 -0.0273830 66197 -0.0637699 67028
Table 5. Analysis of extremes (Gumbel).
Structure Parameters
Rigid Semi-rigid
µ (cm) 2.672 5.645
σ (cm) 0.355 0.512
p 95.0% 95.0%
ϖ 2.970 2.970
α 3.618 2.504
xb 2.512 5.414
Xc 3.333 6.600
Block 6 (3.447 cm) 14 (6.397 cm)
In Table 6 the results of the combined analysis (CA) are indicated. They were obtained through the sum of 48% of the values given by the static analysis (SA) with the values resulting from the analysis for Monte Carlo simulation (MCS), respectively. The parameters used for the sake of comparison have benn the top displacement of the frame (DT), the support reaction (compression force) in the base, that is at the leeward end (RA), and the member force (traction force) in the amount of the windward base (AE).
Table 6. Table of combined analysis.
Structure Parameters SA MCS
CA (48% SA + MCS)
DT (cm) 11.9610 3.4470 9.1880
RA (KN) 5.6413 1.6313 4.3391
Rigid (Bl. 6)
AE (KN) 5.6423 1.6315 4.3398
DT (cm) 25.6040 6.3970 18.6870
RA (KN) 5.2820 1.3248 3.8602
Semi – Rigid
The analysis of Table 6 shows that, considering the dynamic effects of the wind, one obtains smaller values of top displacement than those obtained statistically according to the Brazilian Code NBR-6123 (1987). The same occurs with the extremity actions and foundation reactions.
Comparing the analysis of the frames with rigid connections and with semi-rigid connections, one notices from the values presented in Table 4 and 6 that the top displacements of the frame with semi-rigid joints are approximately two times larger than those obtained for the rigid frame. In the case of the member forces and support reactions, the values obtained considering the semi-rigid joints are slightly smaller than those obtained for the rigid frame.
For the present example, the consideration of the dynamic effects of the wind may lead to a more economic dimensioning of the structure. Moreover, the semi-rigidity consideration may demand caution in respect to the conditions of limit state of service.
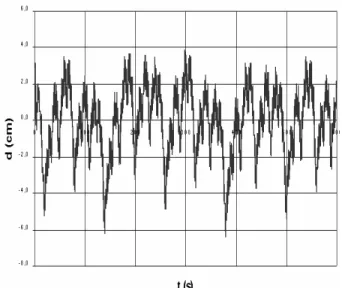
The evolutions of the top displacements (node 21) of the frame with rigid connections and with semi-rigid ones are shown in Fig. 7 and Fig. 8, respectively. Through the analysis of these figures it is noticed that the amplitude of vibration of the semi-rigid frame is greater than the one of the rigid frame.
Figure 7. Evolution of the horizontal displacement of the node 21 (rigid frame).
Figure 8. Evolution of the horizontal displacement of the node 21
(semi-Conclusions
It was verified, at the present work, that the semi-rigidity of the connections can alter significantly the natural frequencies, the correspondent vibration modes and the maximum displacements of the structural frame.
Taking into consideration the specific case of wind loading, the variation of rigidity at the joints may displace the resonant component of the structure, regarding the wind spectrum considered, which alters the distribution and magnitude of the decomposed harmonical components, and, consequently, the entire structural response. The studied example at the present work shows that the combined analysis, in which part of the loading is static and the other part is fluctuating, offers smaller structural responses than the corresponding responses obtained from the respective static analysis.
Acknowledgements
This work was partly supported by CNPq and Capes (Brazil).
References
Associação Brasileira De Normas Técnicas – ABNT, “NBR-6123: Forças Devidas ao Vento em Edificações”. Rio de Janeiro, 1987.
Blessmann, J., “Forças Devidas ao Vento em Edificações Altas”, Porto Alegre CPGEC/UFRGS, 1988 (Caderno de Engenharia, 27).
“Canadian Structural Design Manual”. Supplement N.4 to the National Building Code of Canadá, Ottawa, 1985.
Chan, S. L. & Ming Ho, G. W., “NonlinearVibration Analysis of Steel Frames with Semi-Rigid Connections”, Journal of Structural Engineering, vol.120, pp.1075-1087, 1994.
Davenport, A. G., “The Relationship of Wind Structure to Wind Loading”, Proc: 1st “Conference on Wind Effects on Building and Structures” National Physical Laboratory, Teddington, England, 1965, [Symposium N.16, 26-28/06/1963].
Franco, M., “Direct Along-Wind Dynamic Analysis of Tall Structures”, Boletim Técnico da Escola Politécnica da USP, BT/PEF/9303, São Paulo, 1993.
Guimarães, M. J. R., “Análise Estática e Dinâmica de Torres Metálicas Autoportantes”, Dissertação de Mestrado em Estruturas, Publicação E.DM 001A/00, Departamento de Engenharia Civil e Ambiental, Universidade de Brasília, Brasília, DF, 2000.
Jones, S. W., Kirby, P. A. & Nethercot, D. A., “The Analysis of Frames with Semi-Rigid Connections - A State-of-the-Art Report”, Journal of Constructional Steel Research, vol.3(2), pp.2-13, 1983.
Lee, S., Moon, T., “Moment–rotation model of semi-rigid connections with angles”, Engineering Structures, vol.24, pp.227-237, 2002.
Lui, E. M. & Chen, W. F., “Steel Frame Analysis with Flexible Joints”, Journal of Constructional Steel Research, vol.8, pp.161-202, 1987.
Osman, A., Ghobarah, A. & Korol, R. M., “Seismic Performance of Moment Resisting Frames with Flexible Joints”, Engineering Structures, vol.15, pp.117-134, 1993.
Paz, M., “Dinámica Estructural - Teoría y Cálculo”, Reverté S. A., Barcelona, 1992.
Popov, E. P., Takhirov, S. M., “Bolted large seismic steel beam-to-column connections Part 1: experimental study”, Engineering Structures, vol.24, 1523–1534, 2002.
Sahlit, C. L. & Soares Filho, M., “Influência das Juntas Semi-rígidas no Comportamento Dinâmico de Pórticos Planos”, Congresso Brasileiro de Engenharia Mecânica – COBEM, CD-ROM, Bauru, SP, Brasil, 1997.
Shi, G. & Atluri, S. N., “Static and Dynamic Analysis of Space Frames With Non-Linear Flexible Connections”, International Journal for Numerical Methods in Engineering, vol.28, pp.2635-2650, 1989.
Soares Filho, M., Análise Elástica e Elastoplástica de Pórticos Planos Submetidos a Excitações Dinâmicas com a Consideração de Conexões Semi-rígidas, Dissertação de Mestrado em Estruturas, Publicação E.DM 008A/97, Departamento de Engenharia Civil e Ambiental, Universidade de Brasília, Brasília, DF, 1997.
©
Americanas de Engenharia Estrutural, pp.1791-1800, São Carlos, SP, Brasil, 1997a.
Soares Filho, M. & Sahlit, C. L., “Resposta Dinâmica de Estruturas Semi-rígidas como um Problema de Complementaridade Linear”, Anais do
XVIII Congresso Ibero Latino-Americano sobre Métodos Computacionais para Engenharia (XVIII CILAMCE), pp.127-134, Brasília, Brasil, 1997b.