Engineering
ISSN: 1809-4430 (on-line)
_________________________
1 Universidade Federal de Mato Grosso do Sul/ Chapadão do Sul - MS, Brazil.
USING PASSIVE AND ACTIVE MULTISPECTRAL SENSORS ON THE CORRELATION WITH THE PHENOLOGICAL INDICES OF COTTON
Doi:http://dx.doi.org/10.1590/1809-4430-Eng.Agric.v37n4p782-789/2017
HELOISA B. SOUZA1, FABIO H. R. BAIO2*, DANILO C. NEVES1
2*Corresponding author. Universidade Federal de Mato Grosso do Sul/ Chapadão do Sul - MS, Brazil.
E-mail: [email protected]
ABSTRACT: The investment in precision agriculture technologies has been growing as well the investment in vegetation index sensors with different types of data collection. This study aimed to evaluate the NDVI potential use obtained from passive and active multispectral sensors as phenological parameters indicator of cotton growth. The experiment was conducted in cultivated cotton fields during the harvest seasons of 2013/14 and 2014/15. The phenological variables analyzed in the field, were cotton plant height and number of branches per sampled cotton plant. The active sensors Crop Circle and GreenSeeker were mounted on a manual support. The passive sensor Tetracam was installed on a support positioning the sensor at 4 m height from the ground. NDVI readings are positively correlated with plant height and number of branches per cotton plant. Active sensors present exponential correlations between NDVI and phenological readings. Passive sensor, when installed in a support above the cotton canopy level, presents linear correlation between NDVI and phenological readings. NDVI values obtained by the passive sensor are higher than the active sensors. Filtering the raw NDVI values obtained by passive sensor decreases the adjustment of the regression analyses with cotton height and number of branches per plant.
KEYWORDS: vegetation index, variability, multispectral sensors.
INTRODUCTION
Cotton (Gossypium hirsutum L.) is a perennial plant that has been adapted to grow as an annual crop. The architecture favorable to the mechanization of cotton crop, the adoption of current technologies and the use of inputs, has made the cultivation of cotton to concentrate in the Cerrado region of Brazil(Leal et al., 2009).
Cotton vegetative growth is controlled by the application of a plant growth regulator to balance its growth of vegetative and reproductive structures. In addition, a crop fruit ripener is applied at the end of the crop cycle to stimulate and standardize the opening of the cotton flowers (Echer & Rosolem, 2012). Monitoring growth of phenological plant is important for the determination of the doses recommended for these inputs.Remote sensing techniques can be applied on these phenological evaluations.
Remote sensing techniques, as well the use of vegetation indices (VI) from multispectral optical sensors have an adequate correlation with several attributes of plant growth, such as plant biomass and leaf nitrogen content (Portz et al., 2012; Amaral et al., 2015). Thus, the field can be divided into regions called application zones, according to the spatial variability of VI, which are considered fundamental in the doses prescription of inputs, especially for cotton crop. This enables their rationalized application, and improves efficiency of the agrochemical inputs, decreases costs and increases crop yield (Salvador & Antuniassi,2011; Amaral et al., 2015).
The Normalized Difference Vegetative Index (NDVI) isthe best known and most widely usedVI for the characterization and monitoring crops, allowing for the mapping of the crop and
asubsequent application of inputs in variable rates (Hill et al., 2010).Raper & Varco (2015) found
that the use of VIs containing wavelengths near 700 nm was strongly correlated with the leaf N, total N content and cotton yield fiber. According to Eitel (2008), NDVI is correlated with some biophysical plant variables, such as the leaf area and the mass of green leaves, the water content of leaves and total chlorophyll.
Vegetation phenology such as the crop biomass is difficult to observe from remote sensing sensors. Currently, existing VI are generally applied to estimate seasonal phenological variation in dense crop canopies (Jin & Eklundh, 2014). According to Ma et al. (2001), remote sensing techniques, particularly the multispectral reflectance of the visible and the infrared, can provide data to perform correlations between VIobtained above the plant canopy and the existingcrop biomass,
making it possible to obtain estimates of yields. Walsh et al. (2013) observed this correlation while
working with a NDVI sensor for estimating wheat biomass and evaluating the potential production and grain yield in the winter. These authors concluded that the NDVI has a great potential as an estimator of the wheat crop productivity.
There are several multispectral sensors on the market, with different spatial and spectral resolutions, leading to uncertainties regarding the most appropriate use ofVIin precision agriculture technology. This study aimed to evaluate the NDVI potential use obtained from passive and active multispectral sensors as phenological parameters indicator of cotton growth.
MATERIAL AND METHODS
The experiment was conducted in cultivated cotton fieldsat Amambaí Farm (18°21’S;
52°37’W - 1st experimental year) and at Campo Bom Farm (18º39’S; 52º40’W - 2nd experimental
year), in the municipality of Chapadão do Céu, GO, during the harvest seasons of 2013/14 and 2014/15, respectively.The average annual rainfall in this region is 2,096 mm and the average temperature is 22.5°C. The weather classification, according to Köppen, is tropical climate with a dry season during the winter. The soil classification is dystrophic Red Latosol. The average altitude is 815 m and the land has a slope of 1 to 2%. In both seasons, the cotton variety was FM 975WS
and sown at 0.8 m row spacing with an estimated 100,000 plants ha-1.
The soil was fertilized uniformly using 90 kg ha-1 of potassium and distributed before the
cotton seeding; 82 kg ha-1 of phosphorus was applied at sowing in the furrow using NPK 10-00-52
as a source. Calcium nitrate (27% of N) was used for the post-emergence N fertilization at 81 kg
ha-1 of N, divided into three applications, at 25, 36 and 47 days after emergence (DAE). The
other agricultural inputs (insecticides, fungicides, and herbicides) were applied uniformly during the crop development according to the monitored needs of the crop.
On each experimental year, the field work was performed using a randomized complete block design, represented bymoment of the phenological readings and experimental year. The experimental field was conducted in five randomized blocks and nine replicates for each treatment. Each plot representing VI classes had 10 m in length and width with six rows of plants spaced at 0.80 m. At each sample location, phenological readings of five identified and marked plants around the location were measured to represent the average local variability.
was not measured at the first readings (26 and 29 DAE), once the plant was on the very beginning of the vegetative cycle and there are not available branches.
The NDVI data was collected from the two central rows, discarding the two rows on the
border of each side of the plot. The VI readings were acquired by the active sensorsGreenSeekerTM
RT 200 (Ntech Industries, Ukiah, USA) and Crop CircleTMACS-470 (Holland Scientific, Lincoln,
USA), andby the passive sensor through a multispectral camera TetracamTMADC Lite (Tetracam
Industries, Chatsworth, USA). NDVI was calculated based on [eq. (1)].
(1)
where,
NIR - reflectance value in the near-infrared wavelength;
RED - reflectance value in the red wavelength.
Active sensors were mounted on a manual support, working at 0.80 m above the crop. GreenSeeker emits active radiation and its readings are at two centered wavelengths in red (660 nm) and near-infrared (770 nm) with a bandwidth of 25 nm. The magnitude of the light reflected by the target is measured by the photodiode detector, which determines the reflectance values for the two bands and calculates the NDVI (Ntech Industries, 2016). The wavelengths filters applied on Crop Circle sensorto calculate NDVI were red (670 nm) and NIR (760 nm). The multispectral camera Tetracam (TCAM) contains the green (520-600 nm), red (630-690 nm) and near infra-red (NIR - 760-900 nm) bands and needsthe sunlight radiation, therefore, being classified as a passive sensor (Tetracam Industries, 2016).
In order to capture the images from the camera, Tetracam was installed on a support positioning the sensor at 4 m height from the ground. This height was enough to capture images from the crop in a 1.8 x 2.5 m samplingarea. Raw and filtered NDVI values obtained fromTetracam images were compared in order to relate the effects of soil exposure on the images reflecting over the VI. The filtering process of each camera image was made eliminating the NDVI values related to the soil, according to a supervised classification of the image using the GIS ArcGis 10.4 (ESRI, 2017). According to this classification, the NDVI values lower than 0.299 were eliminated in each scene. The NDVI values considered in each experimental replication plot were the average of all pixels in each image.
The results of the statistical analyzes were obtained by the use of SigmaPlot 11 software. A data normality test by Shapiro-Wilk was performed. Regression analyses were performed between the cotton phenological readings and measured VIs. Correlation analyses were performed among all variables.
RESULTS AND DISCUSSION
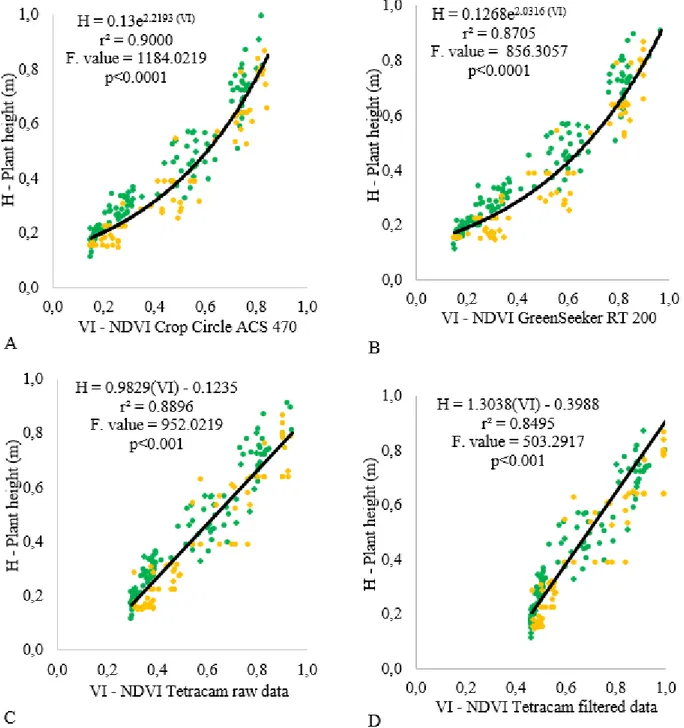
NDVI values were positively correlated with the plant height during the cotton production seasons up to 82 and 98 DAE. Thus, the NDVI readings may be used to estimate the cotton growth. These results are similar to those obtained by Portz et al. (2014). Active sensors presented exponential correlations between plant height and NDVI (Figure 1a and 1b). The passive sensor
presented linear correlations, using raw NDVI or filtered data (Figure 1c and 1d). Motomiya et al.
FIGURE 1. Regression analyses between NDVIcalculated from multispectral sensors and from five phenological moments, and height of the cotton plantscultivated on the harvest seasons 2013/14 (yellow dots) and 2014/15 (green dots).
NDVI readings values in both crop seasons using the passive sensor were higher, with average NDVI value for each image starting above 0.2, even from the first phenological crop readings. The data collected above the cotton canopy by the passive sensor may have presented a minimization of interference caused by the soil due to higher height of the acquiring images above the crop row, capturing a higher proportion of the plant mass than soil, generating higher NDVI values.
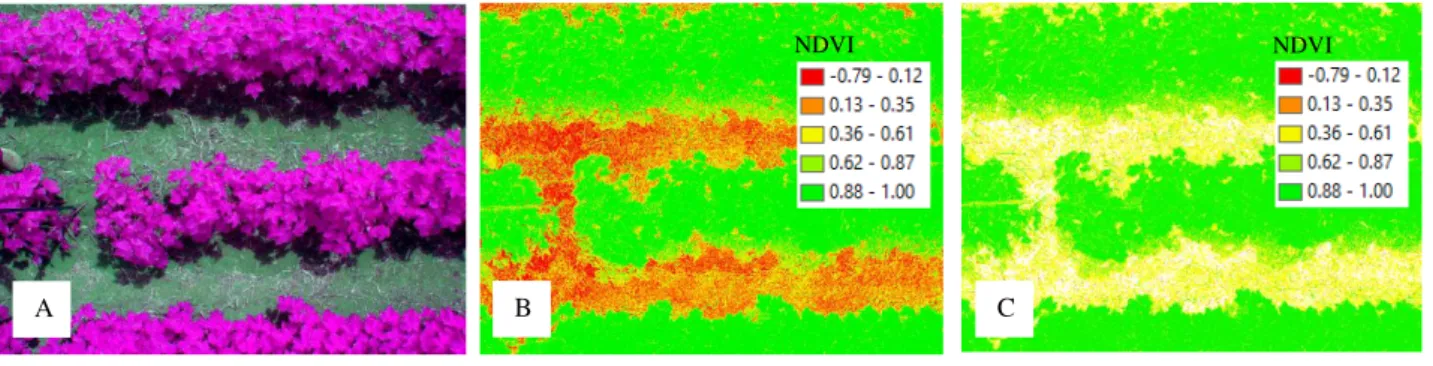
images obtained by the Tetracam camera at the support level (Figure 2) resulted in a high spatial resolution (0.002 m). This spatial resolution reflected over the higher number of sampling data for each calculation of the average NDVI in the scene, from 24,000 sampling records per plot and differing from 50 sampling records per plot obtained by active sensors.
FIGURE 2. Multispectral false color image (A - RGNIR) from Tetracam sensor, raw NDVI image (B - soil and shadows interferences), and filtered NDVI image (C - reduced soil interference).
NDVI values were positively correlated with the number of branches per plant during the cotton production seasons up to 82 and 98 DAE (Figure 3). Active sensors also presented exponential correlations between number of branches per plant and NDVI (Figure 3a and 3b). The passive sensor also presented linear correlations using raw NDVI or filtered data (Figure 3c and 3d). Thus, the NDVI readings may be used not only to estimate the cotton height, but also to estimate the distance in between cotton branches allowing recommendingdoses of plant growth regulator on cotton crops. Cotton growth regulator is applied to balance growth of vegetative and reproductive
structures.Montomiya et al. (2014) used different doses of a growth regulator containing 0, 30 and
60 g ha-1 of the active ingredient chlormequat chloride, applied over a cotton field and obtained a
variation of the NDVI related to these doses.
A B
NDVI NDVI
FIGURE3. Regression analyses between NDVI calculated from multispectral sensors and from four phenological moments, and number of branched per cotton plants cultivated on the harvest seasons 2013/14 (yellow dots) and 2014/15 (green dots).
NDVI sensor values were correlated with the phenological indices of cotton by the Pearson correlation coefficient (Table 1), which has dimensionless values and ranging from -1 to 1. The sign indicates positive or negative direction of the relationship and the value suggests the strength the relation between the variables. The positive values of this correlation considered to be weak range from 0.100 to 0.200, moderate range from 0.300 to 0.490, and strong range from 0.500 to 1.000. The strongest correlation obtained between NDVI sensors was 0.989, coming from the raw datagained by Tetracam and Crop Circle. The strongest correlation obtained between NDVI sensors and phenological readings was 0.960 coming from the raw data gained by Tetracam and cotton height. The lowest correlation but still considered strong was 0.832, obtained by the analyses between the plant height and number of branches per plant. In general, plant height has higher
correlations with NDVI sensors than number of branches per plant. Almeida et al. (2012), studying
spatial variability of biomass production and grain yield, obtained higher correlationvalue by using the same active GreenSeeker sensor, corroborating to the results obtained by Vian et al. (2014), which had a correlation of 0.710.
TABLE1. Pearson correlations between the NDVI of different sensors andphenological measurements of the cotton crop: height and number of branches.
Crop Circle
ACS 470
GreenSeeker RT 200
Tetracam ADC raw data
Tetracam ADC filtered data
Plant height GreenSeeker RT
200 0.988*
Tetracam ADC raw
data 0.989* 0.986*
Tetracam ADC
filtered data 0.977* 0.971* 0.970*
Plant height 0.955* 0.948* 0.960* 0.943*
N. of branches 0.892* 0.880* 0.853* 0.889* 0.832*
*:P values significant for the 1% level by Pearson’s correlation.
higher quality and higher resolution are basic requirements for applications in precision agriculture in order to obtain reliable results. Vian et al. (2014), studying digital images in corn cropfor the purposes of soil, straw, and corn plant coverage classificationobtained a high correlation value
between the percentage of this plant’s coverage in relation to the soil and itsyield. According to the
authors, high percentages of plant coverage resulted in less soil and straw interference in the final
image result.Samseemoung et al. (2012), studying remote sensing at low altitude and
capturingimages by different platforms in soybeancrop observed that the crane is more stable as a support in the acquisition of the scenes, leading to a higher quality of the final result when compared to the use ofthe unmanned air vehicle.
Several authors used NDVI in studies correlating VI with some phenological indices in different agricultural crops such asEitel (2008), Salvador & Antuniassi (2011), Almeida et al. (2012), Walsh et al. (2013) and Gehrke & Greiwe (2013); however, VI often suffers variations caused by local conditions, by the mode of application or by characteristics that are intrinsic to the sensors, such as spatial and spectral resolution. Therefore, studies involving NDVI should be properly characterized related to its condition of use, and comparative results between experiments must be analyzed carefully.
CONCLUSIONS
NDVI readings are positively correlated with plant height and number of branches per cotton plant. Active sensors present exponential correlations between NDVI and phenological readings. Passive sensor, when installed in a support above the cotton canopy level, presents linear correlation between NDVI and phenological readings.
NDVI values obtained by the passive sensor are higher than the active sensors.
Filtering the raw NDVI values obtained by passive sensor decreases the adjustment of the regression analyses with cotton height and number of branches per plant.
ACKNOWLEDGEMENTS
We would like to thank FUNDECT and CNPq for the financial support, andAmanbaí and Campo Bom farmsfor the technical support.
REFERENCES
Almeida D, Bredemeier C, Rosa AT, Perin J, Schmitz JF (2012) Sensor óptico ativo para estudo da variabilidade espacial da biomassa e sua relação com a produtividade em trigo. In: Congresso Brasileiro de Agricultura de Precisão. Ribeirão Preto. Anais... Jaboticabal, SBEA, 1 CD-ROM.
Amaral LR, Molin JP, Portz G, Finazzi FB, Cortinove L (2015) Comparison of crop canopy reflectance sensors used to identify sugarcane biomass and nitrogen status. Precision Agriculture 16(1):15-28.
Echer FR, Rosolem CA (2012) Plant growth regulator losses in cotton as affected by adjuvants and rain. Ciência Rural 42(12):2138-2144.
Eitel JUH (2008) Combined spectral index to improve ground-based estimates of nitrogen in dryland wheat. Agronomy Journal 100(6):1694-1702.
ESRI. ArcGIS Available:http://www.esri.com/en/arcgis/products/arcgis-pro/overview. Accessed: May 26, 2017.
Gehrke R, Greiwe A (2013) Multispectral image capturing with foveon sensors. International Archives of the Photogrammetry 15(2):151-156.
Hill J, Udelhovem T, Vohland M, Stevens A (2010) The use of laboratory spectroscopy and optical remote sensing for estimating soil properties. In: Oerke EC, Gerhards R, Menz G, Sikora RA
Iqbal J, Read JJ, Whisler FD (2013) Using remote sensing and soil physical properties for
predicting the spatial distribution of cotton lint yield. Turkish Journal of Field Crops 18(2):158-165.
Jin H, Eklundh L (2014) A physically based vegetation index for improved monitoring of plant phenology. Remote Sensing of Environment152:512-525.
Koundauri P, Nauges C, Tzouvelekas V (2006) Technology adoption under production uncertainty: theory and application to irrigation technology. American Journal of Agricultural Economics 88(3):657–670.
Leal AJF, Tosta FS, Anselmo JL, Furlani JE (2009) Comportamento de do algodoeiro cultivado em região de cerrado com diferentes espaçamentos e densidades de plantas. In: Congresso Brasileiro do Algodão. Foz do Iguaçu. Anais... Campina Grande: Embrapa Algodão. CD-ROM.
Ma BLB, Dwyer LM, Costa C, Cober ER, Morrison MJ (2001) Early prediction of soybean yield from canopy reflectance measurements. Agronomy Journal 93(6):1227-1234.
Montomiya AVA, Valente IMQ, Molin JP, Motomiya WR, Biscaro GA, Jordan RA (2014)
Vegetation index in cotton under rates of nitrogen and growth regulator. Revista Semina 35(1):169-178.
Motomiya AVA, Molin JP, Chiavegato EJ (2009) Utilização de sensor óptico ativo para detectar deficiência foliar de nitrogênio em algodoeiro. Revista Brasileira de Engenharia Agrícola e Ambiental 13(2):137-145.
Ntech Industries. Model 505GreenSeeker Hand Held ™Optical Sensor Unit: Operating Manual.
Available:http://www.trimble.com/Agriculture/greenseeker.aspx. Accessed: Jun26, 2016.
Portz G, Molin JP, Jasper J (2012) Active crop sensor to detect variability of nitrogen supply and biomass on sugarcane fields. Precision Agriculture 13(1):33-44.
Raper TB, Varco JJ (2015) Canopy-scale wavelength and vegetative index sensitivities to cotton growth parameters and nitrogen status. Precision Agriculture 16(1):62-76.
Salvador A, Antuniassi UR(2011) Imagens aéreas multiespectrais na identificação de zonas de manejo em áreas de algodão para aplicação localizada de insumos. Revista Energia na Agricultura 26(2):01-19.
Samseemoung G, Soni P, Jayasuriya HPW, Salokhe VM (2012) Application of low altitude remote
sensing (LARS) platform for monitoring crop growth and weed infestation in a soybean plantation.
Precision Agriculture 13(6):611-627.
Steinvall O, Chevalier MET, Gustafsson O (2013) Active and passive short-wave infrared and near-infrared imaging for horizontal and slant paths close to ground. Applied Optics 52(20):4763-4778.
Tetracam Industries Agricultural Digital Camera User’s Guide. Chatsworth. Available:
http://http://www.tetracam.com/Products-ADC_Lite.htm. Accessed: May 18, 2016.
Walsh OS, Klatt AR, Solie JB, Godsey CB Raun WR (2013) Use of soil moisture data for refined
GreenSeeker sensor based nitrogen recommendations in winter wheat (Triticum aestivum
L.) Precision Agriculture 14(3): 343-356.