Carlos Pestana Barros & Nicolas Peypoch
A Comparative Analysis of Productivity Change in Italian and Portuguese Airports
WP 006/2007/DE _________________________________________________________
Mariya Gubareva & Maria Rosa Borges
Typological Classification, Diagnostics, and Measurement of Flights-to-Quality
WP 15/2013/DE/UECE _________________________________________________________
Department of Economics
W
ORKINGP
APERSISSN Nº 0874-4548
School of Economics and Management
Typological Classification, Diagnostics, and Measurement of
Flights-to-Quality
MARIYA GUBAREVA1
mariya.gubareva@phd.iseg.utl.pt
ISEG (School of Economics and Management) of the
Technical University of Lisbon
Rua Miguel Lupi, 20
1249-078 Lisbon
Portugal
MARIA ROSA BORGES2
mrborges@iseg.utl.pt
ISEG (School of Economics and Management) of the
Technical University of Lisbon
UECE (Research Unit on Complexity and Economics)
Rua Miguel Lupi, 20
1249-078 Lisbon
Portugal
1
Financial support provided by the Fundação para a Ciência e Tecnologia/FCT under the POPH/FCE program.
2 Financial support provided by the Fundação para a Ciência e Tecnologia/FCT under the FCT/POCTI program, partially
Typological Classification, Diagnostics, and Measurement of Flights-to-Quality
Abstract
This paper proposes a total return-based framework to study flight-to-quality phenomenon
of fixed-income securities. It consists of three elements: (i) the general definition of event;
(ii) the typological classification of the phenomena to be able associate them with the
phases of business cycle; (iii) automated technique to diagnose the time frames and to
measure the impact of flight-to-quality on debt instruments. The proposed framework is
applied to analyse capital movements from Emerging Markets public debt to the U.S.
Treasuries and vice versa within the period 1998-2010. The results show that different
phases of business cycles and GDP rates behaviours, including turning points, could be
associated with flights-to-quality of different types and nature.
JEL codes: G11, G15.
1. Introduction
The flight-to-quality phenomenon, when investments fly from risky to safe financial
instruments, has been attracting a considerable scientific interest (Jones, 2012), He and
Krishnamurthy, 2012; and Briere et al., 2012). Although varied research has been dedicated
to these phenomena and their economic drivers, still there is a lack of a universal, generally
accepted, definition of these episodes. Thus, the definitions of the flight-to-quality event
used by diverse authors usually depend on the purpose of the respective research (Lei and
Wang, 2012).
For example, Bernanke et al. (1996) and Alfaro et al. (2006) ascribed to flight-to-quality
such situations when lower quality borrowers struggle to obtain finance. On the other hand,
Goyenko and Ukhov (2009) and Naes et al. (2011), analysing the liquidity dynamics of
diverse asset classes, define flight-to-quality events as an increase of investors’ preferences
for the most liquid securities. Alternatively, Baur and Lucey (2009) and Inci et al. (2011),
examining the correlation between various markets, describe flight-to-quality as a period
when the correlation between a chosen pair of markets decreases, while the performance of
the riskier market drops. As our present paper evidences, these definitions are quite
restrictive, as, for instance, in the case of emerging markets, flight-to-quality events can be
observed while correlation between safe and risky assets performance holds and, in some
cases with increasing prices of risky assets. Thus, additional research in this field remains
highly desirable and the creation of a general framework for flight-to-quality analyses is
needed.
This paper presents a total return-based framework for flight-to-quality studies focusing on
fixed-income securities. Our methodology sheds light on the nature of this type of events
and widens the set of approaches available to research these phenomena. First, the proposed
definition of flight-to-quality phenomenon is based on the comparison of safe and risky
assets performance, instead of analysing differential spreads (Blinder and Zandi, 2010)
and/or short-run correlations (Bunda et al., 2010). Second, we propose a typological
classification of flight-to-quality events, based on the interest rate dynamics and total
returns behaviour of safe and risky securities. The type of flight-to-quality event depends
while the other moves down. This typological classification envisages taking into
consideration the economic conditions under which a flight-to-quality occurs. Third, the
total return-based technique we apply allows identifying the time frames and the strength of
the events. This technique improves the widely applied differential spread-based
approaches (Fuerst et al., 2011), which are based on the spread between the yields of bonds,
and thus represent a relative measure of the impact of flight-to-quality events, but provide
no information about the separate dynamics of safe and risky assets. To the best of our
knowledge, the vast majority of research in this field focus either on what happens within
the flight-to-quality event, or on its influence on the economy and on the welfare of society
(Caballero and Kurlat, 2008). We take the different approach of focusing also on what
happens before the ignition of a flight-to-quality and after its termination. We compare the
performance of risky and safe assets returns prior, within, and after the event. Our proposed
total return-based framework is applied to the study of flights-to-quality out of risky
sovereign emerging market bonds towards the safety of U.S. Treasury bonds over the
period from January 1998 to December 2010.
The rest of the paper is organized as follows. Section two presents the proposed working
definition of Flight-to Quality events and their subsequent typology. Section three describes
the methodology for the ex-post diagnostics of flight-to-quality time frames and their
impact on security values. The application for the case of flights between risky sovereign
emerging market bonds and the safe U.S. Treasury bonds over the period from 1998 to
2010 and their typological classification are provided in section four. Conclusions are
presented in the section five.
2. Definition and Typology of Flight-to-Quality
The first part of our framework is the flight-to-quality definition, which is based on the
performance of assets measured in terms of total returns.
Definition: A flight-to-quality event is an investment migration from risky to safe assets
leading to an underperformance of total returns of risky assets when compared to the total
The underperformance of risky assets is usually caused by a sudden drop in risk appetite
and increase in risk aversion. Thus, a quantification of the investors´ appetite for safe and
risky assets becomes potentially insightful for deepening the comprehension of
flight-to-quality events.
The second component of our framework is the typological classification of the
flight-to-quality events. A two-level classification is proposed, as summarized in Figure 1.
Figure 1: Summary of the Flight-to-Quality Typological Classification.
The types of events are defined according to the behaviour of two observable parameters:
(i) the dynamics of the risk-free interest rate and (ii) the dynamics of the risk premium or
spread of risky asset over safe securities. The type of flight-to-quality itself provides
information on both parameters: the sign of the risk-free interest rate change (1st type versus
2nd type) and the relative strength of the risk aversion, where the spread is either superior or
inferior to the change in the risk-free interest rate (1.A subtype versus 1.B subtype).
The typology we propose is a theoretical attempt to deepen the flight-to-quality
understanding and to put the phenomenon in the context of the economic environment. In
the majority of previous research only 1.A subtype events are identified and analysed. We
they can provide possible warning signals of upcoming changes in the business cycle. The
typology is used to interpret the results obtained from the application of the methodology
we describe below.
3. Flight-to-Quality Diagnostics
The third element of our proposed framework is a total return-based automated technique to
identify the occurrence of flight-to-quality events, measuring their impact and delimiting
the start and end dates (time windows) of their occurrence. The general concept resides in
the quantitative difference in the aggregate performance of risky and safe assets. The
methodology is defined by the following four steps:
First Step
For each rolling anchor date (AD) of a chosen n-day long interval, a set of n different
subjacent sub-intervals is considered; the anchor date is fixed, while the initial dates go
from 1 to n days back into the past. Then, the n values of percentage returns of the risky
asset total return index (further on referred to as risky assets index) and the respective n
values of percentage returns of the safe asset total return index (further on referred to as
safe assets index) are computed. Thus, the n different initial dates are employed in the
consecutive return calculations using in each turn the same final date, or anchor date. This
means that each time after the rolling anchor date (AD) is fixed, the algorithm goes by 1
-day steps into the past until the chosen n-day limit, i.e. the date AD−n, is reached. Thus, the
first step can be represented by:
( , )= (( ))− 1 (1)
where Index stands for safe (risky) assets index; is the return of safe (risky) assets
index; is an anchor date consecutively assuming all the dates within the analyzed
index is calculated. Here ∈ 1, while could be thought as the largest analyzed
flight-to-quality window.
Second Step
The differences between the returns of safe and risky assets indexes (∆ ) are to be
computed by the following formula:
( ) = ( , )− ( , ) (2)
where ∈ 1, .
Third Step
The search for the maximum delta ∆ ( !)" for each anchor date (AD) is performed and
the maximum value out of the n values of the return differences between safe and risky
assets indexes is identified. This could be written as follows:
∆ ( !) = MAX
&',(,…, ∆ ( )" (3)
In parallel, the number of days ( ), which corresponds to ∆ ( !), is stored as * . It is
worth noting that the length of the sub-interval * which maximizes the difference in
returns for each anchor date, is not fixed and varies from one anchor date to the next, and so
on. In the fourth step of the algorithm, this number * will be used for determining the
initial dates of flight-to-quality events.
This procedure is repeated for all dates in the period under analysis, each date, in turn,
being defined as an anchor date other. For each of the rolling anchor dates, the values of
their respective ∆ ( !) (maximized as a function of the parameter k according to the above
equation 3) are used to build the respective curve of maximum differences between safe
Figure 1: Maximum differences between safe and risky assets total returns in percentage of the initial
indexes’ values observed NAD days prior to the anchor date (AD).
Abscissa of each point of the curve illustrated in Figure 1 corresponds to the rolling anchor
date (AD). In its turn, an ordinate is the maximum difference in returns of safe and risky
assets indexes within n sub-intervals of the n-day long window. The local maxima of the
∆ ( !) curve, marked by dashed ovals in Figure 1, are the end dates (+ ) of the
flight-to-quality events. This can be comprehended as follows. Prior to a chosen local maximum
date, corresponding to the flight-to-quality end date (+ in bold) the flight-to-quality
impact on the total returns difference is strengthening with time; see point A in Figure 1.
On the other hand, posterior to the same chosen local maximum date (+ in bold), the
difference in the total returns along the time scale is decaying; see point B in Figure 1. That
is the reason why the local maximums of the ∆ ( !) curve are considered to determine the
end dates (+ ) for the preceding them flight-to-quality events. This is what one would
expect to observe and what in fact is observed while searching for flight-to-quality end
dates (+ ).
Fourth Step
For the identified end dates (+ ), the difference ∆ ( ,, ) ! " is maximized as a function of
-∆ ( !) = MAX &',(,…, (, ,, )− (, ,, )" (4)
where - = + − .
Here the use of end date (+ ) instead of anchor date ( ) means that only the end dates of
flight-to-quality (+ ), identified in the previous third step of the algorithm, are employed
and not all the rolling anchor dates. Using the parameter * , mentioned in the third step of
the algorithm, which is the number of days of a flight-to-quality event, the initial date (- )
is expressed, as follows:
- = + − *, (5)
Summarizing, the essence of the algorithm is: first, determining the end date (+ ) of the
flight-to-quality event, which corresponds to the local maximum of the safe and risky total
return difference of the considered rolling periods; second, determining the initial date (- ),
which corresponds to the maximum difference between safe and risky total returns for the
identified flight-to-quality end date (+ ). Finally, in the selection process of
flight-to-quality-like events to be included in the sample, ∆ ( ,, ) ! must exceed a pre-defined
hurdle, or event impact parameter (+-/). The greater the value of this selection filter
criterion, the more impactful are the flights-to-quality identified and the smaller is their
number within the period under analysis.
4. Application
Data and imposed conditions
The proposed flight-to-quality identification methodology described in section three is
applied to detect the time windows of flights out of the emerging market fixed income
securities described by the J.P. Morgan EMBI-Global index (further on referred as EMBI)
iBoxx Ltd (further on referred as ITRROV) in the period from January 1998 to December
2010.
The trial maximum duration of flight-to-quality events (n) is assumed to be 45 working
days as the analyzed phenomena is typically a short-run event, very concentrated in time.
For example, Mandelbrot and Hudson (2002) claim that sharp drops and rises in prices
occur within very limited and narrowed periods of time. Additionally, the spread of the
aggregated yield of emerging markets debts over aggregated yield of U.S. Treasury is
examined. As a result, we find that the 45-day period is an appropriate time window for
flight-to-quality events.
The +-/, or the hurdle difference between the EMBI and ITRROV, is defined as three
different levels, 1%, 2% and 3%. Such limits imposed to the total returns differences are
considered to characterize the notion of “investment migration” and allow for gradual
analysis of the complex structure of flights-to-quality.
Internal structure of flights-to-quality
When analyzing flight-to-quality events, it is important to take into account that there are
situations when the same initial date (- ) corresponds the different consecutive end dates
Figure 2: Decomposition of the aggregated flight-to-quality (27.03.2000 – 22.05.2000) into the series of four
weaker flights-to-quality, indicated by the dashed arrows.
Such aggregated flight-to-quality could be decomposed into a set of weaker
flights-to-quality. Thus, for each identified end date (+ 0), with the exception for + ', an
intermediate initial date (- 0) lying between + 0 ' and + 0 should be determined.
Consequently, the identified aggregated flight-to-quality can be alternatively analyzed as if
it was composed of four weaker flights-to-quality, as represented in Table 1.
Table 1: Decomposed flight-to-quality (27.03.2000 – 22.05.2000).
In Table 1, ∆ stands for a strength of flight-to-quality being the difference between ITRROV
and EMBI returns in percentage in respect to the initial date (- 0) indexes’ values. The
shadowed cells represent the earliest initial date (- ') and the latest end date (+ 1)
corresponding to the highest maximum difference in the returns of the ITRROV and EMBI
∆ (, ) !_, 3 _45_ 6 78".
Results
Our proposed methodology results in an identification of the initial and the end dates of 133
flight-to-quality events with the difference in the ITRROV and EMBI total returns over 1%,
74 events with the difference in the ITRROV and EMBI total returns over 2%, and 50 events
with the difference in the ITRROV and EMBI total returns higher than 3%.
Our results are represented on an annually basis in Tables 2-14, where shadowing indicates
the initial (- ) and final (+ ) dates of the aggregated flights-to-quality, as well as their
aggregate strengths and the sets of minor events identified within the aggregated time
Table 2: Identified flight-to-quality events and their impacts in 1998.
Table 5: Identified flight-to-quality events and their impacts in 2001.
Table 6: Identified flight-to-quality events and their impacts in 2002.
Table 8: Identified flight-to-quality events and their impacts in 2004.
Table 9: Identified flight-to-quality events and their impacts in 2005.
Table 10: Identified flight-to-quality events and their impacts in 2006.
Table 12: Identified flight-to-quality events and their impacts in 2008.
Table 13: Identified flight-to-quality events and their impacts in 2009.
Table 14: Identified flight-to-quality events and their impacts in 2010.
Tables 2 to 14 contain the initial (- ) and final dates (+ ) of the flight-to-quality
between the ITRROV and EMBI indexes from the beginning to the end of the subjacent
phenomenon compared to the event impact parameter (+-/) limit conditions in order to
demonstrate that the selection of flight-to-quality is dependent on the minimal strength of
the events to be selected for specific analyses.
Economic interpretation of flights-to-quality over 1998-2010
All 133 identified flights-to-quality are classified in accordance with the proposed
Typology. 100 events out of 133 are ascribed to the 1.A subtype; 11 episodes are of 1.B
subtype; and 22 cases belong to the 2nd type of flight-to-quality. The relationship between
the occurrences of the 1.A subtype, 1.B subtype, the 2nd type of flight-to-quality and the
economic growth rates is graphically analyzed. The U.S. and the World annual GDP
growth rates, according to the World Bank data, are considered for this study.
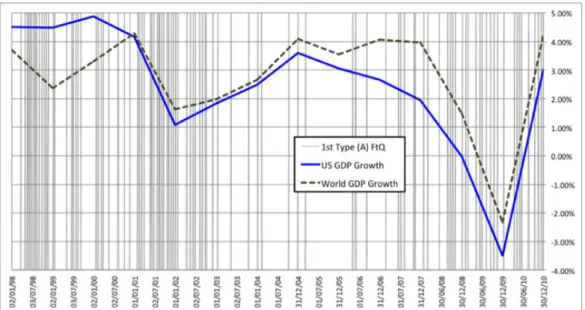
The higher frequency of 1.A subtype events coincides with the decreasing slope of GDP
growth rate. They predominantly happen over the periods of economic slowdown and
contraction (see Figure 3). Within the analyzed period, those phases could be associated
with 1998 (Russian bond default and other emerging market distresses), the first half of
2000 (Dotcom crash), 2001 – 2002 (September 11 attack and war on terror, Brazil
presidential election uncertainty), and the second quarter of 2007 – 2010 (U.S. subprime
Figure 3: Occurrences of the flights-to-quality of the 1st Type, Subtype A, along with the U.S. and the World
annual GDP growth rates over 1998 – 2010.
The flights-to-quality of 1.B subtype are observed prior to the turning points of GDP rate
dynamics (see Figure 4). Their major concentration coincides with the turning point when
the accentuated slowdown of the GDP growth rate curves begins, especially so in case of
the World GDP (2007 - 2008). Thus, 1.B subtype events could eventually alarm of
upcoming changes from an economic growth to a slowdown and visa versa. It is worth
noting that diagnostics and analyses of the flight-to-quality, obeying to characteristics of
1.B. subtype, are addressed for the first time.
Figure 4: Occurrences of the flights-to-quality of the 1st Type, Subtype B, along with the U.S. and the World
The major concentrations of the 2nd type of identified flights-to-quality coincide with the
increase in GDP growth rate (see Figure 5). Events of the 2nd type mostly happen over the
periods of an accelerated growth and economic expansion. Generally, within the analysed
period these phases could be associated with 1999 and 2000 (Technological boom); 2002 –
2007 (global economic expansion and emerging markets growth), and the last quarter of
2010 (partial recovery from the global financial crisis).
Figure 5: Occurrences of the flights-to-quality of the 2nd Type along with the U.S. and the World annual
GDP growth rates over 1998 – 2010.
5. Conclusions
This study proposes a total return-based framework to analyse flight-to-quality events. This
framework is based on three components.
The first component is the general definition of flight-to-quality event, based on the
comparative behaviour of safe and risky assets total returns. The definition is applicable to
diverse asset classes and it is not restricted only to the fixed-income origination-destination
pairs of securities, mutually affected during flight-to-quality episodes. Thus, the performed
elaboration of general definition of flight-to-quality in terms of the total returns instead of
absence of the universal definition of the phenomenon while many researches have been
dedicated to the study these phenomena.
The second component is the development of a typological classification of
flights-to-quality. In accordance with the proposed typology, two types of flight-to-quality are
distinguished. The first type, which is the most common for deteriorating economic
conditions, crisis phases, and also turning points, leads to a decrease of the risk-free interest
rate. On the other hand, the second type, which is rather rare, is accompanied by a decrease
in the safe asset performance due to the expansion of the overall economic activity. The 1st
type flight-to-quality events are then segregated into the two subtypes. The 1.A. subtype
phenomena, with decaying total returns of the risky assets, are the most frequent episodes
under a slowdown of the economy. The important insight of this research is the attribution
of the 1.B. subtype phenomena, characterized by the increase in total returns of both safe
and risky assets, to the initial worries of investors in respect to the future changes in the
course of the economy. Therefore, these events can be interpreted as indicators of
upcoming turning points in general, and in particular as warnings of an approaching
slowdown in economic activity.
The third component of the framework is related to the automated identification algorithm.
The objective of the proposed diagnostics methodology is to detect the time windows and
the strength of the occurred flights-to-quality within the considered historical period. The
proposed methodology represents an important progress as it gives a new insight into the
analysis of circumstances under which flights-to-quality occur, allowing automatic
detection of the initial and final dates of the studied episodes.
The total return-based framework is applied to the analyses of investment flights out of
emerging market securities towards U.S. Treasury bonds within 1998-2010. 133
flight-to-quality events are identified, measured, and classified. All the diagnosed flights-to-flight-to-quality
are put in the context of the economic environment depending on their types. This study
suggests the validity of the economic interpretation ascribed to the two types and two
subtypes of flight-to-quality. Our research also indicates that such a framework can be a
References
Alfaro, R., Garcia, F., and Jara, A. (2004), Bank Lending Channel and the Monetary Transmission
Mechanism: The Case of Chile. Working Paper 223. Central Bank of Chile.
Bernanke, B., Gertler, M., and Gilchrist, S. (1996), The Financial Accelerator and the . The Review of Economics and Statistics 78(1), 1 15.
Blinder, A. and Zandi, M. (2010), How the Great Recession Was Brought to an End. Working Paper.
Princeton University.
Briere, M., Chapelle, A., and Szafarz, A. (2012), No Contagion, Only Globalization and Flight-to-Quality.
Journal of International Money and Finance 31(6), 1729-1744.
Bunda, I., Hammann, J., and Lall, S. (2010), Correlations in Emerging Market Bonds: The Role of Local and
Global Factors. Working Paper 10/6. International Monetary Fund.
Caballero, R. and Kurlat, P. (2008), Flight-to-Quality and Bailouts: Policy Remarks and a Literature Review.
Working paper 08-21. MIT Department of Economics.
Fuerst, F., McAllister, P., and Sivitanides, P. (2011), Flight-to-quality? An investigation of the attributes of
sold properties in hot and cold markets. Working Paper. University of Reading.
Goyenko, R. and Ukhov, A. (2009), Stock and Bond Market Liquidity: A Long-Run Empirical Analysis.
Journal of Financial and Quantitative Analysis 44(1), 189-212.
He, Z. and Krishnamurthy, A. (2012), A Model of Capital and Crises. Review of Economic Studies 79(2), 735-777.
Inci, A., Li, H., and McCarthy, J. (2011), Measuring Flight-to-Quality: a Local Correlation Analysis. Review of Accounting and Finance 10(1), 69-87.
Jones, E. (2012), Eurobonds, Flight to Quality, and TARGET2 Imbalances. European Policy Analysis 4, 1-12. Lei, Q. and Wang,H. (2012), Flight-to-Liquidity due to Heterogeneity in Investment Horizon. China Finance
Review International 2(4), 316-350.
Mandelbrot, B. and Hudson, R. (2004), The (Mis) Behavior of Markets. London: Profile.