ANA CATARINA MOREIRA PINTO
ASSOCIATION BETWEEN ANTHROPOMETRIC INDICATORS OF NUTRITIONAL STATUS AND LENGTH OF STAY IN HOSPITALIZED PATIENTS
Universidade Fernando Pessoa Faculdade Ciências da Saúde
1
ANA CATARINA MOREIRA PINTO
ASSOCIATION BETWEEN ANTHROPOMETRIC INDICATORS OF NUTRITIONAL STATUS AND LENGTH OF STAY IN HOSPITALIZED PATIENTS
Universidade Fernando Pessoa Faculdade Ciências da Saúde
2
Ana Catarina Moreira Pinto
Association Between Anthropometric Indicators of Nutritional Status and Length of Hospital Stay in Hospitalized Patients
________________________________ (Ana Catarina Moreira Pinto)
Orientadora:
Prof. Doutora Rita Guerra
Trabalho Complementar apresentado à Universidade Fernando Pessoa como parte dos requisitos para obtenção do grau de licenciado em Ciências da Nutrição
3
Association Between Anthropometric Indicators of Nutritional Status and Length of Hospital Stay in Hospitalized Patients
Ana C. Pinto1, Ana S. Sousa2, Teresa F. Amaral3,4, Rita S. Guerra1,4 1-Faculdade de Ciências da Saúde, Universidade Fernando Pessoa 2-Instituto Politécnico de Leiria
3-Faculdade de Ciências da Nutrição e Alimentação, Universidade do Porto 4-UISPA – INEGI/LAETA
Corresponding author:
Ana Catarina Moreira Pinto
Faculdade Ciências da Saúde, Universidade Fernando Pessoa Rua Carlos da Maia, 296 | 4200-150 Porto
E-mail: [email protected]
Short title: Anthropometric indicators and length of hospital stay Word count: 5941
Number of tables and figures: 3
4 Index Abstract ... 6 Resumo ... 7 Introduction ... 8 Methods ... 9 Results ... 12 Discussion ... 13 Conclusion ... 16 Acknowledgements ... 16 References ... 16 Table 1. ... 21 Table 2 ... 23 Figure 1 ... 25 Appendix I ... 27
5
List of abbreviations and acronyms
AMA - Mid-upper arm muscle area
AMC - Mid-upper arm muscle circumference APMT - Adductor pollicis muscle thickness BMI - Body mass index
CI - Confidence intervals HR - Hazard ratio
IQR - Interquartile range LOS - Length of stay
MUAC - Mid-upper arm circumference
PG-SGA - Patient-Generated Subjective Global Assessment TST - Triceps skinfold thickness
6
Abstract
Background: Undernutrition is highly prevalent in hospitalized patients worldwide and
this condition has been associated with increased hospital length of stay (LOS). The diagnosis of undernutrition includes anthropometric measurements. The aim of this study was to measure the independent association of the anthropometric and derived indicators triceps skinfold thickness (TST), mid-upper arm circumference (MUAC), adductor pollicis muscle thickness (APMT), mid-upper arm muscle area (AMA) and mid-upper arm muscle circumference (AMC) with LOS, within a varied group of hospitalized patients.
Methods: A total of 695 patients were enrolled in a prospective observational study,
conducted in a Portuguese university hospital. Participants were dichotomized for the anthropometric and derived indicators TST, MUAC, APMT, AMA and AMC according to the percentiles 5th and 25th described in the literature, except for APMT, for which only the 5th percentile was used. Cox regression analysis was used to estimate adjusted hazard ratios (HR) and corresponding 95% confidence intervals (95% CI).
Results: Patients that presented values lower than the 5th percentile for TST (HR=0.759, 95% CI=0.579;0.995), MUAC (HR=0.822, 95% CI=0.687;0.983), APMT (HR=0.791, 95% CI=0.671;0.933), AMA (HR=0.797, 95% CI=0.660;0.962) and AMC (HR=0.746, 95% CI=0.611;0.911), showed a lower probability of being discharged from the hospital to usual residence over time. For TST (HR 0.798, 95% CI=0.673;0.946), patients whose values were below the 25th percentile also presented a lower probability of being discharged from the hospital to usual residence over time.
Conclusion: For all the anthropometric and derived indicators studied, patients that
presented values lower than the 5th percentile had a lower probability of being discharged from the hospital to usual residence. For TST, values below the 25th percentile were also associated with lower probability of discharge. Thus, TST was found to be the best anthropometric indicator to predict LOS. This anthropometric indicator can present advantages for the diagnosis of undernutrition since it may allow an earlier detection of a poor nutritional status.
Key-words: Triceps skinfold thickness, Mid-upper arm circumference, Adductor pollicis
muscle thickness, Mid-upper arm muscle area, Mid-upper arm muscle circumference, Hospital length of stay, Undernutrition, Survival analysis.
7
Resumo
Introdução: A desnutrição apresenta elevada prevalência em doentes hospitalizados e
esta condição tem vindo a ser associada com maior tempo de internamento (TI). O diagnóstico da desnutrição inclui indicadores antropométricos. O objetivo deste trabalho foi estudar a associação independente entre os indicadores antropométricos prega cutânea tricipital (PCT), perímetro do meio braço (PB), espessura do músculo adutor do polegar (AP), área muscular do braço (AMB) e perímetro muscular do braço (PMB) e o TI em doentes hospitalizados.
Métodos: 695 indivíduos participaram num estudo observacional realizado num hospital
universitário Português. Os participantes foram dicotomizados para cada indicador antropométrico PCT, PB, AP, AMB e PMB de acordo com os percentis 5 e 25 descritos na literatura, exceto para o AP, para o qual apenas o percentil 5 foi utilizado. Utilizaram--se modelos de regressão de Cox para calcular os hazard ratios (HR) e os intervalos de confiança a 95% (IC 95%) correspondentes.
Resultados: Os participantes que apresentaram valores abaixo do percentil 5 para PCT
(HR=0,759; IC 95%=0,579;0,995), PB (HR=0,822; IC 95%=0,687;0,983), AP (HR=0,791; IC 95%=0,671;0,933), AMB (HR=0,797; IC 95%=0,660;0,962) e PMB (HR=0,746; IC 95%=0,611;0,911), revelaram uma menor probabilidade de alta para o domicílio. Para a PCT (HR=0,798; IC 95%=0,673;0,946), apresentar valores abaixo do percentil 25 também se associou a uma menor probabilidade de alta para o domicílio.
Conclusão: Os participantes que apresentaram valores abaixo do percentil 5 para todos
os indicadores antropométricos mostraram uma menor probabilidade de alta domiciliar. Para a PCT, o percentil 25 também foi associado com uma menor probabilidade de alta para o domicílio. A PCT foi então o melhor indicador antropométrico capaz de prever o TI hospitalar. Incluir este indicador antropométrico nos métodos de diagnóstico de desnutrição pode ser uma mais valia por poder detetar mais precocemente um pior estado nutricional.
Palavras-chave: Prega cutânea tricipital, Perímetro do meio braço, Espessura do
músculo adutor do polegar, Área muscular do braço, Perímetro muscular do braço, Tempo de internamento hospitalar, Desnutrição, Análise de Sobrevivência.
8
Introduction
Undernutrition is highly prevalent in hospitalized patients worldwide. In developed countries this condition is estimated to range from 28% to 50%, depending on the methods used for its identification or the characteristics of the evaluated population (1). It is also alarming the association of undernutrition with negative outcomes, such as higher rates of complications, higher mortality rates, higher hospital costs and increased hospital length of stay (LOS) (2–4). Moreover, patients’ nutritional status tends to worsen during hospitalization (5). Thus, nutrition assessment is important in order to prevent deterioration of nutritional status and possibly to shorten LOS in the hospital setting. The diagnosis of undernutrition includes anthropometric measurements, that are different in what concerns the equipment needed, the time taken to be executed and the expertise level required to the health practitioner. So, in order to improve undernutrition diagnostic methods and to spread its implementation, it is important to increase knowledge towards anthropometry capacity in diagnosing undernutrition.
There is an sustained evidence that anthropometric and derived indicators are related to undernutrition and nutrition risk (6–9). However, previous evidence on the association of anthropometric and derived indicators with LOS is contradictory. Whereas in some studies an association between triceps skinfold thickness (TST), mid-upper arm circumference (MUAC), adductor pollicis muscle thickness (APMT), mid-upper arm muscle area (AMA) and mid-upper arm muscle circumference (AMC) with longer LOS has been shown (1,7,10–15), in others this association was not found (1,7,12,16–23). However, it is important to highlight that LOS may be influenced by many factors other than nutritional status and in some of the mentioned studies, the association between anthropometric and derived indicators with LOS was not adjusted for possible confounding variables (7,12,18,20,22). Furthermore, in only one study discharge destination was taken into account and it was shown that MUAC had the greatest influence on LOS. However, this study sample was confined to patients with neoplasms (1). Survival analysis has the advantage of allowing to define the main outcome variable, such as discharge to usual residence, and to treat LOS as a continuous variable.
The main objective of this study was to measure the independent association of the anthropometric and derived indicators TST, MUAC, APMT, AMA and AMC with LOS, within a varied group of hospitalized patients. It is also aimed to investigate if these
9
anthropometric and derived indicators have a similar validity in predicting LOS, after adjusting for possible confounding variables.
Methods
Study Population and Design
A prospective observational study was conducted between July 2011 and December 2014 in a Portuguese university hospital. Eligibility criteria to participate in this study were being 18 years old or more, caucasian, conscious, cooperative, able to provide written informed consent and to have been given an expected LOS superior to 24 hours. Patients with a critical illness, pregnant women, those with hemodynamic instability at the time of evaluation, individuals in isolation and that were admitted for procedures that implied bed rest were excluded from the study. Therefore, patients from angiology and vascular surgery; cardiology; digestive, nondigestive and hepatobiliary surgeries; endocrinology; gastroenterology; internal medicine; nephrology; orthopaedics; otolaryngology and urology wards were recruited for this study.
From 1053 subjects invited to participate in this study, a total of 825 (78.3%) patients accepted to participate; 205 (19.5%) refused to participate, 13 (1.2%) were excluded because they were positively screened for cognitive impairment and 10 (1.0%) were excluded because they did not complete the study. Moreover, 8 had missing data for TST (1.0%), 8 for MUAC (1.0%), 20 for APMT (2.4%) and 120 for Patient-Generated Subjective Global Assessment (PG-SGA) (14.6%), therefore they were excluded from present data analysis. The final study sample was composed by 695 participants. The follow-up interval for LOS was defined as 30 days.
Ethical disclosure
The presented research was conducted according to the guidelines established by the Declaration of Helsinki and approved by the Institutional Review Board and the Ethics Committee of Centro Hospitalar do Porto (Appendix I). Written informed consent was obtained from the all study participants.
10
Data Collection
Data on sex, date of birth, hospital ward, clinical history, medical diagnosis, date of hospital admission, date of hospital discharge and discharge destination were obtained by consulting hospital and medical records. All other data was collected by two nutritionists, using a structured questionnaire.
Potential participants were screened for cognitive impairment using the Abbreviated Mental Test (24). Educational level was determined by the number of years of school attended. Marital status was categorised as single, married or in common-law marriage, divorced and widowed. Katz index was used to evaluate the independence in daily activities (25). Disease severity was evaluated by the Charlson disease severity index. This index takes into account the number and the seriousness of comorbid diseases, each scored from 0 to 6 (26). Nutritional status was assessed by PG-SGA and accordingly patients were classified as being not undernourished, as exhibiting moderate or suspected undernutrition or as exhibiting severe undernutrition (27).
Standing height (cm) was measured with a metal tape with 0.1 cm resolution and, for those who could not be measured, height was estimated by hand length (n=342, 49.2%) or by half-span (n=2, 0.3%) (28,29). Body weight (kg) was obtained with a calibrated beam scale with a 0.5 kg resolution. If body weight could not be measured, it was estimated using MUAC and height (n=165, 23.7%) (14). For patients on dialytic treatments, body weight was reported by the patient (n=22, 3.2%). The MUAC was measured with a metal tape measure with 0.1 cm resolution (29). The TST and the APMT from non-dominant hand were obtained with a Harpenden calliper with a 0.2 mm resolution (29,30). For patients whose non-dominant APMT was impossible to measure, the dominant APMT was used (n=38, 5.5%). The AMA was calculated using the formula [MUAC (cm) – π*TST2 (cm)/ 4π] (31) and the AMC was calculated using the formula [MUAC (cm) – π*TST (cm)] (32). Body mass index (BMI) was calculated using the formula [weight (kg)/height2 (m)].
Statistical Analysis
The Kolmogorov-Smirnov test was used to assess whether the variables were normally distributed. Continuous variables are reported as median and interquartile range (IQR) and categorical variables are reported as frequencies.
11
The following education categories were created: 0 to 4, 5 to 12 and more than 12 school years. Concerning the Katz index, participants were classified as presenting severe dependence if the score obtained ranged from 0 to 2 points, as presenting moderate dependence if the score ranged from 3 to 4 points and as presenting independence if the punctuation was 5 to 6 points. Participants were categorized into four classes according to their BMI: underweight (<18.5 kg/m2), normal weight (from 18.5 to 24.9 kg/m2), overweight (from 25.0 to 29.9 kg/m2) and obesity (≥ 30.0 kg/m2).
Moreover, participants were dichotomized for the anthropometric and derived indicators TST, MUAC, AMA and AMC according to the percentiles 5th and 25th described in the literature (32–35). For the APMT only the 5th percentile was used since the 25th percentile was not found described in the literature (36).
The length of hospital stay was dichotomized at 7 days, based on the median LOS of the entire sample. To evaluate the association between LOS and demographic, functional, clinical and nutritional characteristics, patients with and without a long LOS (<7 versus ≥7 days) were compared using the Pearson chi-squared test for categorical variables and the Mann Whitney test for continuous variables.
LOS was determined as the number of days from the date of hospital admission to date of discharge to usual residence (the main outcome variable). Patients who were not discharged to usual residence within the study period were censored at the time of the occurrence of other events, namely death, transfer (to another hospital ward, to another hospital or to continuing care units) and discharge against medical advice (n=84). Since the follow-up interval for LOS was defined as 30 days, patients who remained hospitalized more than 30 days after hospital admission were also censored (n=20).
The Kaplan-Meier method was used to estimate the cumulative probability of discharge-free over time, according to the five anthropometric and derived indicators.
Cox regression analysis was used to estimate unadjusted and adjusted hazard ratios (HR) and corresponding 95% confidence intervals (95% CI). Different models were conducted for each anthropometric and derived indicator. For TST, MUAC, AMA and AMC, participants were dichotomized according to the 5th and to the 25th percentiles, whereas for APMT only the 5th percentile was used. The adjusted model included the following characteristics: age (dichotomous), marital status (dichotomous), education (categorical), Katz index (categorical) and Charlson index (continuous).
12
P value was considered statistically significant when lower than 0.05. Statistical
analysis was conducted using the Software Package for Social Sciences, version 25, from IBM, 2017.
Results
This study included 695 patients, 320 women (46.0%) and 375 men (54.0%), aged between 18 and 91 years, with a median age (and IQR) of 57 (22) years. According to PG-SGA, 362 patients (52.1%) were not undernourished, 170 patients (24.5%) presented moderate or suspected undernutrition and 163 patients (23.5%) were severely undernourished.
The characteristics of the study participants’ according to LOS, short LOS (<7 days) versus long LOS (≥7 days), are presented in Table 1. Patients in the long LOS group were older (P<0.001) and presented lower median values for TST (P=0.043) and for APMT (P=0.029). Higher proportions of participants aged 65 years and older (P=0.001), presenting 0 to 4 and 5 to 12 years of school attended (P=0.025), being widowed and divorced (P=0.004), presenting moderate and severe dependence (P=0.001), that were discharged against medical advice, transferred or deceased (P<0.001) and presenting moderate and severe undernutrition (P<0.001) were found in the long LOS group. Moreover, within this group, higher proportions of participants were found to be below the 25th percentile for TST (P=0.006) and below the 5th percentile for MUAC (P=0.004), APMT (P=0.005) and AMC (P=0.029).
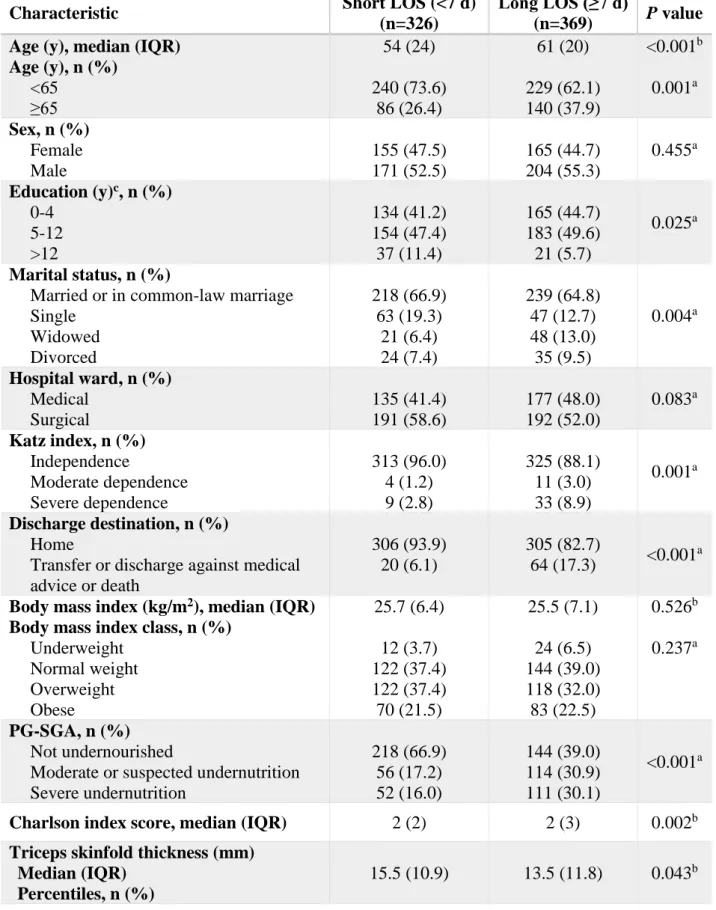
Figure 1 shows the probability of being discharge-free over time according to the five anthropometric and derived indicators used. Patients that presented values lower than the 5th percentile for all the indicators studied showed a lower probability of being discharged from the hospital to usual residence, since higher proportions of patients remained hospitalized over time. For TST, patients who were below the 25th percentile also presented a lower probability of being discharged from the hospital to usual residence.
Using unadjusted Cox proportional hazard models, for MUAC, APMT, AMA and AMC, patients who were below the 5th percentile, presented lower HR for occurrence of the event (discharge to usual residence) over time. For TST, values below the 5th and the
13
25th percentiles were associated with lower HR for occurrence of the event over time (Table 2, Model 1). After adjusting for age, marital status, education, Katz and Charlson indexes, the results remained similar (Table 2, Model 2), meaning that for all the anthropometric and derived indicators studied, values lower than the 5th percentile were independently associated with longer LOS and for TST, presenting values lower than the 25th, was also independently associated with longer LOS.
Discussion
According to the results of the present study, depletion of TST, MUAC, APMT, AMA and AMC, was each independently associated with longer LOS in a large sample of hospitalized patients from different medical and surgical wards. In fact, for all the anthropometric and derived indicators studied, patients that presented values lower than the 5th percentile had a lower probability of being discharged from the hospital to usual residence. Moreover, the association between undernutrition indicators and LOS was not weakened by adjusting for age, educational level, marital status, Katz index and Charlson index since the HR and corresponding 95% CI were similar between the crude and the adjusted Cox proportional hazard models.
Other relevant finding is that patients that presented TST values below the 25th percentile had a lower independent probability of being discharged from the hospital to usual residence, which highlights that for this anthropometric indicator, a less marked depletion may allow an earlier detection of undernutrition.
Comparing all the anthropometric and derived indicators studied, the present study highlights that those that involve calculations, AMA and AMC, that are not as quick and easy to use, do not present any advantage since the HR and 95% CI obtained were similar to those obtained from the direct measurements, TST, MUAC and APMT.
Disease related undernutrition is commonly associated with an inflammatory component. Acute disease related undernutrition is characterized by a severe inflammation response, along with catabolism and muscle mass loss. In chronic disease related undernutrition, the most frequent type of disease-related undernutrition, the degree of inflammation is mild to moderate and muscle mass loss may occur gradually during a period of time that can last from months to years (37). Furthermore, when at rest, common
14
situation among hospitalized patients, muscles prefer to use fat for fuel (38). Analysing the HR obtained for TST, considering the dichotomization on the 25th percentile, a low HR suggests a higher association with longer LOS and thus it is possible to state that, in this study sample, fat mass depletion allowed an earlier detection of undernutrition.
The association between the anthropometric and derived indicators studied with LOS has been previously investigated but results from precedent studies were contradictory. Whereas some authors found an association between the indicators and LOS (1,7,10–15), others did not find this association (1,7,12,16–23).
These contradictory results can be due to several causes. In some studies, the statistical analysis conducted were limited to bivariate analysis (7,12,18,20,22), whereas in other studies multivariable analysis were done (1,10,11,13–17,19,21). Differences in the studied population can also, at least in part, explain the different findings, namely restricting the sample to a specific age group (23) or to surgical, to oncologic or to Intensive Care Unit patients (1,7,13,15,17,18,21). Sample size is another aspect to take into account, since in previous studies it ranged from 82 (18) to 3087 participants (22).
The definition of depletion concerning anthropometric variables also varied between studies. The anthropometric and derived indicators depletion was defined as a percentage from 60 to 80% of the 50th percentile (10,16), or as values below the 5th percentile (13) and below the 10th percentile (17). Moreover, some authors used a specific value to define normality and depletion (10,11,14,15). The dichotomization of LOS is another aspect to consider, since some authors used LOS dichotomized at 3 days (13), at 7 days (11,19), at 10 days (15,16) or at 12 days (10). In other studies LOS was analysed as a continuous variable (1,14,17,21).
In a study conducted with 278 hospitalized patients and by multivariable logistic analysis adjusted for sex, TST was shown to be the best predictor for longer LOS (10). Previous studies on the association between APMT and LOS did not provide definitive findings. Two of them found an association (13,15) and other two did not (17,21). Regarding AMA and AMC, a previous study found an association between these two derived indicators with LOS (15). Concerning MUAC, only two studies did not corroborate the association between this anthropometric indicator and LOS (16,19). However, most of the previous studies found an association between MUAC and LOS (1,10,11,14,15). It is also important to highlight that by using a Cox’s regression model,
15
in a study among patients with neoplasms, MUAC was independently associated with LOS and as MUAC increased, LOS decreased (1).
Although the association between anthropometry and LOS has been extensible studied, to our knowledge, only this previous study used survival analysis but the study sample was restricted to oncologic patients (1). Survival analysis is the most appropriate analysis to study this association because it treats LOS as a continuous outcome and allows to define the event of interest as being discharge to usual residence. Moreover, this analysis accounts for censored data. In fact, patients that experienced discharge against medical advice, were transferred, deceased and had LOS superior to 30 days were censored. By censoring, it is possible to include cases that could not be included with other statistical approaches, such as logistic regression, and thus, survival analysis reflects the hospital reality more accurately.
The statistical methodology used was a study strength, as well as the use of several anthropometric and derived indicators. The characteristics of the present study sample can also be regarded as a study strength, since a large number of patients with different types of diagnosis and pathologies and with a large age range, from 18 to 91 years, were included.
Nutritional and medical procedures were not recorded, so HR were not adjusted for these potential confounding variables. Although LOS was arbitrarily censored at 30 days, only 20 participants (2.9%) remained hospitalized longer than 30 days, so this probably did not affect present study findings.
To sum up, the association of several anthropometric and derived indicators with LOS was compared and it was shown for the first time, using survival analysis among a sample presenting a broad age range and various diagnosis and pathologies, that TST, MUAC, APMT, AMA and AMC values below the 5th percentile and that TST values below the 25th percentile were independently associated with LOS. Results from the present study suggest that TST is a more relevant indicator for the diagnosis of undernutrition given its stronger association with LOS and it may allow an earlier detection of undernutrition. Also, TST can be used to predict LOS in clinical practice, which is relevant, since it is quick and easy to measure, non-invasive and the equipment is inexpensive and portable. Thus, the present study findings allow to improve undernutrition diagnostic tools.
16
Conclusion
When analysing the findings of the present study, it is possible to conclude that depletion of TST, MUAC, APMT, AMA and AMC was independently associated with LOS in hospitalized patients. Furthermore, TST was found to be the best anthropometric indicator to predict LOS. Using this anthropometric indicator can present advantages for the diagnosis of undernutrition since it may allow an earlier detection of a poor nutritional status.
Acknowledgements
I would like to thank Fundação para a Ciência e a Tecnologia, to Centro
Hospitalar do Porto and to all the participants for making this study possible. I would
also like to thank to Professor Rita Guerra for all the great help throughout this work and to Professor Cláudia Silva for the dedication shown towards all the nutrition students. I would also like to specially thank to my parents, Conceição e Paulo, to my sister Susana, to my brother-in-law Marco, to Rui and to the rest of my family for their unconditional support. Moreover, I also thanks to my good friends Mariana, Paula and Ana Sousa for all the company through my academic journey.
References
1. Leandro-Merhi VA, Aquino JL, Chagas JF. Nutrition status and risk factors associated with length of hospital stay for surgical patients. J Parenter Enter Nutr. 2011;35(2):241–8.
2. Chima CS, Barco K, Dewitt ML, Maeda M, Carlos Teran J, Mullen KD. Relationship of nutritional status to length of stay, hospital costs, and discharge status of patients hospitalized in the medicine service. J Am Diet Assoc. 1997;97:975–8.
3. Correia MI, Waitzberg DL. The impact of malnutrition on morbidity, mortality, length of hospital stay and costs evaluated through a multivariate model analysis.
Clin Nutr. 2003;22(3):235–9.
17
Process. 13th ed. St. Louis: Elsevier; 2011.
5. Kyle U, Genton L, Pichard C. Hospital length of stay and nutritional status. Curr
Opin Clin Nutr Metab Care. 2005;8(4):397–402.
6. Valente KP, Silva NM, Faioli AB, Barreto MA, Moraes RA, Guandalini VR. Thickness of the adductor pollicis muscle in nutritional assessment of surgical patients. Einstein (São Paulo). 2016;14(1):18–24.
7. Almeida AI, Correia M, Camilo M, Ravasco P. Length of stay in surgical patients: Nutritional predictive parameters revisited. Br J Nutr. 2013;109(2):322–8.
8. Costenla MM, Santos CA, Fonseca JC. Mid upper arm circumference as a predictor of malnutrition in older adults and its relation to malnutrition in older adults and its relation to malnutrition screening and assessment tools. J Aging Res
Clin Pract. 2013;2(3):295–9.
9. Santos CA, Rosa CO, Ribeiro AQ, Ribeiro RC. Patient-Generated Subjective Global Assessment and classic anthropometry: comparison between the methods in detection of malnutrition among elderly with cancer. Nutr Hosp. 2015;31(1):384–92.
10. Silva HG, Santos SO, Silva NO, Ribeiro FD, Josua LL, Moreira AS. Nutritional assessment associated with length of inpatients’ hospital stay. Nutr Hosp. 2012;27(2):542–7.
11. Tsaousi G, Panidis S, Stavrou G, Tsouskas J, Panagiotou D, Kotzampassi K. Prognostic indices of poor nutritional status and their impact on prolonged hospital stay in a greek university hospital. Biomed Res Int. 2014;2014.
12. Leandro-Merhi VA, Aquino JL. Relationship Between Nutritional Status and the Clinical Outcomes of Patients With and Without Neoplasms According To Multiple Correspondence Analysis. Arq Gastroenterol. 2017;54(2):148-55. 13. Pereira TG, Fink JS, Silva FM. Thickness of the adductor pollicis muscle:
Accuracy in predicting malnutrition and length of intensive care unit stay in critically ill surgical patients: Thickness of the adductor pollicis muscle in surgical critically patients. Clin Nutr ESPEN. 2018;24:165–9.
18
body mass index and weight loss as indices of undernutrition in acutely hospitalized patients. Clin Nutr. 2003;22(3):307–12.
15. Ghorabi S, Ardehali H, Amiri Z, Shariatpanahi ZV. Association of the Adductor Pollicis Muscle Thickness with Clinical Outcomes in Intensive Care Unit Patients.
Nutr Clin Pract. 2016;31(4):523–6.
16. Marcadenti A, Vencatto C, Boucinha ME, Leuch MP, Rabello R, Londero LG, et al. Desnutrição, tempo de internação e mortalidade em um hospital geral do Sul do Brasil. Rev Ciência Saúde. 2011;4(1):7–13.
17. Caporossi FS, Caporossi C, Dock-Nascimento DB, Aguilar-Nascimento JE. Measurement of the thickness of the adductor pollicis muscle as a predictor of outcome in critically ill patients. Nutr Hosp. 2012;27(2):490–5.
18. Freitas BJ, Mesquita LC, Teive NJ, Souza SR. Antropometria Clássica e Músculo Adutor do Polegar na Determina̧cão do Prognóstico Nutricional em Pacientes Oncológicos. Rev Bras Cancerol. 2010;56(4):415–22.
19. Jeejeebhoy KN, Keller H, Gramlich L, Allard JP, Laport M, Duerksen DR, et al. Nutritional assessment: Comparison of clinical assessment and objective variables for the prediction of length of hospital stay and readmission. Am J Clin Nutr. 2015;101(5):956–65.
20. Ordoñez AM, Schieferdecker ME, Cestonaro T, Neto JC, Campos AC. Nutritional status influences the length of stay and clinical outcomes in patients hospitalized in internal medicine wards. Nutr Hosp. 2013;28(4):1313–20.
21. Shu-Fen CL, Ong V, Kowitlawakul Y, Ling TA, Mukhopadhyay A, Henry J. The adductor pollicis muscle: A poor predictor of clinical outcome in ICU patients.
Asia Pac J Clin Nutr. 2015;24(4):605–9.
22. Luis DA, Terroba MC, Cuellar L, Izaola O, Fuente B, Martin T, et al. Association of anthropometric and biochemical markers with length of stay and mortality in the hospital. Eur Rev Med Pharmacol Sci. 2013;17(10):1321–5.
23. Dent E, Chapman I, Piantadosi C, Visvanathan R. Nutritional screening tools and anthropometric measures associate with hospital discharge outcomes in older people. Australas J Ageing. 2015;34(1):E1–6.
19
24. Hodkinson HM. Evaluation of a mental test score for assessment of mental impairment in the elderly. Age Ageing. 1972;1(4):233–8.
25. Katz S, Downs TD, Cash HR GR. Progress in development of the index of ADL.
Gerontologist. 1970;10(1):20–30.
26. Charlson ME, Pompei P, Ales KL, MacKenzie CR. A new method of classifying prognostic comorbidity in longitudinal studies: Development and validation. J
Chronic Dis. 1987;40(5):373–83.
27. Ottery FD. Patient-Generated Subjective Global Assessment. In: McCallum PD, Polisena CG (eds.) The Clinical Guide to Oncology Nutrition. Chicago: The American Dietetic Association; 2000. p.11–23.
28. Malnutrition Advisory Group. The “MUST” explanatory booklet. Redditch, United Kingdom; BAPEN; 2003.
29. Stewart AD, Marfell-Jones M, Olds T, Ridder JH. International standards for
anthropometric assessment. Australia: International Society for the Advancement
of Kinanthropometry; 2011.
30. Lameu EB, Gerude MF, Corrêa RC, Lima KA. Adductor pollicis muscle: a new anthropometric parameter. Rev Hosp Clin Fac Med Sao Paulo. 2004;59(2):57–62. 31. Gibson RS. Principles of Nutritional Assessment. 2nd ed. Oxford: Oxford
University Press; 2005.
32. Bishop C, Bowen P, Ritchey S. Norms adults for nutritional assessment of American by upper arm anthropometry. Am J Clin Nutr. 1981;34:2530–9.
33. Fryar CD, Gu Q, Ogden CL, Flegal KM. Anthropometric Reference Data for Children and Adults: United States, 2011-2014. National Center for Health Statistics. Vital Health Stat 3(39). 2016.
34. McDowell MA, Fryar CD, Ogden CL, Flegal KM. Anthropometric Reference Data for Children and Adults: United States, 2003-2006. National Center for Health Statistics. Natl Health Stat Report 10. 2008.
35. Frisancho AR. Anthropometric standards. 2nd ed. Ann Arbor: University of Michigan Press; 2008.
20
36. Gonzalez MC, Duarte RR, Budziareck MB. Adductor pollicis muscle: Reference values of its thickness in a healthy population. Clin Nutr. 2010;29(2):268–71. 37. Jensen GL, Mirtallo J, Compher C, Dhaliwal R, Forbes A, Grijalba R, et al. Adult
Starvation and Disease-Related Malnutrition: A Proposal for Etiology- Based Diagnosis in the Clinical Practice Setting From the International Consensus Guideline Committee. JPEN J Parenter Enteral Nutr. 2010;34(2):156-9.
38. Insel P, Turner R, Ross D. Nutrition. 3rd ed. Sudbury: Jones and Bartlett Publishers; 2007.
21
Table 1. Baseline demographic, clinical, nutritional status and anthropometric
characteristics of 695 Portuguese inpatients participating in a prospective observational study according to short and long LOS.
Characteristic Short LOS (<7 d)
(n=326)
Long LOS (≥7 d)
(n=369) P value Age (y), median (IQR)
Age (y), n (%) <65 ≥65 54 (24) 240 (73.6) 86 (26.4) 61 (20) 229 (62.1) 140 (37.9) <0.001b 0.001a Sex, n (%) Female Male 155 (47.5) 171 (52.5) 165 (44.7) 204 (55.3) 0.455a Education (y)c, n (%) 0-4 5-12 >12 134 (41.2) 154 (47.4) 37 (11.4) 165 (44.7) 183 (49.6) 21 (5.7) 0.025a Marital status, n (%)
Married or in common-law marriage Single Widowed Divorced 218 (66.9) 63 (19.3) 21 (6.4) 24 (7.4) 239 (64.8) 47 (12.7) 48 (13.0) 35 (9.5) 0.004a Hospital ward, n (%) Medical Surgical 135 (41.4) 191 (58.6) 177 (48.0) 192 (52.0) 0.083a Katz index, n (%) Independence Moderate dependence Severe dependence 313 (96.0) 4 (1.2) 9 (2.8) 325 (88.1) 11 (3.0) 33 (8.9) 0.001a Discharge destination, n (%) Home
Transfer or discharge against medical advice or death 306 (93.9) 20 (6.1) 305 (82.7) 64 (17.3) <0.001 a
Body mass index (kg/m2), median (IQR) Body mass index class, n (%)
Underweight Normal weight Overweight Obese 25.7 (6.4) 12 (3.7) 122 (37.4) 122 (37.4) 70 (21.5) 25.5 (7.1) 24 (6.5) 144 (39.0) 118 (32.0) 83 (22.5) 0.526b 0.237a PG-SGA, n (%) Not undernourished
Moderate or suspected undernutrition Severe undernutrition 218 (66.9) 56 (17.2) 52 (16.0) 144 (39.0) 114 (30.9) 111 (30.1) <0.001a
Charlson index score, median (IQR) 2 (2) 2 (3) 0.002b
Triceps skinfold thickness (mm) Median (IQR)
Percentiles, n (%)
22
IQR: interquartile range; LOS: length of stay; PG-SGA: Patient-Generated Subjective Global Assessment.
aPearson chi-squares test. bMann Whitney test.
cOne missing value for education status in short LOS. 25th Above Below 5th Above Below 231 (70.9) 95 (29.1) 295 (90.5) 31 (9.5) 225 (61.0) 144 (39.0) 323 (87.5) 46 (12.5) 0.006 a 0. 215a
Mid-upper arm circumference (cm) Median (IQR) Percentiles, n (%) 25th Above Below 5th Above Below 29.0 (5.0) 134 (41.1) 192 (58.9) 251 (77.0) 75 (23.0) 28.5 (5.2) 132 (35.8) 237 (64.2) 248 (67.2) 121 (32.8) 0.065b 0.149a 0.004a
Adductor pollicis muscle thickness (mm) Median (IQR) Percentile, n (%) 5th Above Below 21.4 (6.0) 211 (64.7) 115 (35.3) 20.5 (5.8) 200 (54.2) 169 (45.8) 0.029b 0.005a
Mid-upper arm muscle area (cm2) Median (IQR) Percentiles, n (%) 25th Above Below 5th Above Below 36.9 (16.7) 149 (45.7) 177 (54.3) 225 (78.2) 71 (21.8) 35.6 (15.8) 149 (40.4) 220 (59.6) 268 (72.6) 101 (27.4) 0.242b 0.157a 0.088a
Mid-upper arm muscle circumference (cm) Median (IQR) Percentiles, n (%) 25th Above Below 5th Above Below 23.9 (4.6) 180 (55.2) 146 (44.8) 267 (81.9) 59 (18.1) 23.7 (4.5) 186 (50.4) 183 (49.6) 277 (75.1) 92 (24.9) 0.339b 0.205a 0.029a
23
Table 2. Hazard ratios of occurrence of the event (discharge to usual residence) over time
associated with anthropometric or derived indicators for 695 Portuguese inpatients participating in a prospective observational studya.
aLower HR values represent a lower probability of hospital discharge; in-hospital deaths, transfers and discharge against medical advice were censored at time of those events; length of hospital stay was censored at 30 days.
Measure Model 1
Crude HR (IC 95%)
Model 2
Adjusted HRb (IC 95%) Triceps skinfold thickness
Percentiles 25th Above Below 5th Above Below 1 0.797 (0.674; 0.942) 1 0.707 (0.542; 0.924) 1 0.798 (0.673; 0.946) 1 0.759 (0.579; 0.995)
Mid-upper arm circumference Percentiles 25th Above Below 5th Above Below 1 0.898 (0.762; 1.058) 1 0.810 (0.678; 0.967) 1 0.879 (0.745; 1.038) 1 0.822 (0.687; 0.983)
Adductor pollicis muscle thickness Percentiles 5th Above Below 1 0.795 (0.676; 0.935) 1 0.791 (0.671; 0.933)
Mid-upper arm muscle area Percentiles 25th Above Below 5th Above Below 1 0.881 (0.750; 1.034) 1 0.828 (0.687; 0.997) 1 0.876 (0.744; 1.031) 1 0.797 (0.660; 0.962)
Mid-upper arm muscle circumference Percentiles 25th Above Below 5th Above Below 1 0.872 (0.743; 1.022) 1 0.745 (0.612; 0.907) 1 0.855 (0.727; 1.006) 1 0.746 (0.611; 0.911)
24
bAdjusted for age [<65 (reference) and ≥65 years], education [0 to 4, 5 to 12 and >12 (reference) years], marital status [married or in common-law marriage (reference) and single, widowed or divorced], Katz index [severe dependence, moderate dependence and independence (reference)] and Charlson index (continuous).
25
Figure 1. Kaplan-Meier curves for being discharge-free over timea for 695 Portuguese inpatients participating in a prospective observational study, according to (A) 5th and 25th triceps skinfold thickness percentiles, (B) 5th and 25th mid-upper arm circumference percentiles, (C) 5th adductor pollicis muscle thickness percentile, (D) 5th and 25th mid-upper arm muscle area percentiles and (E) 5th and 25th mid-upper arm muscle circumference percentiles. aHigher values of being discharge-free over time represent a lower probability of hospital discharge; in-hospital deaths, transfers and discharge against medical advice were censored at time of those events; length of hospital stay was censored at 30 days.
A
B
P=0.007 P=0.005
26 C D E P=0.003 P=0.034 P=0.099 P=0.002 P=0.071
27