Esthetic perception and economic value of orthodontic appliances by lay Brazilian adults
Daniela Feu1, Fernanda Catharino2, Candice Belchior Duplat3, Jonas Capelli Junior4
Objective: To evaluate the esthetic perception of diferent appliances by Brazilian lay adults and its inluence in the attributed value of orthodontic treatment, considering evaluators’ socioeconomic status, age and gender. Methods: Eight diferent com-binations of orthodontic appliances and clear tray aligners were placed in a consenting adult with pleasing smile. Standardized frontal photographs were captured and incorporated into a research album. A sample of adults (n = 252, median = 26 years old) were asked to rate each image for (1) its attractiveness on a visual analog scale and (2) the willingness to pay (WTP) for a cos-metic appliance when compared to a standard metalic appliance and a clear tray aligner. Comparisons between the appliances’ attractiveness were performed using the Friedman’s test and Dann’s post-hoc test. Correlation between appliances’ attribut-ed value, socioeconomic status, age, gender, and esthetic perception was assessattribut-ed using Spearman’s correlation analysis. Re-sults: Attractiveness ratings of orthodontic appliances varied signiicantly in the following hierarchy: Clear aligners>sapphire brackets>self-ligating/conventional stainless steel brackets>and golden metal appliances. The correlation between WTP and esthetic perception was week. However, for individuals with better socioeconomic status and aged between 17-26 years old sig-niicantly, a signiicantly higher WTP was found. Conclusion: Clear aligners and sapphire brackets with esthetic archwire were considered better esthetic options in this sample. Nevertheless, patients were not willing to pay more money for appliances they deemed more esthetic, however, they were signiicantly inluenced by their socioeconomic level and age.
Keywords: Orthodontic appliances. Esthetics. Corrective orthodontic treatment. Cost-beneit analysis.
Submitted: April 2, 2012 - Revised and accepted: June 28, 2012.
» Patients displayed in this article previously approved the use of their facial and in-traoral photographs.
» The authors report no commercial, proprietary, or inancial interest in the products or companies described in this article.
Contact address: Daniela Feu
Rua da Grécia, 85, apt. 1101 – Barro Vermelho – Vitória/ES – Brazil. Zip code: 29.057-660 – Email: [email protected]
1 MSc in Orthodontics, PhD Student, UERJ.
2 MSc and PhD in Orthodontics, - UERJ. Professor, Department of Orthodontics of
Faculdade Bahiana de Odontologia.
3 Specialist in Orthodontics - UERJ.
4 PhD in Ortodontics, Associate Professor, Department of Orthodontics - UERJ.
How to cite this article: Feu D, Catharino F, Duplat CB, Capelli Junior J. Esthetic perception and economic value of orthodontic appliances by lay Brazilian adults. Dental Press J Orthod. 2012 Sept-Oct;17(5):102-14.
Objetivo: avaliar a percepção de brasileiros adultos leigos para diferentes aparelhos ortodônticos e sua inluência na valoriza-ção econômica do tratamento, considerando o nível socioeconômico, idade e sexo dos avaliadores. Métodos: oito combinações de aparelhos ortodônticos e alinhadores foram colocadas em um adulto com bom alinhamento dentário, e fotograias frontais foram feitas para compor um álbum de imagens de pesquisa. Uma amostra de adultos (n = 252, mediana = 26 anos) classiicou cada imagem por (1) atratividade, em uma escala visual analógica, e (2) disposição a pagar a mais para realizar o tratamento com um aparelho estético em relação a um aparelho metálico e em relação a um alinhador. Comparações da atratividade dos aparelhos foram realizadas utilizando-se o teste de Friedman e o post-hoc de Dann. A correlação entre a valorização econômica, nível socioeconômico, idade, sexo e percepção estética foi calculada com a análise de correlação de Spearman. Resultados: a atratividade dos aparelhos ortodônticos variou signiicativamente, na seguinte hierarquia: alinhadores > aparelhos de saira > aparelhos metálicos tradicionais e autoligáveis > aparelhos dourados. A correlação entre a atratividade dos aparelhos e a dispo-sição em pagar mais por eles foi fraca. Contudo, ter melhor nível socioeconômico e idade entre 17 e 26 anos aumentou signiica-tivamente a disposição de pagar dos avaliadores. Conclusões: alinhadores e braquetes de saira com io estético foram conside-rados as opções de maior atratividade para essa amostra. Entretanto, os avaliadores não estiveram dispostos a pagar a mais para realizar seus tratamentos com os dispositivos que julgaram mais estéticos, sendo, contudo, signiicativamente inluenciados por seu nível socioeconômico e idade.
INTRODUCTION
During the past years, orthodontics has greatly evolved regarding esthetic materials. Nowadays, orthodontic brackets are becoming smaller and more discrete; in addition, the esthetic appliances rep-resent an alternative for patients that are reluctant to use metallic appliances. Orthodontic appliances have evolved according to public demand and avail-able technology, especially with the underlying goal of reducing the appliances’ visibility.1,2 The esthetic
paradigm shift in dentistry, especially in orthodon-tics, has shown the urgency to incorporate esthetics to the functional goals and requirements of the orth-odontic treatment,2, leading to an increase in the
de-mand for orthodontic appliances even more incon-spicuous. Therefore, this demand has been primarily driven by the consumers’ desire for esthetic alterna-tives and the competitiveness of the orthodontic in-dustry and specialty.3
Innovations in the aesthetics of orthodontic ap-pliances may also be a major factor in the increase in adult patients’ acceptability to orthodontic treatment. Patients considering to undergo orthodontic treat-ment now have can choose from diferent appliances currently available, including conventional stainless-steel, ceramic, lingual and clear plastic aligners.1 Even
though orthodontists can use these resources to in-crease patients’ acceptability to orthodontic treat-ment, few studies have evaluated the attributed value of orthodontic appliances.4
A previous study assessing perceived orthodontic appliance attractiveness indicated that adult patients prefer less metal showing in their orthodontic appli-ances and were less willing to accept treatment with appliances they consider to be unesthetic.3,4 In the
same way, another study revealed that 67% of Swe-den young adults would probably not or deinitely not wear visible appliances in spite of a functional treat-ment indication; and there was also a rejection rate of 33% to conventional orthodontic treatment.5 Another
aspect is the social perceptions of adults wearing orth-odontic appliances, since the judgments concerning their personal characteristics are inluenced by dental appearance and orthodontic appliance design.6
Just as a variety of social, cultural, psychological and personal factors influence the self-perception of dental appearance and the decision to undergo
orthodontic treatment,7,8,9 these factors may also
exert an important influence in the perception and acceptability of different orthodontic appliances, indicating that, different populations should be in-vestigated. Understanding the factors involved in the perception of different orthodontic appliances in a particular population enables a better planning of resources and strategies in the private practice, since the appearance of orthodontic appliances plays a significant role in patients’ decisions to un-dergo orthodontic therapy.4
The preferences for appliances can also be evalu-ated in terms of their attributed value to patients.10,11
The employment of the willingness-to-pay (WTP) assessment technique has been increasing in difer-ent areas , allowing to estimate the attributed value of the health care technologies.11 It is a way of
mea-suring value in monetary terms by a cost-beneit analysis once it assigns monetary values to both costs and outcomes of health care and calculates the net beneit. WTP allows a monetary rating to be attribut-ed to novel health care interventions or outcomes by asking people how much they would pay to obtain the beneits of a speciic treatment. This value is set as raters are asked to respond to a hypothetical, condi-tional question - e.g., ‘‘what is the maximum amount you would be willing to pay to access a new interven-tion, existing the need to undergo treatment?’’ Such a question is intended to elicit a monetary valuation of the merit, worth or beneit which each subject as-sociates with the speciic intervention under consid-eration. Although the same general question is asked any WTP study, the question can be asked in various formats to adapt to the study.12 When applied to
or-thodontics, this method may provide a way to deter-mine the value of diferent appliances for patients of diferent ages and sociocultural realities.3
The purpose of this study was to evaluate the es-thetic perception of lay Brazilian adults on diferent orthodontic appliances designs and its inluence in the attributed value of orthodontic treatment, consid-ering raters’ socioeconomic status, age and gender.
MATERIAL AND METHODS
An adult volunteer was selected for receiving the appliances and pictures capturing. Selection cri-teria were: Well aligned teeth, proper gingival and incisor display and the absence of strong gender markers in the circum-oral region. The volunteer was also asked to sign de informed consent. Digi-tal image capture was made in fronDigi-tal view with an SLR camera (EOS Rebel T1, Canon, Oita, Japan) equipped with a 100 mm macro lens (Macro Lens EF 100 mm, Canon, Oita, Japan) and a ring flash (Mac-ro Ring Light MR-14ex, Canon, Oita, Japan). Tra-ditional metal brackets (Masel, California, USA), self-ligated metal brackets (Tellus, Eurodonto, Brazil), golden metal brackets (GAC International, New York, USA) and sapphire esthetic orthodontic brackets (Radiance, American Orthodontics, Wis-consin, USA) were temporarily bonded to the dental surfaces of the maxillary arch without acid etching. For the simulated bonding of the appliances, Trans-bond XT (3M Unitek, California, USA) adhesive was used. A 0.020-in stainless steel archwire (GAC In-ternational, New York, USA) was used as reference for brackets positioning, allowing reproducibility for placement of various bracket systems. Brack-ets were bonded from upper right second molar to upper left second molar. A clear tray was fabri-cated and imaged to simulate clear tray alignment systems such as Invisalign (Invisalign, Align Tech-nology, California, USA). Two trays were produced: One simulating attachments in front teeth (12 and 22 in vestibular side) and one with no attachments. Attachments were transparent, rounded, and had approximately a three millimeters radius.
Camera settings were manually set, and all in-camera image enhancement features were turned of to ensure images’ reproducibility. Lighting condi-tions were constant for all images acquired.
All photographs of the volunteer’s smile were performed in the natural head position, with the aid of the cephalostat of the UERJ Dental Radiol-ogy Clinics, thus ensuring the correct positioning of the head. The ear positioners restricted excessive lateral movement while the nasion positioner lim-ited vertical movements. (Fig 1). The camera was at-tached to a tripod and positioned at a fixed distance of 110 cm in a straight line between the patient’s face and the camera lens.
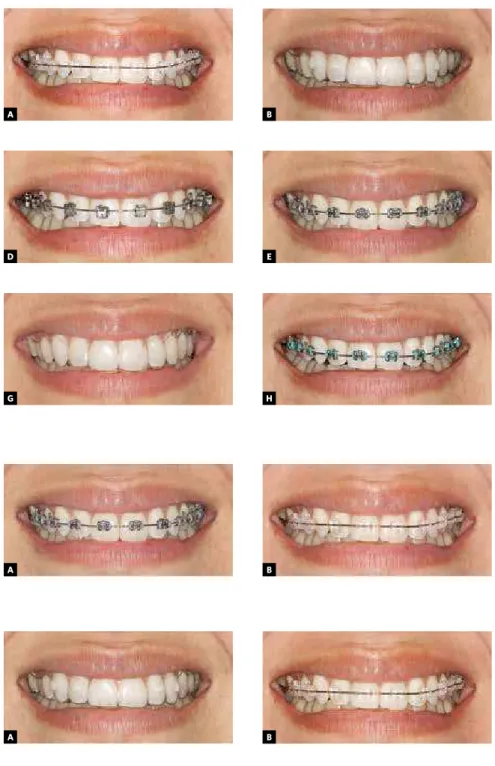
Photos of the volunteer’s smile were obtained in eight different situations: (1) With clear tray and at-tachments, (2) with clear tray without attachments; (3) with fixed traditional metallic brackets using gray elastomeric ligatures and (4) green elasto-meric ligatures (Morelli, São Paulo, Brazil), (5) with fixed metallic self-ligated brackets; (6) with fixed golden orthodontic brackets and clear elastomer-ic ligatures (Amerelastomer-ican Orthodontelastomer-ics, Wisconsin, USA); (7) with fixed esthetic brackets, clear elas-tomeric ligatures (American Orthodontics, Wis-consin, USA) and 0.020-in stainless steel archwire (GAC International, New York, USA), as in all previ-ous described situations, and (8) with fixed esthetic brackets, clear elastomeric ligatures (American Or-thodontics, Wisconsin, USA) and 0.018-in esthetic nickel titanium coated archwire (American Ortho-dontics, Wisconsin, USA). Image incorporation and standardization was performed with Photoshop (version 9.0, Adobe, California, USA).
The photo album was composed of three sheets of photo-quality color prints. Each sheet had 29.7 cm x 21 cm. The irst sheet comprised eight images, with all compositions of orthodontic appliances described
above randomly grouped in a grid and labeled with letters A to H (Fig 2). Each photograph had a 10 cm x 5 cm size. The second and third sheets was com-posed of two pictures each and had the purpose of evaluating the monetary value of the apparatus. The second sheet (Fig 3) had a picture of the traditional ixed metallic appliance labeled ‘‘Picture A’’ and one of a ixed esthetic appliance labeled ‘‘Picture B’’. The third sheet had a picture of a ixed esthetic appliance labeled ‘‘Picture A’’ and one of the clear tray aligner labeled ‘‘Picture B’’ (Fig 4). These sheets also had 29.7 cm x 21 cm, and each picture had 10 cm x 5 cm.
Eligibility to participate in the survey included any willing adult from 17 to 63 years old who had never undergone orthodontic treatment with brack-ets or aligners, was not a dentist or a dental student, was at the University campus in the four days of data collection and signed the informed consent form.
Two trained and blinded dental students col-lected the data. All surveys included a demographic and socioeconomic status information forms, in-structions, the image-rating scales and the album. Socioeconomic status was measured with the “Bra-zil Economic Classification Criteria”,13 which
clas-sifies people into eight socioeconomic categories according to the educational level of the head of the household and the ownership and consumption of common goods and services (e.g., VCRs, DVDs, col-or TVs, housekeeper).
Each rater (n = 252) received the album contain-ing the smiles’ photographs and a ratcontain-ing sheet with a 100 mm visual analog scale (VAS). The straight lines on the left side indicated “very unattractive” and, on the right side, “very attractive.” The subjects were presented the images that should be rated (Fig 2)
and instructed to use the VAS. They were also told not to compare the album smiles. After the attrac-tiveness evaluation, questions were asked to deter-mine the perceived value of cosmetic orthodontic appliances by using the WTP method.
The questions were directed to the evaluation of sheets 2 and 3. The rater received these instruc-tions: ‘‘Assume the appliances in picture B are more expensive than those in Picture A. How much more would you be willing to pay for them to be placed on your teeth?’’ After that question, a second question asked how much more money the rater would be willing to pay to have Picture B appliances placed on ‘‘your child’s teeth’’. The rater could check a box to represent the amount he or she would pay for Pic-ture B appliances, ranging from US$50 to US$3500 (Table 1). Alternatively, if the rater would not pay additional money for the appliances in Picture B, the option: ‘‘None, I would prefer Picture A appli-ance’’ could be chosen. The procedure was repeated for sheets 2 (Fig 3) and 3 (Fig 4).
The scores were measured by a calibrated den-tist using a digital caliper (MGF 505646, Mitutoyo, Tokyo, Japan) that was positioned on the left-most point of each line of the visual analog scale and opened to the mark made by the rater. Values in mil-limeters were registered as scores.
Statistical analysis
Sample size calculation showed that a total of 252 individuals would provide a 80% probability to the study of detecting a treatment diference at a one-sided 0.05 signiicance level, if the true difer-ence between treatments is 0.30 times the standard deviation.3 The VAS scores were evaluated by
intra-class correlation coeicient (ICC) with 95% upper and lower conidence bounds. For the WTP respons-es, the weighted kappa statistic was applied. Twenty subjects from the same University Campus, which were not included in the study group, were used to test the intrarater reliability. The interviews were re-peated seven to ten days latter.
Descriptive statistics for perceived attractive-ness VAS ratings were calculated. The Kolmogorov-Smirnov test showed lack of normality of distribu-tion and heteroscedasticity for all groups except for sapphire esthetic brackets with metal wire.
[ ] US$50 [ ] US$1000
[ ] US$100 [ ] US$1500
[ ] US$200 [ ] US$2500
[ ] US$250 [ ] US$3500
[ ] US$500 [ ] None of the above. I would prefer picture A appliance
Table 1 - Box representing how much more raters would pay for Picture B
Figure 2 - Images employed for attractiveness evaluation (first sheet): A) Sapphire esthetic brackets with metal archwire; B) clear tray with attachments ; C) golden metal brackets;
D) self-ligated metallic brackets; E) traditional metallic brackets; F) sapphire esthetic brack-ets with esthetic archwire; G) clear aligner and H) traditional metallic brackets with green elastomeric ligatures.
Figure 3 - Images captured for the first WTP
evaluation (second sheet): A) Traditional me-tallic brackets; B) sapphire esthetic brackets with metal archwire.
Figure 4 - Images captured for the second
WTP evaluation (third sheet): A) Clear align-er with attachments; B) sapphire esthetic brackets with metal archwire.
Comparisons of groups’ attractiveness were carried out using nonparametric statistics with the Fried-man test (analysis of variance [ANOVA] on ranks for repeated measures) followed by Dann’s multiple comparison post-hoc test (GraphPad Prism 5 soft-ware). The correlation between the economic value (WTP), socioeconomic status, age, gender and esthet-ic perception was calculated by using the Spearman correlation analysis and represented with the r value. Raters’ ages were divided at the median (26 years) to assess whether it could inluence the results.
RESULTS
Intraexaminer reliability was high for attractive-ness assessment: Mean ICC = 0.83 (95% CI, 0.78-0.99) and for attributed value assessments: Kappa, 0.89 [95% CI, 0.81-0.98], indicating substantial consistency.14
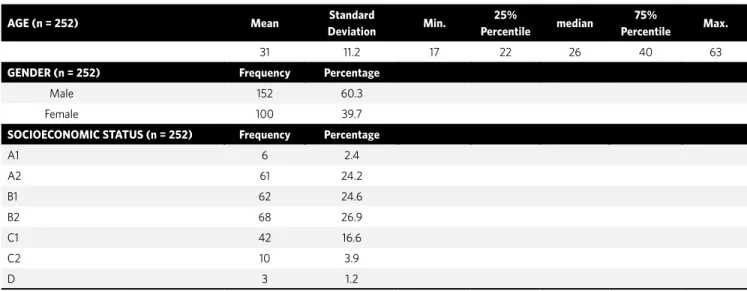
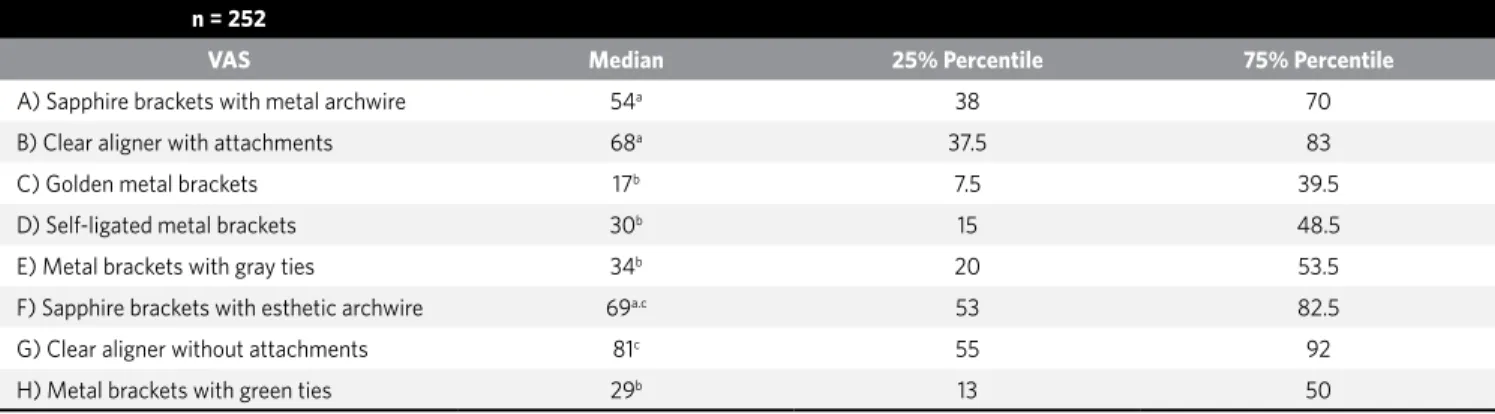
The median for raters’ age was 26 years old (IR= 22-40) and the socioeconomic status is described in Table 2. Descriptive statistics for the perceived attractiveness VAS ratings of sheet 1 are reported in Table 3 and Figure 5. Higher VAS scores (scored 0-100) indicate greater appliance attractiveness.
A
A
A D
G
B
B
B E
H
C
The clear aligner without attachments had the best evaluation scores, followed by the sapphire brack-ets with esthetic wire and then by the clear aligner with attachments. The golden metal brackets re-ceived the worse scores. The data show a general score hierarchy, with decreasing attractiveness as the amount of displayed metal increases, and wors-ening with the golden version.
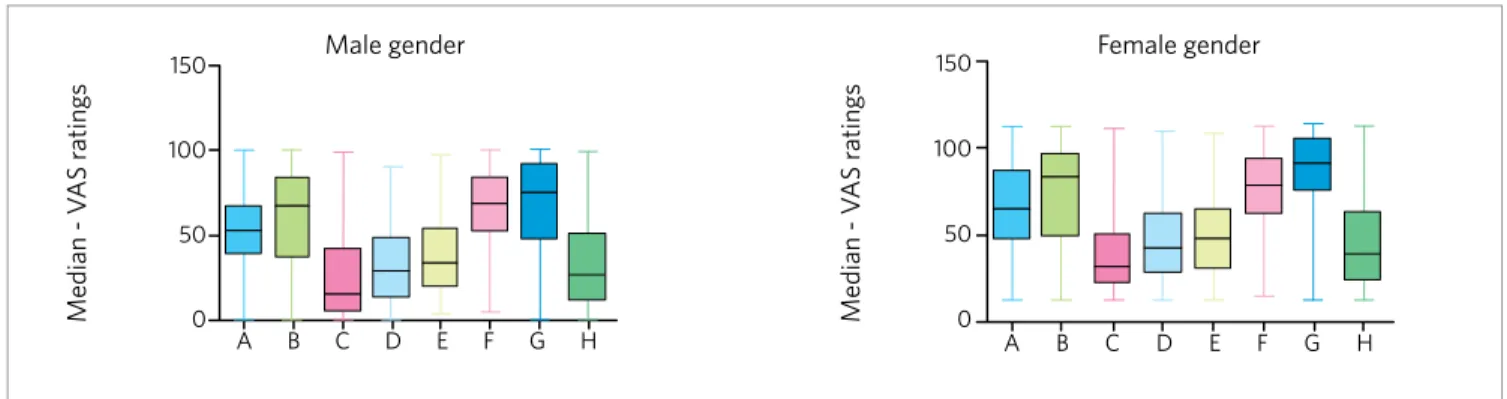
Appliances perceived attractiveness for males and females was compared, showing signiicant dif-ference between them, and it is described in Figure 6 and Table 4. Men showed a general tendency to as-sign lower scores than women. Similarly, there was a signiicant diference in the perception of groups of 17-26 years and 27-63 years of age, which is shown in Figure 7 and Table 5.
The correlation assessment between the attrib-uted value (WTP) and the esthetic perception of the metal brackets with gray elastomeric ligatures (option A) in comparison with sapphire brackets with metal archwire (Option B) in sheet 2 revealed a weak14 but
signiicant correlation regarding the raters them-selves, and an even weaker and non signiicant re-sult for their child. For the sapphire brackets with metal archwire (Option A) in comparison with the clear aligner with attachments (Option B) in sheet 3; there was also a weak14 but signiicant correlation for
the raters themselves, with similar results for their
child (Table 6). Comparison between genders regard-ing WTP (Table 7) showed similar results to the total sample, with more signiicant results for sheet 3, with a slight tendency for women to pay less for appliances they considered more esthetic.
In sheet 2, the correlation between WTP and age showed a weak and non-signiicant correlation for the two age groups (Table 8). However, younger sub-jects (17-26 years) showed a tendency to pay more for the aligner in sheet 3. Correlation was signiicant and moderate.14 Socioeconomic status had a signiicant
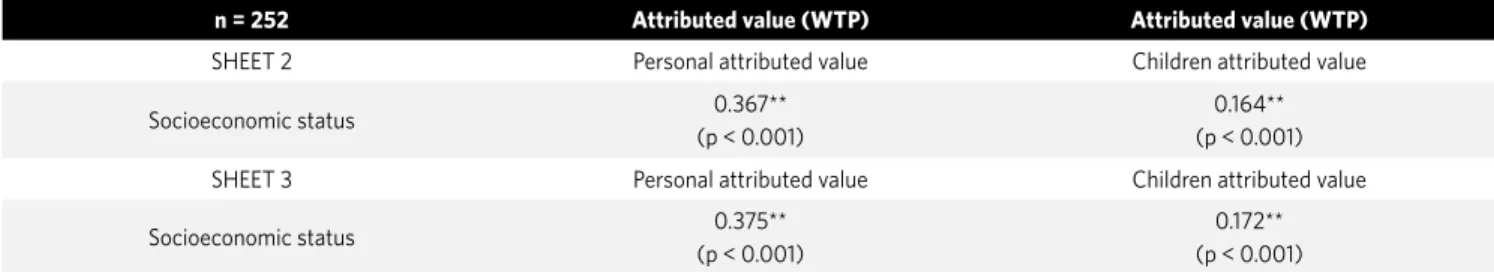
correlation, showing that as better is the socioeco-nomic status, as higher is the WTP for an esthetic ap-pliance (Table 9). Correlation was similar and statisti-cally signiicant for sheets 2 and 3.
DISCUSSION
Adult patients display pronounced diferent atti-tudes to the type of appliance they wear.15 They have
indicated embarrassment and bashfulness,16 arising
from the presence of a perceptible appliance, and negative peer reaction,15 especially from their
part-ners, as discouraging aspects of treatment. The per-ception of young adults undergoing orthodontics by others is particularly important for major life events such as employment and inding a partner. Therefore, an orthodontic appliance with the most positive social assessment would favor patient acceptance.6
Table 2 - Sample description.
AGE (n = 252) Mean Standard
Deviation Min.
25%
Percentile median
75%
Percentile Max.
31 11.2 17 22 26 40 63
GENDER (n = 252) Frequency Percentage
Male 152 60.3
Female 100 39.7
SOCIOECONOMIC STATUS (n = 252) Frequency Percentage
A1 6 2.4
A2 61 24.2
B1 62 24.6
B2 68 26.9
C1 42 16.6
C2 10 3.9
Figure 5 - Descriptive VAS ratings represent-ing attractiveness evaluation for each appli-ance type.
Table 4 - Statistical comparison of the VAS ratings representing attractiveness evaluation with Friedman ANOVA for repeated measures (p < 0,001) and
Dunn’s post-hoc test by gender.
* Distinct superscripts indicate statistical significance.
Table 3 - Statistical comparison of the VAS ratings representing attractiveness evaluation with Friedman ANOVA for repeated measures (p < 0.001) and
Dunn’s post-hoc test.
* Distinct superscripts indicate statistical significance.
n = 252
VAS Median 25% Percentile 75% Percentile
A) Sapphire brackets with metal archwire 54a 38 70
B) Clear aligner with attachments 68a 37.5 83
C) Golden metal brackets 17b 7.5 39.5
D) Self-ligated metal brackets 30b 15 48.5
E) Metal brackets with gray ties 34b 20 53.5
F) Sapphire brackets with esthetic archwire 69a.c 53 82.5
G) Clear aligner without attachments 81c 55 92
H) Metal brackets with green ties 29b 13 50
Males (n = 152)
VAS Median 25% Percentile 75% Percentile
A) Sapphire brackets with metal archwire 53a 40 67
B) Clear aligner with attachments 66.5a.b 38 83
C) Golden metal brackets 15.5c 5 42.75
D) Self-ligated metal brackets 30c.d 14 47.75
E) Metal brackets with gray ties 34d.e 20.25 54
F) Sapphire brackets with esthetic archwire 68b.f 53 84.5
G) Clear aligner without attachments 76f 48.25 92
H) Metal brackets with green ties 29.5c.d.e 13.25 50
Females (n = 100)
VAS Median 25% Percentile 75% Percentile
A) Sapphire brackets with metal archwire 53a,b 36 74
B) Clear aligner with attachments 71a,c 38 85
C) Golden metal brackets 20c 11 38
D) Self-ligated metal brackets 31d 18 50
E) Metal brackets with gray ties 32d 19 52
F) Sapphire brackets with esthetic archwire 71b 51 81
G) Clear aligner without attachments 83c 63 93
H) Metal brackets with green ties 27d 11 50
A) Sapphire brackets with metallic archwire
C) Golden metal brackets D) Self-ligating metal brackets E) Metal brackets with gray ties F) Sapphire brackets with esthetic archwire G) Clear aligner without attachments H) Metal brackets with green ties 150
100
50
A B C D E F G H
Median - V
AS r
atings
0
Figure 6 - Descriptive VAS ratings representing attractiveness evaluation for appliance type by gender.
Figure 7 - Descriptive VAS ratings representing attractiveness evaluation for appliance type by age.
17 - 26 years (n = 128)
VAS Median 25% Percentile 75% Percentile
A) Sapphire brackets with metal archwire 52a 39 67
B) Clear aligner with attachments 72a,b 42 84
C) Golden metal brackets 15 5 31
D) Self-ligated metal brackets 32c 16 51
E) Metal brackets with gray ties 36c 23 55
F) Sapphire brackets with esthetic archwire 68b,d 56 81
G) Clear aligner without attachments 83d 63 95
H) Metal brackets with green ties 31c 16 47
27 - 63 years (n = 124)
VAS Median 25% Percentile 75% Percentile
A) Sapphire brackets with metal archwire 54a 36 75
B) Clear aligner with attachments 63a,b 33.5 83.5
C) Golden metal brackets 22 c 9 53.5
D) Self-ligated metal brackets 27c 11.5 43.5
E) Metal brackets with gray ties 29c 15 52
F) Sapphire brackets with esthetic archwire 70a,d 47 85
G) Clear aligner without attachments 75b,d 48 91.5
H) Metal brackets with green ties 26c 10 57
Table 5 - Statistical comparison of the VAS ratings representing attractiveness evaluation with Friedman ANOVA for repeated measures (p < 0,001) and
Dunn’s post-hoc test by age.
* Distinct superscripts indicate statistical significance.
150 Male gender
Median - V
AS r
atings
Median - V
AS r
atings
100
50
A B C D E F G H
0
150 Female gender
100
50
A B C D E F G H
0
Median - V
AS r
atings
Median - V
AS r
atings
150 Age 17-26 150
100 100
50 50
A B C D E F G H
0 0
Age 27-63
Table 6 - Spearman rank correlation coefficients and p values between VAS score differences and attributed value (WTP).
*p < 0.05; **p < 0.01.
Total sample (n = 152) Attributed value (WTP) Attributed value (WTP)
SHEET 2 Personal attributed value Children attributed value
Difference VAS score A (Sapphire brackets with metal archwire) - VAS score E (Metal brackets with gray ties)
0.141* (p = 0.021)
0.090 (p = 0.143)
SHEET 3 Personal attributed value Children attributed value
Difference VAS score A (Sapphire brackets with metal archwire) - VAS score B (Clear aligners with attachments)
-0.211** (p < 0.001)
-0.217** (p < 0.001)
Table 7 - Spearman rank correlation coefficients and p values between VAS score differences and attributed value (WTP) by gender.
*p < 0.05; **p < 0.01.
Males (n = 152) Attributed value (WTP) Attributed value (WTP)
SHEET 2 Personal attributed value Children attributed value
Difference VAS score A (Sapphire brackets with metal archwire) - VAS score E (Metal brackets with gray ties)
0,141 (p = 0,067)
0,070 (p = 0,364)
SHEET 3 Personal attributed value Children attributed value
Difference VAS score A (Sapphire brackets with metal archwire) - VAS score B (Clear aligner with attachments)
-0,340** (p < 0.001)
-0,289** (p < 0.001)
Females (n = 100) Attributed value (WTP) Attributed value (WTP)
SHEET 2 Personal attributed value Children attributed value
Difference VAS score A (Sapphire brackets with metal wire) - VAS score E (Metal brackets with gray ties)
0.143 (p = 0.162)
0.130 (p = 0.205)
SHEET 3 Personal attributed value Children attributed value
Difference VAS score A (Sapphire brackets with metal wire) - VAS score B (Clear aligner with attachments)
-0.224* (p = 0.027)
-0.213* (p = 0.036)
Table 8 - Spearman rank correlation coefficients and p values between VAS score differences and attributed value (WTP) by age.
*p < 0.05; **p < 0.01.
17 – 26 years (n = 128) Attributed value (WTP) Attributed value (WTP)
SHEET 2 Personal attributed value Children attributed value
Difference VAS score A (Sapphire brackets with metal archwire) - VAS score E (Metal brackets with gray ties)
0.161 (p = 0.064)
0.089 (p = 0.309)
SHEET 3 Personal attributed value Children attributed value
Difference VAS score A (Sapphire brackets with metal archwire) - VAS score B (Clear aligner with attachments)
-0.370** (p < 0.001)
-0.311** (p < 0.001)
27 – 63 years (n = 124) Attributed value (WTP) Attributed value (WTP)
SHEET 2 Personal attributed value Children attributed value
Difference VAS score A (Sapphire brackets with metal archwire) - VAS score E (Metal brackets with gray ties)
0.093 (p = 0.293)
0.048 (p = 0.588)
SHEET 3 Personal attributed value Children attributed value
Difference VAS score A (Sapphire brackets with metal archwire) - VAS score B (Clear aligner with attachments)
-0.218* (p = 0.013)
Table 9 - Spearman rank correlation coefficients and p values between socioeconomic status and attributed value (WTP).
*p < 0.05; **p < 0.01.
n = 252 Attributed value (WTP) Attributed value (WTP)
SHEET 2 Personal attributed value Children attributed value
Socioeconomic status 0.367**
(p < 0.001)
0.164** (p < 0.001)
SHEET 3 Personal attributed value Children attributed value
Socioeconomic status 0.375**
(p < 0.001)
0.172** (p < 0.001)
For this reason, this study’s findings have direct clinical implications for the orthodontics practice. Orthodontists must choose between available ap-pliances to provide options that are acceptable to patients and work in harmony with their biome-chanical philosophy. This study showed that there were four general preference levels regarding types of appliances based on their appearance: 1) Clear aligners are preferred over sapphire appliances, except when attachments are present on anterior teeth; 2) In these cases, sapphire appliances with esthetic wires are preferred over the clear trays, but this was not statistically significant; 3) Sapphire brackets with both archwires are also preferred over stainless steel, but among those, traditional metal brackets with gray ties were preferred over self-ligated brackets and over metal brackets with green ties; 4) Golden metal brackets had the worse esthetic perception in this sample.
In the present study, all raters were University students or employees. This could have introduced bias into the results; especially with regard to their cultural and social background.26 This was the main
reason to apply a socioeconomic survey that allowed investigating whether it would inluence the results. The survey showed that this sample was homoge-neously distributed between the status A2, B1, B2 and C1 and socioeconomic status did not inluence the esthetic perception of the appliances. However, it did inluence the WTP for a more esthetic appliance.
Another issue worth discussing was the brack-ets positioning, which in spite of the 0.020-in arch-wire used as reference, showed minor variations.
However, it is most likely that these minor varia-tions did not significantly impact our findings, es-pecially because all appliances were installed on a model with well-aligned teeth. Although this situ-ation might not represent the clinical appearance of these appliances during the early stages of treat-ment, well-aligned teeth were chosen to reduce variables that could distract from the evaluation of appliance esthetics and allow a more accurate com-parison with the results of previous studies.
A similar study was recently carried out,6
inter-estingly, however, no signiicant diferences were found between metallic, golden, and ceramic brack-ets for any of the assessed sample. Golden appliances are not widely used, leading the authors to believe that this may have inluenced the results, since raters would not be able of identifying it properly Neverthe-less, the present study showed that this brackets had the worse esthetic perception in the studied popula-tion. According to Jeremiah et al,6 the clear aligner
also had the higher attractiveness ratings. These indings indicate that a reduced appliance visibility appears to be the standard for social acceptance, cor-roborating our indings. In the present study, when the clear aligner was noticed, due to the presence of anterior attachments, it became less attractive than ceramic brackets. However no other study has pre-viously evaluated the perception of anterior attach-ments, therefore, these results cannot be compared with other population.
Roswall et al3 and Ziuchkovski et al4 also
The authors found that the overall trend in appli-ance attractiveness seems to relate to the amount of visible metal. Clear tray appliances with no visible metal received the highest ratings in attractiveness. Authors believe that this could explain why alter-native orthodontic appliance systems such as clear tray aligners have grown in popularity.18 In fact,
the present study and other three3,4,6 researches
have shown similar results about clear tray align-ers. Besides the positive esthetic perception and the increasing consumer and professional demand for such appliances, questions regarding this system’s efficacy requires further research, since there is still much to learn about its biomechanics.19,20
A possible reason for the marked diferences in the results shown by Jeremiah et al6 and Ziuchkovski
et al,4 Roswall et al,3 and the present study,
regard-ing the perception of esthetic and metal brackets is that Jeremiah et al6 used standardized full-face
pho-tographs of a young adult female, whereas the other studies used smiles with no strong gender markers in the circum-oral region. The indings from Berto et al,21 who also used standardized lateral full-face
close-ups photographs (modiied by adding appli-ances) of a young female adult, difer from all studies discussed above. In their study, Brazilian laypeople perceived a smile with an esthetic appliance as sig-niicantly less attractive than a smile with a metal appliance or with no appliance. This could have been caused due to a diferent perception of the sapphire appliance, used in the present study, and the ceramic appliance, used in Berto et al21 and Jeremiah et al6
studies. On the other hand, this possibility is ques-tionable once Roswall et al3 and Ziuchkovski et al4
also used ceramic brackets and found results that corroborates the present study.
It is important to know whether the attractiveness of a smile is inluenced by the type of photographic framing used in the analysis. In addition, one must an-alyze methodologies that might inluence the results achieved, such as, the order and fashion of presenting the photographs and the scale used to evaluate the per-ception.22 Some authors believe that facial structures,
such as nose and chin, may act as confounding factors, as my also happen with gender markers apparent in the smile, and therefore inluence the smile evaluation.23
The model’s gender is very inluential when grading
smiles attractiveness, as was found by Thomas et al.24
The use of a Lickert scale to rank esthetic perception and a structured questionnaire about characteristics strongly associated with the model’s physical appear-ance may also have inluenced the results of Jeremiah et al,6 since all other studies used a VAS scale.
Similarly, the sample’s characteristics can also be related to diferences in indings. In this study, raters’ age and gender inluenced attractiveness perception of the appliances. Younger patients (17-26 years old) evaluated sapphire appliances and clear aligners more positively, i.e. with highest scores, and golden and me-tallic brackets with green ties with worse scores than patients aged 27-63 years. Regarding gender, men showed a general tendency to assign lower scores than women for all evaluated appliances. Male subjects rated sapphire appliances and clear aligners without attachments statistically equal. On the other hand, for women there was no diference between clear align-ers with and without attachments, convalign-ersely to what happened to men who perceived attachments nega-tively. Metallic brackets with gray and green ties and also self-ligated metal appliances were similar for women, but gold metal brackets had worse evaluation. Men also perceived metal brackets diferently, consid-ering only traditional metal appliances with gray ties more attractive than the others. Walton et al25 also
found signiicant diferences in esthetic perception of appliances between genders and diferent age groups.
WTP method was used to evaluate the attributed value of various orthodontic appliances by means of a cost-beneit analysis. The WTP was assessed us-ing the payment scale method, described in Table 1, rather than an open-ended format due to the study design and also because no diference was found be-tween these two methods in previous studies.26
This may be the reason for the different result found by Roswall et al,3 in which sample, raters
with higher socioeconomic status responded with the highest WTP values for lingual appliances and a clear tray aligner. In another socioeconomic reality, different results may be found in Brazilian samples, therefore indicating that more studies are neces-sary to further conclusions regarding the subject. Therefore, it is important to note that this study’s results cannot be indiscriminately applied to other cultural groups, with socioeconomic differences. These aspects must be analyzed and considered in this kind of analysis. When patients declared they would pay more for the esthetic appliances, adults were equally willing to pay more for appliances they deemed more desirable for their children too.
Gender had no signiicant inluence on WTP, how-ever, male subjects had a greater trend to pay more for treatment with a clear aligner. However, age had a signiicant inluence in WTP for appliances compared in sheet 3, with younger patients being signiicantly more willing to pay more for a clear aligner. Similarly, attractiveness analysis was also inluenced by age, as previously described. Walton et al25 evaluated children
and adolescents and found that they also showed high preference for clear tray aligners. However, following the aligners, child preferred metal appliances with colored ties above all other options. This was an op-posite perception when compared to adults’ rates and suggests that the comparison between diferent age groups inluenced appliances’ perceived esthetics and
could also have an efect on the attributed value. How-ever, more studies comparing diferent age groups are required for deinitive conclusions on the subject.
CONCLUSION
Orthodontic appliance attractiveness varied significantly by the following hierarchy of appli-ance types: Clear tray aligners > sapphire brackets > stainless steel traditional and self-ligating brack-ets > golden metal appliances. Metal appliances, commonly used in orthodontic practice, were con-sidered unattractive, while clear aligners and sap-phire appliances were considered better esthetic options. Nevertheless, patients are not willing to pay more for appliances they deem more esthetic. On the other hand, socioeconomic status and age was significantly correlated with WTP. Higher so-cioeconomic level and age between 17 and 26 years old were significantly correlated with the willing-ness to pay more for an esthetic appliance. Gender was not significantly correlated with WTP. These data show that results could vary depending on the studied sample. Therefore, a socioeconomic and age analysis is mandatory in this kind of study.
ACKNOWLEDGEMENTS
1. Russel JS. Current Products and Practice Aesthetic Orthodontic Brackets. J Orthod. 2005;32:146-163.
2. Sarver DM, Ackerman JL. Orthodontics about face: the re- emergence of the esthetic paradigm. Am J Orthod Dentofacial Orthop. 2000;117:575-6.
3. Rosvall MD, Fields HW, Ziuchkovski J, Rosenstiel SF, Johnston WM. Attractiveness, acceptability, and value of orthodontic appliances. Am J Orthod Dentofacial Orthop. 2009;135:276.e1-12.
4. Ziuchkovski JP, Fields HW, Johnston WM, Lindsey DT. Assessment of perceived orthodontic appliance attractiveness. Am J Orthod Dentofacial Orthop. 2008;133(Suppl):S68-78.
5. Bergstrom K, Halling A, Wilde B. Orthodontic care from the patients’ perspective: perceptions of 27-year-olds. Eur J Orthod. 1998;20:319-29.
6. Jeremiah HG, Bister D, Newton JT. Social perceptions of adults wearing orthodontic appliances: a cross-sectional study. Eur J Orthod. 2010;33:476-482.
7. Kiyak HA. Comparison of esthetic values among Caucasians and Pacific-Asians. Community Dent Oral Epidemiol. 1981;9:219-223.
8. Miguel JAM, Sales HX, Quintão CC, Oliveira BH, Feu D. Factors associated with orthodontic treatment seeking by 12-15-year-old children at a state university-funded clinic. J Orthod. 2010; 37:100-106.
9. Mugonzibwa EA, Kuijpers-Jagtman AM, Van t Hof MA, Kikwilu EN. Perceptions of dental attractiveness and orthodontic treatment need among Tanzanian children. Am J Orthod Dentofacial Orthop. 2004;125:426-433.
10. Robinson R. Economic evaluation. What does it mean? Br Med J. 1993;307:670-3. 11. Zarnke KB, Levine MAH, O’Brien JO. Cost-benefit analyses in the health care
literature: don’t judge a study by its label. J Clin Epidemiol. 1997;50:813-22. 12. Whynes DK, Frew EJ, Wolstenholme JL. Willingness-to-pay and demand curves: a
comparison of results obtained using different elicitation formats. Int J Health Care Finance Econ. 2005;5:369-86.
13. Associação Brasileira de Empresas de Pesquisa (ABEP). Critério de Classificação Econômica Brasil. São Paulo; 2003.
REFERENCES
14. Hetherington EM, Parke RD, Locke VO. Child psychology: a contemporary viewpoint. 5th ed. New York: McGraw-Hill; 1999.
15. Tayer BH, Burek MJ. A survey of adults’ attitudes towards orthodontic therapy. Am J Orthod Dentofacial Orthop. 1981;79:305-315.
16. Lew KK. Attitudes and perceptions of adults towards orthodontic treatment in an Asian community. Comm Dent Oral Epidemiol. 1993;21:31-35.
17. Kerosuo H, Hausen H, Laine T, Shaw W C. The influence of incisal malocclusion on the social attractiveness of young adults in Finland. Eur J Orthod. 1995;17: 505–512. 18. Keim RG, Gottlieb EL, Nelson AH, Vogels DS 3rd. 2007 JCO orthodontic practice
study. Part 1: trends. J Clin Orthod. 2007;41:617-26.
19. Kravitz ND, Kusnoto B, BeGole E, Obrez A, Agrane B. How well does Invisalign work? A prospective clinical study evaluating the efficacy of tooth movement with Invisalign. Am J Orthod Dentofacial Orthop. 2009; 135:27-35.
20. Sheridan JJ. The readers’ corner. 2. What percentage of your patients are being treated with Invisalign appliances? J Clin Orthod. 2004;38:544-5.
21. Berto PM, Lima CS, Lenza MA, Faber J. Esthetic effect of orthodontic appliances on a smiling face with and without a missing maxillary first premolar. Am J Orthod Dentofacial Orthop. 2009;135:S55-60.
22. Rodrigues CDP, Magnanib R; Machado MSC,Oliveira Jr OB. The Perception of Smile Attractiveness. Angle Orthod. 2009;79:634–639.
23. Dong JK, Jin TH, Cho HW, Oh SC. The esthetics of the smile: a review of some recent studies. Int J Prosthodont. 1999;12:9-19.
24. Thomas JL, Hayes C, Zawaideh S. The effect of axial mid- line angulation on dental esthetics. Angle Orthod. 2003;3:359–64.
25. Walton DK, Fields HW, Johnston WM, Rosenstiel SF, Firestone AR, Christensen JC. Orthodontic appliance preferences of children and adolescents. Am J Orthod Dentofacial Orthop. 2010;138:698.e1-698.e12.