Vol. 7, No. 4, 2004 Zeta Potential Measurement in Bioactive Collagen 631
Materials Research, Vol. 7, No. 4, 631-634, 2004. © 2004
*e-mail: [email protected]
Article presented at the II SBPMat, Rio de Janeiro - RJ, 26-29 de Outubro/ 2003
Zeta Potential Measurement in Bioactive Collagen
Ângela Leão Andradea,b*, José Maria Fontes Ferreirab, Rosana Zacarias Dominguesa
aDepartamento de Química - ICEx - Universidade Federal de Minas Gerais
Av. Antônio Carlos, 6627, 31270-090, Belo Horizonte, Brazil bDepartment of Ceramic and Glass Engineering, CICECO,
University of Aveiro, 3810-193, Aveiro, Portugal
Receive: October 29, 2003; Revised: May 20, 2004
The focus of this work is to show the influence of surface charge on the bioactivity of modi-fied collagen fiber surface. Because silica plays an important role on bone mineralization process, silica obtained by a sol-gel process was used as a surface modification agent. Zeta potential (ξ) of silica-coated and non-coated samples was measured as a function of pH. It was observed a shift in ξvs. pH. The isoelectric point for silica-coated collagen was 6.8, while that of non-treated sample it was near 10. Pure silica has isoelectric point near 2, and the shift observed indicates that at least part of the silica was incorporated onto the surface during the treatment. The ability of samples exposed to biological simulated fluids (SBF) to form a hydroxyapatite layer has been used to recognize bioactive materials. The pH of these biological solutions is about 7.3. It means that treated samples acquire negative charge when in contact with the biological solution and attract ions like Ca2+, HPO
4
2-, and OH- to form HA coatings. Micrographs of chemically treated samples
corroborate this assumption. For treated samples, the formation of a coating layer is clear after 5-day immersion in SBF, while pure collagen remains practically unaltered. Fourier Transform In-frared Spectroscopic (FTIR) analyses confirmed that the coating layer has P-O vibration bands near 1060 cm-1 and 600 cm-1 characteristic of hydroxyapatite (HA).
Keywords:collagen, zeta potential, bioactivity
1. Introduction
A great number of materials have been used with suc-cess as bone substitutes. An important group has the ability to react with living tissues and promote a real interaction with them1,2. This interaction occurs by means of a
hydroxya-patite (HA) layer formed inductively by the implanted ma-terial3,4. Due to experimental difficulties to accomplish in vivo assays5-9, bioactivity was evaluated in a acellular
me-dium which simulates in vivo conditions. The first bioactive materials studied were glasses based on composition in the SiO2-CaO-P2O5-Na2O system10.
Several theories have been proposed to explain the for-mation of this HA layer. In one of them, the basic unit re-sponsible for this growth is the silanol group presents on the material surface11. Another hypothesis is that the
forma-tion of this layer happens when the material surface is nega-tively charged12,13. This negative surface could be able to
attract Ca2+ cations and consequently HPO 4
2- and OH-
ani-ons dissolved in the SBF solution.
Zeta potential has traditionally been measured by elec-trophoresis, because all inorganic particles assume a charge when dispersed in water. By inserting electrodes into a sus-pension and applying a DC Voltage, the carged particles are attracted towards the anode (positive electrode). The veloc-ity of the travelling particles depends on the particle surface charge (or zeta potential) and the voltage applied. Therefore if the velocity can be measured, zeta potential can be deter-mined using the Henry or Van Smolukoski equations.
2. Materials and methods
2.1. Samples and chemical treatment
vi-632 Andrade et al. Materials Research
als with tetraethoxysilane (TEOS) at room temperature for 1 h. After this time, TEOS was eliminated by filtration and the samples from both groups were washed with ethanol.
A silica glass control sample was prepared for zeta po-tential study. In this case, TEOS was added to an acidified (HCl - pH 1.7) aqueous solution, and next added with etha-nol in a molar proportion of H2O:TEOS:CH3CH2OH of 4:1:4. The solution was magnetically stirred until gelation. The material was placed under a humidified atmosphere overnight, and next treated at 400 °C for 2 h.
2.2. SBF immersion test
Individual fiber samples were immersed into a simu-lated body fluid (SBF) in polyethylene vials in a digital tem-perature water bath at 37 °C. SBF and blood plasma ion concentrations are given in Table I. A weight / volume solu-tion ratio equal to 0.002 g/cm3 was used for all samples
tested. SBF immersion tests were made in triplicate. Chemi-cally non-treated samples were removed from the SBF so-lution after 5 days, while the treated ones were removed after 5 and 10 days. All the samples were carefully rinsed twice with distilled water and dried at room temperature after removal from the SBF solution. The rinsing procedure was important to eliminate some aqueous soluble salts, such as NaCl, deposited onto the fiber surfaces. For all experi-ments, the SBF solution was completely removed and re-placed every 48 h by a fresh solution to avoid contamina-tion by microorganisms and to keep the pH close to 7.3.
2.3. Characterization methods
The morphology of the fibers was studied using Scan-ning Electron Microscopy (SEM) (JEOL-JSM 840 A). Prior
to analysis, the samples were fastened to a sample holder with the help of a double carbon ribbon and covered with gold. Energy Dispersive Spectroscopy (EDS) (JEOL-JXA 8900RL) was also used to evaluate semi-qualitatively the composition of the fibers. Sample structure and homogene-ity, and HA layer formation were characterized by compari-son of FTIR spectra (Bomen MB-100C23 FTIR) of different samples. For these analyses, samples were pressed against a diamond sample holder and analyzed in transmission mode. The determination of ζ potential was performed in COUL-TER DELSA 440SX. For this, a suspension of ground mate-rial in deionized water was homogenized with ultrasound for 15 min. Afterwards, another suspension was made by adding drops of the previous suspension into an aqueous solution of KCl 10-3 M. The pH of the initial solution was measured and
adjusted to the range from 2 to 12 with an aqueous solution of either KOH 10-3 M or HNO
3 10 -3 M.
3. Results and discussion
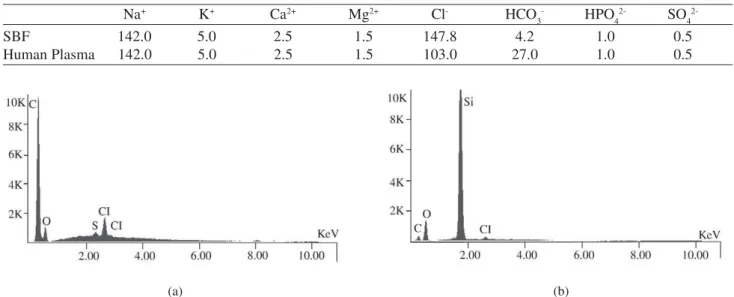
SEM micrographs of TEOS-treated and non-treated fibers did not show significant morphological differences. However, EDS spectra (Fig. 1) showed that the TEOS treat-ment was effective in producing a silica layer on the fiber surface. A Si peak appears, while in those pure collagen it is absent, indicating that this surface was recovered by Si.
Non-treated fibers did not evidence any adherent coat-ing after 5-day SBF immersion. More extended periods were not investigated, because there is a faster fiber degradation after 5 days. Otherwise, treated samples presented a coat-ing after 5 days in SBF, which remained even after water rinsing. This coating was reasonably continuous after 10 days (Fig. 2), and the morphology of the layer was consistent
Table 1. Ionic concentration (mM) of human plasma and of Simulated Body Fluid (SBF).
Na+ K+ Ca2+ Mg2+ Cl- HCO
3
- HPO
4
2- SO
4
2-SBF 142.0 5.0 2.5 1.5 147.8 4.2 1.0 0.5
Human Plasma 142.0 5.0 2.5 1.5 103.0 27.0 1.0 0.5
Figure 1. EDS of collagen fibers: a) from control group, b) chemically treated with TEOS for 1h.
Vol. 7, No. 4, 2004 Zeta Potential Measurement in Bioactive Collagen 633
Figure 2. Collagen sample chemically treated with TEOS for 1h
and immersed in SBF solution for 10 days.
Figure 3. EDS for sample chemically treated with TEOS for 1h
and immersed for 10 days in SBF solution.
Figure 4. FTIR spectra of collagen samples: a) before any
chemi-cal treatment, b) after TEOS treatment, c) immersed for 5 days in SBF solution, d) chemically treated and immersed in SBF solu-tion for 5 days.
Figure 5. Zeta potencial (ξ) of collagen, TEOS-treated collagen,
and glass. with the different immersion times. EDS analysis (Fig. 3)
shows the presence of Ca and P in this coating not seen before immersion in SBF.
FTIR spectra of the different samples before and after SBF immersion for 5 days are shown in Fig. 4. Collagen (Fig. 4a), exhibits typical bands such as C = O stretching at 1653 cm-1 for amide I, N–H deformation at 1545 cm-1 for
amide II and N–H deformation at 1233 and 1281 cm-1 for
amide III band 14–16. The sample bands are observed in the
Fig. 4c.
After TEOS treatment (Fig. 4b), absorption bands at 1170, 1080, 800 and 460 cm-1 due to the Si-O-Si bonds
appeared17,18 together with peaks at 960 and 550 cm-1
asso-ciated to OH and Si-OH bands, respectively19 (Fig. 4b). The
spectrum for treated samples immerged in SBF for 5 days (Fig. 4d) presented other peaks at 1060 cm-1, 598 cm-1
re-ferring to P-O bonds (P-O asymmetric stretch), and 940 cm-1, 603 cm-1, and 560 cm-1 (P-O bending modes)17
char-acteristic of HA, beside bands related to the Si-O-Si bond at 810 cm-1 and 460 cm-1. Longer immersion times enhanced
absorbance at 603 cm-1, and consequently this peak becomes
more clearly defined.
634 Andrade et al. Materials Research
silica glass. The pH corresponding to the isoelectric point (pHIEP) of collagen is about 10. Chemically treated samples exhibited a pHIEP of 6.8, evidencing the partial covering of the collagen surface by silica. As expected, glass pHIEP was 2, similar to silica pHIEP20. This shift from 10 to 6.8 was
suf-ficient to charge the material surface negatively when in con-tact with the SBF solution. This explains why treated fibers show a bioactive behavior, while not-treated ones do not.
4. Conclusions
TEOS treatment applied to collagen fibers resulted in a silica coating that decreased pHIEP, from 10, for pure colla-gen, to 6.8. This shift was sufficient to charge the material negatively when in contact with the SBF solution. This re-sult can explain why treated collagen shows a bioactive behavior, while non-treated collagen does not. Moreover, TEOS treatment enhances fiber degradation time in physi-ological solution.
Acknowledgments
One of the authors (ALA) acknowledges support of Bra-zilian Government - Conselho Nacional de Desenvolvimento Científico e Tecnológico (CNPq).
References
1. Hench, L.L. Advances in Ceramics Processing, In: Bincenzini P, ed.. Imola, Faenza, p. 92-100, 1978. 2. Hulbert, S.F.; Hench, L.L.; Forbers, D.; Bowman, L.S.
Ceramics Int, v. 8, p.131- 140, 1982.
3. Haman, J.D.; Scripa, R.N.; Rigsbee, J.M.; Lucas, L.C.
Journal of Materials Science: Materials in Medicine, v. 13, n. 2, p. 175-184, 2002.
4. Mucalo, M.R.; Yokogawa, Y.; Suzuki, T.; Kawamoto, Y.; Nagata, F., Nishizawa, K. Journal of Materials Science: Materials in Medicine, v. 6, n. 11, p. 658-669, 1995.
5. Kokubo, T.; Kushitani, H.; Sakka, S.; Kitsugi, T.; Yamamuro, T. Journal of Biomedical Materials Research, v. 24, n. 6, p. 721-734, 1990.
6. Kokubo, T. Journal of Non-Crystalline Solids, v. 120, n. 1-3, p. 138-151, 1990.
7. Andersson, O.H.; Karlsson, K.H. Journal of Non-Crys-talline Solids, v. 129, n. 1-3, p. 145-151, 1991.
8. Kokubo, T.; Kushitani, H.; Ohtsuki, C.; Sakka, S.; Yamamuro, T. Journal of Materials Science: Materials in Medicine, v. 3, n. 2, p. 79-83, 1992.
9. Kasuga, T.; Nakagawa, K.; Yoshida, M.; Miyade, E. Jour-nal of Materials Science, v. 22, n. 10, p. 3721-3724, 1987. 10. Hench, L.L.; Splinter, R.J. Journal Biomedical Material
Research, v. 36, p. 117-141, 1971.
11. Hench, L.L. Journal of the American Ceramic Society, v. 74, n. 7, p. 1487-1510, 1991.
12. Hwang, K.S.; Song, J.E.; Jo, J.W.; Yang, H.S.; Park, Y.J.; Ong, J.L.; Rawls, H.R. Journal of Materials Science: Materials in Medicine, v. 13, n. 1, p. 133-138, 2002. 13. Rhee, S.H.; Lee, J.D.; Tanaka, J. Journalof the
Ameri-can Ceramic Society, v. 83, n. 11, p. 2890-2892, 2000. 14. Payne, K.J.; Veis, A. Biopolymers, v. 27, n. 11, p.
1749-1760, 1988.
15. Doyle, B.B.; Bendit E.G.; Blout, E.R. Biopolymers, v. 14, n. 5, p. 937–957, 1975.
16. Paschalis, E.P.; Betts, F.; DiCarlo, E.; Mendelsohn, R.; Boskey, A.L. Calcified Tissue International, v. 61, n. 6, p. 480-486, 1997.
17. Bertoluzza, A.; Fagnano, C.; Morelli, M.A.; Gottardi, V.; Guglielmi, M. Journal of Non-Crystalline Solids, v. 48, n. 1, p.117-128, 1982.
18. Matos, M.C.; Ilharco, L.M.; Almeida, R.M. Journal of Non-Crystalline Solids, v. 147, p. 232-237, 1992. 19. Yoshino, H.; Kamiya, K.; Nasu, J.Non-Crystalline
Sol-ids, v. 126, n. 1-2, p. 68-78, 1990.