*e-mail: [email protected]; [email protected] Received: 18 February 2014 / Accepted: 08 September 2014
Study of muscle fatigue in isokinetic exercise with estimated
conduction velocity and traditional electromyographic indicators
Fabiano Peruzzo Schwartz1*, Martim Bottaro2, Rodrigo Souza Celes2, Maria Claudia Pereira2,
Valdinar de Araújo Rocha Júnior1, Francisco Assis de Oliveira Nascimento1
Abstract Introduction: In the study of human biomechanics, it is often desirable to evaluate fatigue in the muscles that are involved in performing a particular task. Identifying the phenomena responsible for this condition is a problem that in most cases is complex and requires appropriate research mechanisms. Isokinetic dynamometry (ID) and surface electromyography (SEMG) are two techniques widely used in studies on strength and muscle fatigue. Their effectiveness is conditioned upon a good understanding of their limitations and the adoption of procedures to fully exploit the potential of each one. The main goal of the present study is to verify whether the electromyographic parameters, especially the conduction velocity (CV), are sensitive to the fatigue instauration process within sets of maximal isokinetic contractions. CV is a basic physiological parameter directly related to muscle activity and still little explored in experiments combining ID and SEMG.
Methods: Instrumentation architecture that combines ID and SEMG was used to estimate electromyographic and biomechanical parameters in protocols of maximum intensity isokinetic knee extension exercises. This
architecture allows for limiting the parameter estimates to a specii c region of isokinetic exercise, called the
isokinetic load range (ILR), where one can consider that the angular velocity is constant and the SEMG signals are cyclo-stationary. Electromyographic signals were acquired using an array of electrodes. Conclusion: The results suggest that CV and the other SEMG parameters, including amplitude and frequency descriptors, are sensitive to detect a fatigue process only in protocols that restrict the analysis to ILR and that also bring the subject to a state of fatigue quickly.
Keywords Muscular fatigue, Dynamic contraction, Isokinetic dynamometry, Surface electromyography.
Introduction
Surface electromyographic signals have attracted great attention from areas that address sports and orthopedic medicine, physiotherapy and biomechanics. One of the main reasons for the wide interest in surface electromyography (SEMG) is based on the possibility of accessing the muscular structure and function through a non-invasive process (Merletti and Parker, 2004). In sport sciences, particularly in the area of high performance sports, research into muscular fatigue phenomena during dynamic activities is the subject of interest (Clarys, 2000). Obtaining the parameters indicative of muscular fatigue can help in proposing new experimental protocols and developing new techniques for evaluating sport performance.
In general, fatigue may be dei ned as a reduction in
the ability of a muscle to generate force or power in an induced exercise (Gandevia et al., 1996; Søgaard et al., 2006). Identifying the phenomena responsible for this condition is a problem that most of the time it is complex. The physiological issues that cause muscle fatigue vary from the accumulation of metabolites
in muscle i bers to the possibility of an incorrectly
generated command by the motor cortex (Enoka and
Duchateau, 2008). Therefore, the main challenge of SEMG studies is to properly identify the electrical manifestation related to such phenomena.
In static contractions, the accumulation of biochemical byproducts within the muscle is the main fatigue phenomenon, which is known as localized fatigue and results in myoelectric signal non-stationarities, such as the frequency scaling of the power spectrum (Basmajian and De Luca, 1985). This behavior of the myoelectric signal is called slow non-stationarity (or quasi-stationarity), given that the SEMG signal may preserve its characteristics during several seconds (Bonato et al., 2001), after which new
muscle i ber recruitment starts changing the signal
properties (Farina, 2006). It is well established in
scientii c literature on fatigue analysis that under
quasi-stationary conditions, the amplitude parameters (e.g.,
average rectii ed value and root mean square) tend to
conditions the assumption of quasi-stationarity does not hold because the frequency content of the signal continuously changes over time. Changes in muscle length, force, and electrode position contribute to the fast non-stationarities of the SEMG signal, which are unrelated to localized fatigue. Therefore, certain techniques are used to minimize fast non-stationarities by setting out a range in which the mechanical changes of muscles are cyclic, i.e., they are repeated periodically (Bonato et al., 2001). According to Farina (2006), the study of fatigue in the dynamic case must
necessarily go through identiication of the proper
conditions in which SEMG signals may be assumed
to be relatively stationary. Hence, speciic protocols
must be developed in order to limit and isolate the factors that cause fast non-stationarities.
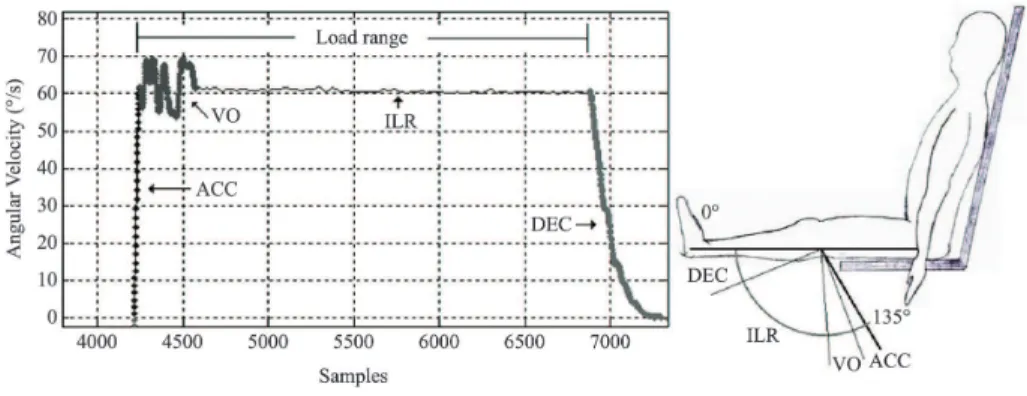
A suitable technique that aids the study of muscle fatigue in SEMG signals in avoiding fast non-stationarities is isokinetic dynamometry (ID), because it makes it possible to (1) perform controlled cyclic dynamic contractions, (2) isolate each constituent phase of the cycle, and (3) estimate the respective biomechanical variables. The isokinetic dynamometer is a device that controls the speed and execution of the exercise. More force being exerted on the dynamometer lever increases the energy absorbed from the member in movement by the control mechanism and returned as additional resistance to the movement (Brown et al., 1995a, 1995b). Therefore, the movement occurs at a predetermined constant speed during a range of movement called the load range (LR) (Brown, 2000), where the dynamometer imposes an external load in opposition to the movement. In fact, the speed is constant only in the LR part where the imposed load matches the muscular force exerted. Schwartz et al. (2010) called this part isokinetic load range (ILR) and they showed that ILR is the range where the
SEMG signal has the highest level of stationarity (Schwartz et al., 2012). There is another range of LR called velocity overshoot (VO), prior to the ILR, where the speed oscillates when the dynamometer is still adjusting to the force applied. Figure 1 illustrates the stages of the knee extension isokinetic exercise.
There are many fatigue studies that estimate amplitude and frequency indicators combining the SEMG and ID techniques given their recognized
applicability. Horita and Ishiko (1987) veriied that the
median frequency of SEMG signal decreased during isokinetic knee extensions performed for 30 s and 60 s. Molinari et al. (2006) studied the manifestations of
muscle fatigue during concentric extension-lexion
and eccentric isokinetic movements of the knee; they also observed an accentuated decrease in MNF value due to fatigue process. Kellis (1999) assessed the SEMG in a knee extension isokinetic endurance test and reported an increment in the signal amplitude of the middle and the last repetitions in comparison
to the values of the irst contractions. Gerdle et al.
(2000) examined SEMG signals in individuals who
performed 100 isokinetic knee extensions and veriied
that frequency parameters are more correlated to torque reduction than to amplitude variables.
However, the effectiveness of the conduction velocity indicator to describe fatigue in experiments combining ID and SEMG seems to be little explored. The conduction velocity (CV), defined as the velocity with which the action potential spreads through the muscle fibers (Merletti et al., 1990), is a basic physiological parameter that has been proven to be related to muscle fatigue during cycling activities (Farina et al., 2004; Lenti et al., 2010; Pereira et al., 2013). González-Izal et al. (2010) investigated the CV behavior during four sets of isokinetic concentric and
eccentric contractions. They have found that CV presented a significant decrement between the first and the last 10 repetitions of the test. To the best of our knowledge, this is the only study that has evaluated the CV behavior in isokinetic exercise.
During the development of the present research,
no studies were found in scientiic literature
that estimated CV in multiple sets of isokinetic contractions at different angular velocities. Moreover, no other study has also considered the estimate of CV and traditional electromyographic parameters only within the ILR segment. According to Schwartz et al.(2012), the ILR is the segment where the best levels of stationarity of SEMG signal are found. Based on the aforementioned, the main goal of this paper is to present an experimental protocol for investigating muscle fatigue to consider, with the aid of an integrated instrumental architecture, these two factors that were never found together in related experiments: (1) the estimation of CV at different angular velocities of isokinetic contractions, and (2) the estimation of SEMG fatigue parameters within the ILR. Additionally, biomechanical descriptors were also estimated in ILR to provide greater consistency to the analysis. The main expectation was to observe, under what are supposed to be the best experimental conditions, if the trends of these descriptors are coherent with those normally reported for the case of static exercise (or isometric contraction).
Methods
Sixteen healthy male subjects participated in the experiment on fatigue investigation, aged 26.8 ± 4.7 years old, height 1.76 ± 0.05 m and body mass of 79.2 ± 9.4 kg, with no history of orthopedic diseases. They read and voluntarily signed a consent form before participating in the experiment, which was approved by the Health Sciences College Ethics Committee at the University of Brasília (UnB).
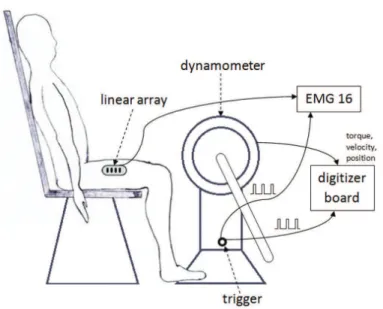
The instrumentation architecture (Figure 2) proposed by Schwartz et al. (2011) was assembled in the laboratory to allow electromyographic and biomechanical signals to be acquired in a synchronized way with equal sampling rates.
An isokinetic dynamometer (Biodex Corporation, Biodex System 3 Pro model) was calibrated and prepared for performing the knee joint controlled exercises in the isokinetic concentric mode (Brown, 2000). The dynamometer control software was the System 3 (Biodex Medical Systems, v. 3.4 17/05/2006) application. The knee joint was passively moved to a 0° position of extension, which corresponds to the
maximum possible extension. After, the knee was lexed
approximately 5° to 10° to a comfortable position, recorded in the dynamometer control system as the maximum extension point for the experiment (extension
mechanical stop). Then, the maximum lexed point (lexed mechanical stop) was deined to guarantee
an 85° range of motion. The analysis of gravity compensation was performed by Biodex System 3
Pro software control. The DB-15 interface of the dynamometer was connected to an adapter built with three BNC connections (one for each biomechanical signal) connected to an A/D converter (National Instruments, model BNC-2120) which digitized the biomechanical signals to 2,048 samples/s and 12 bit resolution, with the aid of an experiment control application based on a LabVIEW v. 5.1 (National Instruments) tool. This procedure was established to match the temporal resolution of the biomechanical signals to the SEMG signals – a necessary condition for a joint analysis – given that the internal A/D conversion of the isokinetic dynamometer takes place only at 100 samples/s. The SEMG signals were acquired during vastus lateralis muscle contractions,
through a lexible linear array (Ottino Bioelettronica)
with eight electrodes (5 mm between electrodes) positioned between the innervation zone and the tendon region (De Luca, 1997; Masuda et al., 1985). The electrode array was attached to a multichannel electromyograph (LISiN–OT Bioelettronica Snc,
EMG-16 model) conigured for digitizing the signals
at a rate of 2,048 samples/s (12 bit resolution) with
a gain of 2,000. The EMG-16 also ilters the signal acquired with a bandpass ilter (4th order Bessel ilter
with –3 dB bandwidth = 10-500 Hz). The EMG-16 control software was Emgacq v. 1.0 (Centro di Bioingegneria, Politecnico di Torino). A position sensor composed of a magnetic switch (attached to the body of the dynamometer) and a magnet (attached to the movement rod) recorded the exact time of each knee extension. This information was sent simultaneously to the electromyograph and to the A/D converter, which enabled the subsequent synchronization of the biomechanical signals to the SEMG signals.
Once the equipment was set up, each subject performed three (3) sets of ten (10) repetitions of maximal concentric extensions at 60º/s with one minute of rest between sets. After 20 minutes, which is reported as time enough to provide full recovery of muscle function in isokinetic tests (Bilcheck et al., 1993; Pinciveiro et al., 1998), the three sets were repeated at 180º/s, with the same rest period between sets. A consistent and moderate verbal encouragement (without shouting) was given during the execution of each set in order to get the maximum performance from each subject, and no visual feedback on the torque produced in each repetition was available to the participants (McNair et al., 1996).
With the aid of a computer interface (Schwartz et al., 2008) developed to perform the algorithms for signal analysis proposed by Schwartz et al. (2011), the segments of the SEMG signal related to the VO and ILR steps (see Figure 1) were extracted from the 10 repetitions in all of the three sets, for both angular velocities (60º/s and 180º/s) and for all of the subjects.
The mentioned interface is responsible for, among other things, making the gravity compensation for the analog signals.
The criteria for choosing the SEMG channel for estimating the electromyographic descriptors took place by verifying the signal-to-noise ratio through the idle-channel noise method (Schwartz et al., 2011). In this technique, the noise signal was captured with the electrode array already attached to the muscle with the subject, however, in a relaxed state (without voluntary muscle contraction). Only channels with a signal-to-noise ratio greater than 20 dB were considered.
The fatigue indicators studied were the temporal
amplitude parameters (Average Rectiied Value
(ARV) and Root Mean Square (RMS)), the frequency parameters (Median Power Frequency (MDF) and Mean Power Frequency (MNF)) (Farina and Merletti, 2000), and the Conduction Velocity (CV) (Farina and Merletti, 2004). Since CV is the main parameter investigated, it is thoroughly described below.
Conduction velocity
The representative model for an array of SEMG sensors with M channels can be represented according to Farina and Merletti (2004) as
[ ] 1[ ] [ ]; 0,1, 1; 0,1, , 1
m m
x n =x n− ζ +m e n m= …M− n= …N− (1)
where xm[n] corresponds to a delayed version of the sequence x1[n], ζ is the time delay between two adjacent
channels of SEMG in the arrangement of sensors, N is the number of samples in the observation window, M is the number of channels acquired in SEMG array of sensors and em[n] corresponds to m-channel additive white noise with Gaussian probability density function
with variance σe and average µe.
The problem is modeled by the technique of maximum-likelihood estimation (MLE). Since the distance between successive SEMG electrodes is
known, calculating the parameter ζ is desired (delay
in samples between adjacent channels) to estimate the muscle conduction velocity. Therefore, a squared error 2
MLE
ξ function must be established. The solution of the problem is obtained by minimizing the 2
MLE
ξ
in function of the variable ζ. The squared error is deined as
2 1 2
0
1
1 M
m
MLE m
M
− =
ξ = − ∑ ξ (2)
and
[ ]
( ) 22 1 1
0 0,
1 1
N M
n r r m
m xm n xr n m r
M
− −
= = ≠
ξ =∑ − − ∑ + − ζ (3)
[ ] [ ] ( ) [ ] 2
2
1 1 2
2 2 1 2
0,
0 0
2 1 2
, 1
j
N N
m r k
M N
r r m
m k Xmk Xr k e k k
N M N
π
− − − ζ −
= ≠
= =
ξ = ∑ − − ∑ = ∑ γ ζ (4)
where DFT of length N samples xm[n] is deined as
[ ]
1[ ]
20
2 jkn
N N
n
m m
X k x n e
N
− π −
=
= ∑ (5)
The irst derivative of 2
MLE
ξ is of the form
[ ]
{
}
{
[ ]
}
[ ]
{
}
{
[ ]
}
2 1 2 0 , , 4 , , N MLE k Re k Re kN Im k
Im k
− =
∂ γ ζ
γ ζ +
∂ζ
∂ξ = ∑
∂ζ ∂ γ ζ
γ ζ
∂ζ
(6)
and the second derivative of 2
MLE
ξ is shown in Equation 7. [ ] { } {[ ]} {[ ]} [ ] { } {[ ]} {[ ]} 2 2 2
2 2 1
2 0
2 2 2
2 , , , 4 , , , N MLE k
Re k Re k
Re k
N Im k Im k
Im k
− =
∂ γ ζ ∂ γ ζ
+ γ ζ +
∂ζ ∂ζ
∂ ξ = ∑
∂ζ ∂ γ ζ ∂ γ ζ
+ γ ζ
∂ζ ∂ζ
(7)
To obtain the minimum 2
MLE
ξ as a function of ζ
the Newton’s iterative method is applied
2
1 2 2
2
, 1, 2, MLE i i MLE i + ∂ξ ∂ζ
ζ = ζ − = …
∂ ξ ∂ζ
(8)
where i is the i-th iteration of the algorithm. The process should stop when it reaches a threshold error,
when the parameter ζ increasing is not signiicant
from one iteration to the next, or when a set amount of iterations is reached. The conduction velocity can
inally be estimated by
( )
/
d
CV= cm s
ζ (9)
where d is the distance between successive SEMG electrodes.
Fatigue indices
In the experimental procedure, the acquired SEMG signals are segmented into windows of 256 samples (125 ms). Successive windows have an overlap of 64 samples (31.25 ms). At each analysis window, the temporal and frequency parameters are calculated, temporally arranged and plotted. For this set of points, a linear regression function is estimated to describe the behavior of the respective parameter as the experimental protocol is performed (see Figure 3a).
The fatigue analysis is usually based on indices
that relect the evolution, during contraction time,
of measurable quantities such as force and angular velocity, which are biomechanical parameters, or variables associated with the SEMG signal (Merletti and Parker, 2004). In the present investigation, the evolution of the SEMG parameters was performed by determining regression lines from the signal acquired during isokinetic repetitions. From this point, a fatigue
index was obtained by considering the corresponding regression line slope (Merletti et al., 1990). The angular
coeficient (slope) of the regression linear function is normalized by the respective linear coeficient (initial
value). Then, it was used as an index of fatigue (Bolgla and Uhl, 2007; Merletti et al., 1990) as showed in Equations 10a, 10b, and 11.
y= +a bx (10a)
1 b
y x
a
= + (10b)
/
IF=b a (11)
where “x” is associated with the runtime of experimental protocol, “b/a” is the slope that represents the index associated with the muscle fatigue phenomenon, and “y” represents the amplitude of temporal or frequency parameter. Figure 3 illustrates the linear regression function and the respective index of fatigue (IF).
Two biomechanical variables, PT (peak torque) and PTBW (peak torque to body weight), were also
estimated to aid in analysis. In the irst case, PT
was considered for each of the 10 repetitions in the isokinetic set and the linear regression line in each set was determined. From here, the fatigue index of PT was calculated in the same way as Equations 10a, 10b, and 11. This index allows for the observation of the behavior of the variable within the set. In the second
case, the maximum value of PTBW was identiied
among the 10 repetitions of a set and the average was calculated among all of the subjects for the same set. In this case, the index permits the observation of the behavior among the sets.
Statistical analysis
Statistical comparisons of fatigue indicators were carried out among the sets at the same angular velocity,
with a signiicance level of 0.05 (double-tailed) and 95% conidence interval. A Shapiro-Wilk (De Sá,
2007) test for normality was used, which is reliable for small sample numbers (approximately 10). For comparing the averages between two datasets, the
t-Student test for dependent samples was utilized for normal distributions and the Wilcoxon Signed-Rank test was used for non-normal ones. When comparing the averages among three datasets, the One-Way ANOVA test together with Tukey’s HSD (post hoc) test was used for normal distribution whereas the Friedman test was used for the non-normal case.
Results
Based on the signal-to-noise ratio (> 20 dB) criterion, two subjects were discarded from both the 60º/s and the 180º/s sets. Hence, the average fatigue index was calculated from 14 subjects. Table 1 shows the fatigue index averages for the SEMG descriptors. Figure 4 shows the fatigue index averages for the peak torque and illustrates the averages, in the sets, of the maximum PTBW value of each subject. Table 2 presents statistical analyses where the fatigue index and the PTBW variable are compared among the sets at the same angular velocity. Table 3 compares the fatigue indices and the PTBW variable between the angular velocities (60º/s and 180º/s), in the same isokinetic set.
Discussion
For this study, the strategy of analyzing only the ixed
range of the myoelectric signal corresponding to the ILR stage of the isokinetic exercise was adopted. This approach was taken in order to minimize non-stationary effects, common in dynamic contractions, caused by changes in muscle length, by variation in the force applied during the different cycles, and by the movement of the electrode on the skin relative to the muscle (Bonato et al., 2001). The ILR range was chosen due to the satisfactory levels of stationarity presented in the previous study by Schwartz et al. (2012).
In the irst observation in Table 1 for the 60º/s velocity, the strategy adopted appears to conirm the
initial expectation that the SEMG descriptors may have, under certain conditions, the same behavior for both
Table 1. Average fatigue indices for the SEMG descriptors.
Velocity Set SEMG Descriptors (10
–3)
CV RMS ARV MDF MNF
60º/s 1 –16.4 (18.5)* 14.0 (15.0) 14.7 (15.3) –15.8 (6.8) –15.0 (6.7)
2 –18.8 (22.9)* 8.1 (11.2) 8.0 (11.6) –12.3 (7.4) –11.9 (7.3)
3 –51.6 (158.5)* 4.1 (10.2) 3.3 (11.1) –13.7 (7.9) –13.2 (6.4)
180º/s 1 103.5 (336.9)* 37.8 (44.2) 38.1 (50.9) –5.0 (42.0)* –13.5 (27.8)
2 –179.5 (688.1)* 43.8 (47.3) 46.4 (52.4) 15.6 (65.0)* –5.9 (26.8)
3 –1.9 (56.1)* 15.9 (33.4) 15.5 (39.0) –2.1 (26.7) –4.7 (21.6)
the dynamic case and the static case. The three sets revealed a decreasing trend for CV, MNF and MDF and a growing trend for RMS and ARV, which has
been widely reported on in the scientiic literature as
resulting from fatigue in static contractions (Lloyd, 1971; Moritani et al., 1982; Arendt-Nielsen and Mills, 1988; Kallenberg et al., 2007). This also indicates that in the maximum intensity exercise at 60º/s, with 10 repetitions, the fatigue state is already reached in the execution of a single set. Figure 4a reinforces this fact by the accentuated negative slopes of PT. A similar effect was observed by González-Izaletal.
(2010) when studying the leg press action in a sitting position. Regarding the behavior of amplitude and frequency parameters, Gerdle et al. (2000) reported positive correlations among them and PT, i.e., as PT decreases, MNF and RMS also decrease. This result corresponds to a similar behavior to that found in this study for MNF, but not for RMS. In fact, Gerdle et al. (2000) tested the 90º/s velocity during 100 consecutive isokinetic knee extensions. Thus, the recruitment of new motor units can occur in a different moment from that at 60º/s, which could explain the different trend.
Figure 4. Behavior of biomechanical variables.
Table 2. Statistical comparisons of the indices of fatigue (IF) and the PTWB variable among the sets with the same angular velocity.
Variable Results
60°/s 180°/s
IFCV
(C) S1 = S2, S2 = S3, S1 = S3 (C) S1 = S2, S2 = S3, S1 = S3
IFRMS
(A) S1 = S2, S2 = S3, S1 = S3 (A) S1 = S2, S2 = S3, S1 = S3
IFARV
(A) S1 = S2, S2 = S3, S1 = S3 (A) S1 = S2, S2 = S3, S1 = S3
IFMDF (A) S1 = S2, S2 = S3, S1 = S3 (C) S1 = S2, S2 = S3, S1 = S3
IFMNF (A) S1 = S2, S2 = S3, S1 = S3 (A) S1 = S2, S2 = S3, S1 = S3
IFPT (*) (A) (B) S1 > S2, S2 = S3, S1 > S3 (*) (A) (B) S1 = S2, S2 = S3, S1 > S3 PTBW (*) (A) (B) S1 > S2, S2 > S3, S1 > S3 (A) S1 = S2, S2 = S3, S1 = S3 (A) One-Way ANOVA, (B) Tukey (post hoc), (C) Friedman Test. In all comparisons H
0 was accepted (p > 0.05), except in those marked with an
asterisk(*).
Table 3. Comparison of the indices of fatigue (IF) and the PTWB variable between the 60°/s and 180°/s angular velocities in a single isokinetic set.
Variable Set 1 Set 2 Set 3
IFCV (2) IF
CV60 < IF CV180
(2) IF
CV60 = IF CV180
(2) IF
CV60 = IF CV180 IFRMS
(1) IF
RMS60 = IFRMS180
(1) IF
RMS60 < IFRMS180
(1) IF
RMS60 = IFRMS180 IFARV
(1) IF
ARV60 = IFARV180
(1) IF
ARV60 < IFARV180
(1) IF
ARV60 = IFARV180 IFMDF
(2) IF
MDF60 = IFMDF180
(2) IF
MDF60 = IFMDF180
(1) IF
MDF60 = IFMDF180
IFMNF (1) IF
MNF60 = IFMNF180
(1) IF
MNF60 = IFMNF180
(1) IF
MNF60 = IFMNF180
IFPT (1) IF
PT60 < IFPT180
(1) IF
PT60 < IFPT180
(1) IF
PT60 < IFPT180
PTBW (1) PTBW
60 > PTBW180
(1) PTBW
60 > PTBW180
(1) PTBW
When the parameters of the SEMG were compared
among the three sets (see Table 2), no signiicant difference in the slopes was found. This inding seems
to corroborate the results reported by Larsson et al. (1999) that have also evaluated three sets of ten repetitions of isokinetic knee extensions and found no difference among SEMG descriptors of the beginning and the end of the sets. One might expect an increase in the fatigue level at each subsequent set and this
would have been relected in some change in the slopes
when comparing the three sets, but in fact this did not occur. Nevertheless, the drop in the PTBW at 60º/s, which is approximately 10% at each set (Figure 4b),
shows signs of increased fatigue with a signiicant
difference among the sets (see Table 2). This suggests, for the experimental protocol used, that the degree of fatigue increases with each set and that the 1-minute rest is capable of providing considerable recovery of muscular activity among the sets (approximately 90% of the previous set’s capacity).
In other words, it may be said that, due to the rest, the increase in the fatigue level from one set to another
was not very intense and is not relected in the SEMG
variable behavior. In any case, these parameters vary within a range in which, having reached the limits, they lose sensitivity for detecting greater degrees of fatigue. Farina et al. (2002) reported, for example, that
the MDF and the MNF relect the recruitment of new
motor units – progressively larger and faster – with an upward slope until the recruitment of all of the units, whereupon the trend begins to decrease until it reaches a constant value. In the sets at 60º/s, given that they are maximum intensity exercises, the total recruitment already happens within the set. This phenomenon is also made evident in a similar result, but with an inverse relationship. This may be seen in Table 2; the slope in set 1, in which the muscle is in better condition for producing maximum torque, is greater than the slope in set 2, given the capacity for
greater muscle power output (type IIb ibers) in the
initial repetitions of set 1 (McCartney et al., 1983; Sargeant, 1994). Having lost the burst capacity, the
difference between the intensity of the irst and last
repetitions becomes lower, resulting in lower and matching slopes in sets 2 and 3.
When the focus turns to the velocity of 180º/s, there seems to be no correspondence in the results with the static case. Nevertheless, at higher velocities, new questions need to be addressed. Firstly, the levels of force produced
at high speeds are signiicantly lower than those
reached at lower velocities (Parcell et al., 2002),
which may be veriied by the PTBW variable in
Figure 4b and by the PTBW and IFPT variables in Table 3. In establishing a relationship from Figure 4a, it may be noted that the peak torque at
60º/s is approximately 50% greater than the peak torque at 180º/s. From Figure 4a it may be seen that the potential in torque production falls 20% (7%) at 60º/s (180º/s). Therefore, it is reasonable
to assume that the irst set of exercises at 180º/s
does not have enough intensity to bring the muscle to a state of fatigue. At such a velocity it may be necessary to sustain the effort for a longer period
to identify the inluence of the fatigue in SEMG parameters. Horita and Ishiko (1987) have veriied
that approximately 25 knee extensions at 180º/s are necessary to produce high levels of acidosis and,
hence, signiicant changes in the SEMG indexes. The positive slope of the CV in the irst set
(Table 1) is an indicator that there are still motor units to be recruited (Farina et al., 2002). This difference in relation to 60º/s also appears in Table 3 (IFCV60 < IFCV180). Given that at each new set the accumulation of metabolites adds a greater degree to the state of fatigue, it only becomes evident during the sets,
as seen in Table 2 in which signiicant differences
for PT fatigue indicator are only detected between sets 1 and 3 (S1 > S3) and not observed between consecutive sets. Taking into account that at 180º/s the state of fatigue is only clearly detected in set 3, a comparison with the static case should only be considered in this set, where the similarity in
behaviors is actually conirmed. This is consistent with
the results from Andrade (2006) and Andrade et al. (2006), which suggest that these patterns observed in the isometric contractions are only observed in dynamic contraction protocols which quickly bring the subject to fatigue.
Under conditions of quasi-stationarity provided by the proposed experimental protocol and those in which the production of force has enough intensity
to produce signiicant levels of fatigue, the behavior
of the SEMG descriptors in the dynamic case is quite similar to the isometric case and very likely governed by the same physiological factors. These results open a new perspective to the study of fatigue and suggest the ILR segment as an appropriate way of controlling fast non-stationarities. However, this mechanism was effective only at maximum
contraction intensity when all the muscle ibers are
References
Andrade MM, Carmo JC, Nascimento FAO, Camapum JF, Santos I, Mochizuki L, Rocha AF. Evaluation of techniques for the study of electromyographic signals. In: Engineering in Medicine and Biology Society, 2006: Proceedings of the EMBS ‘06. 28th Annual International Conference of the IEEE; 2006 Aug 30-Set 3; New York, USA. New York: IEEE; 2006. p. 1335-8. http://dx.doi.org/10.1109/
IEMBS.2006.260799.
Andrade MM. Análise tempo-frequência de sinais
eletromiográicos para a avaliação de fadiga muscular
em cicloergômetro [thesis]. Brasília: Universidade de Brasília; 2006.
Arendt-Nielsen L, Mills KR. Muscle ibre conduction
velocity, mean power frequency, mean EMG voltage and force during submaximal fatiguing contractions of human quadriceps. European Journal of Applied Physiology and Occupational Physiology. 1988; 58(1-2):20-5. PMid:3203668. http://dx.doi.org/10.1007/BF00636598.
Basmajian JV, De Luca CJ. Muscle alive: their function revealed by electromyography. 5th ed. Baltimore: Williams & Wilkins; 1985.
Bilcheck HM, Kraemer WJ, Maresh CM, Zito MA. The effects of isokinetic fatigue on recovery of maximal isokinetic concentric and eccentric strength in women. Journal of Strength and Conditioning Research. 1993; 7(10):43-50. http://dx.doi.org/10.1519/00124278-199302000-00009.
Bolgla L, Uhl T. Reliability of electromyographic normalization methods for evaluating the hip musculature. Journal of Electromyography and Kinesiology. 2007; 17(1):102-11. PMid:16423539. http://dx.doi.org/10.1016/j. jelekin.2005.11.007.
Bonato P, Roy SH, Knalitz M, De Luca CJ. Time-frequency
parameters of the surface myoelectric signal for assessing muscle fatigue during cyclic dynamic contractions. IEEE Transactions on Biomedical Engineering. 2001; 48(7):745-53. http://dx.doi.org/10.1109/10.930899.
Brown LE, editor. Isokinetics in human performance. Champaign: Human Kinetics; 2000.
Brown LE, Whitehurst M, Findley BF, Gilbert R, Buchalter DN. Isokinetic load range during shoulder rotation exercise in elite male junior tennis Players. Journal of Strength and Conditioning Research. 1995a; 9(3):160-4. http://dx.doi. org/10.1519/00124278-199508000-00007.
Brown LE, Whitehurst M, Gilbert R, Buchalter DN. The effect of velocity and gender on load range during knee
extension and lexion exercise on an isokinetic device.
Journal of Orthopaedic and Sports Physical Therapy. 1995b; 21(2):107-12. PMid:7711759. http://dx.doi.org/10.2519/ jospt.1995.21.2.107.
Clarys JP. Electromyography in sports and occupational settings: an update of its limits and possibilities. Ergonomics. 2000; 43(10):1750-62. PMid:11083153. http://dx.doi.
org/10.1080/001401300750004159.
De Luca CJ. The use of surface electromyography in biomechanics. Journal of Applied Biomechanics. 1997; 13(2):135-63.
De Sá JPM. Applied statistics using SPSS, STATISTICA, MATLAB and R. 2nd ed. Germany: Springer-Verlag; 2007. PMCid:PMC1838895. http://dx.doi.org/10.1007/978-3-540-71972-4.
Enoka RM, Duchateau J. Muscle fatigue: what, why and
how it inluences muscle function. Journal of Physiology.
2008; 586(1):11-23. PMid:17702815. PMCid:PMC2375565. http://dx.doi.org/10.1113/jphysiol.2007.139477.
Farina D, Fosci M, Merletti R. Motor unit recruitment strategies investigated by surface EMG variables. Journal of Applied Physiology. 2002; 92(1):235-47. PMid:11744666.
Farina D, Merletti R. Comparison of algorithms for estimation of EMG variables during voluntary isometric contractions. Journal of Electromyography and Kinesiology. 2000; 10(5):337-49. http://dx.doi.org/10.1016/S1050-6411(00)00025-0.
Farina D, Merletti R. Methods for estimating muscle
ibre conduction velocity from surface electromyographic
signals. Medical & Biological Engineering & Computing. 2004; 42(4):432-45. http://dx.doi.org/10.1007/BF02350984
Farina D, Pozzo M, Merlo E, Bottin A, Merletti R. Assessment
of average muscle iber conduction velocity from surface
EMG signals during fatiguing dynamic contractions. IEEE Transactions on Biomedical Engineering. 2004; 51(8):1383-93. PMid:15311823. http://dx.doi.org/10.1109/
TBME.2004.827556.
Farina D. Interpretation of the surface electromyogram in dynamic contractions. Exercise and Sport Sciences Reviews. 2006; 34(3): 121-7. PMid:16829739. http://dx.doi. org/10.1249/00003677-200607000-00006.
Gandevia SC, Allen GM, Butler JE, Taylor JL. Supraspinal factors in human muscle fatigue: evidence for suboptimal output from the motor cortex. Journal of Physiology. 1996; 490(2):529-36. PMid:8821149. PMCid:PMC1158689.
Gerdle B, Larsson B, Karlsson S. Criterion validation of surface EMG variables as fatigue indicators using peak torque: a study of repetitive maximum isokinetic knee extensions. Journal Electromyography and Kinesiology. 2000; 10(4):225-32. http://dx.doi.org/10.1016/S1050-6411(00)00011-0.
González-Izal M, Rodríguez-Carreño I, Malanda A, Mallor-Giménez F, Navarro-Amézqueta I, Gorostiaga EM, Izquierdo M. sEMG wavelet-based indices predicts muscle power loss during dynamic contractions. Journal of Electromyography and Kinesiology. 2010; 20(6):1097-106. PMid:20579906. http://dx.doi.org/10.1016/j.jelekin.2010.05.010.
Horita T, Ishiko T. Relationships between muscle lactate accumulation and surface EMG activities during isokinetic contractions in man. European Journal of Applied Physiology and Occupational Physiology. 1987; 56(1):18-23. http:// dx.doi.org/10.1007/BF00696370.
pain. Journal of Electromyography and Kinesiology. 2007; 17(3):264-74. PMid:16790358. http://dx.doi.org/10.1016/j. jelekin.2006.04.004.
Kellis E. The effects of fatigue on the resultant joint moment, agonist and antagonist electromyographic activity at different angles during dynamic knee extension efforts. Journal of Electromyography and Kinesiology. 1999; 9(3):191-9. http:// dx.doi.org/10.1016/S1050-6411(98)00032-7.
Larsson B, Mansson B, Karlberg C, Syvertsson P, Elert J, Gerdle B. Reproducibility of surface EMG variables and peak torque during three sets of ten dynamic contractions. Journal of Electromyography and Kinesiology. 1999; 9(5):351-7. http://dx.doi.org/10.1016/S1050-6411(99)00006-1.
Lenti M, De Vito G, Sbriccoli P, Palumbo AS, Sacchetti
M. Muscle iber conduction velocity and cardiorespiratory
response during incremental cycling exercise in young and older individuals with different training status. Journal of Electromyography and Kinesiology. 2010; 20(4):566-71. PMid:20202863. http://dx.doi.org/10.1016/j. jelekin.2010.02.004.
Lloyd AJ. Surface electromyography during sustained isometric contractions. Journal of Applied Physiology. 1971; 30(5):713-9. PMid:5572794.
Masuda T, Miyano H, Sadoyama T. The position of innervation zones in the biceps brachii investigated by surface electromyography. IEEE Transactions on Biomedical Engineering. 1985; 32(1):36-42. PMid:3980027. http://
dx.doi.org/10.1109/TBME.1985.325614.
McCartney N, George JFH, Norman LJ. Power output and fatigue of human muscle in maximal cycling exercise. Journal of Applied Physiology. 1983; 55(1):218-24. PMid:6885573.
McNair PJ, Depledge J, Brettkelly M, Stanley SN. Verbal encouragement: effects on maximum effort voluntary muscle action. British Journal of Sports Medicine. 1996; 30(3):243-5. http://dx.doi.org/10.1136/bjsm.30.3.243.
Merletti R, Knaflitz M, De Luca CJ. Myoelectric manifestations of fatigue in voluntary and electrically elicited contractions. Journal of Applied Physiology. 1990; 69(5):1810-20. PMid:2272975.
Merletti R, Parker PA. Electromyography: physiology, engineering, and noninvasive applications. USA: John Wiley & Sons; 2004. (IEEE Press Series in Biomedical Engineering, 11).
Molinari F, Knalitz M, Bonato P, Actis MV. Electrical
manifestations of muscle fatigue during concentric and
eccentric isokinetic knee lexion-extension movements.
IEEE Transactions on Biomedical Engineering. 2006; 53(7):1309-16. PMid:16830935. http://dx.doi.org/10.1109/
TBME.2006.873680.
Moritani T, Nagata A, Muro M. Electromyographic manifestations of muscular fatigue. Medicine and Science in Sports and Exercise. 1982; 14(2):198-202. PMid:7109886.
Parcell AC, Sawyer RD, Tricoli VA, Chinevere TD. Minimum rest period for strength recovery during a common isokinetic testing protocol. Medicine and Science in Sports and Exercise. 2002; 34(6):1018-22. PMid:12048331. http:// dx.doi.org/10.1097/00005768-200206000-00018.
Pereira MCC, Rocha VA Jr, Bottaro M, Andrade MM, Schwartz FP, Martorelli A, Celes R, Carmo JC.
Relationship between ventilatory threshold and muscle iber
conduction velocity responses in trained cyclists. Journal of Electromyography and Kinesiology. 2013; 23(2):448-54. http://dx.doi.org/10.1016/j.jelekin.2012.10.005.
Pinciveiro DM, Lephart RG, Karunakara RG. Effects of intrassession rest interval on strength recovery and reliability during high intensity exercise. Journal of Strength Conditioning Research. 1998; 12(3):152-6. http://dx.doi. org/10.1519/00124278-199808000-00005.
Sargeant AJ. Human power output and muscle fatigue. International Journal of Sports Medicine. 1994; 15(3):116-21. http://dx.doi.org/10.1055/s-2007-1021031.
Schwartz FP, Bottaro M, Celes RS, Brown LE, Nascimento
FAO. The inluence of velocity overshoot movement
artifact on isokinetic knee extension tests. Journal of Sports Science and Medicine. 2010; 9(1):140-6. PMid:24149398. PMCid:PMC3737959.
Schwartz FP, Nascimento FAO, Bottaro M, Celes RS.
Análise da estacionariedade do sinal de eletromiograia de superfície nas fases do exercício isocinético de extensão
do joelho. Revista Brasileira de Engenharia Biomédica. 2012; 28(1):44-52. http://dx.doi.org/10.4322/rbeb.2012.005.
Schwartz FP, Nascimento FAO, Bottaro M, Celes RS. Arquitetura para o processamento integrado de sinais
biomecânicos e eletromiográicos. Revista Brasileira de
Engenharia Biomédica. 2011; 27(1):24-38. http://dx.doi. org/10.4322/rbeb.2011.003.
Schwartz FP, Rocha VA Jr, Rocha AF, Nascimento FAO. Ferramenta computacional para o processamento de sinais
eletromiográicos e variáveis isocinéticas. In: Barbosa EM,
Souza MCD, Souza ER, editors. CBEB 2008: Proceedings of the XXI Congresso Brasileiro de Engenharia Biomédica;
2008 Nov 16-20; Salvador, Brasil. São Carlos: Cubo
Multimídia; 2008. p. 1699-702.
Søgaard K, Gandevia SC, Todd G, Petersen NT, Taylor JL. The effect of sustained low-intensity contractions on supraspinal
fatigue in human elbow lexor muscles. Journal of Physiology.
2006; 573(2):511-23. PMid:16556656. PMCid:PMC1779725. http://dx.doi.org/10.1113/jphysiol.2005.103598.
Authors
Fabiano Peruzzo Schwartz*, Valdinar de Araújo Rocha Júnior, Francisco Assis de Oliveira Nascimento
Departamento de Engenharia Elétrica, Faculdade de Tecnologia, Universidade de Brasília – UnB CP 4386, CEP 709-900, Brasília, DF, Brasil.
Martim Bottaro, Rodrigo Souza Celes, Maria Claudia Pereira