Review Article
DOI: http://dx.doi.org/10.1590/1517-3151.0541*e-mail: [email protected]
Received: 25 March 2014 / Accepted: 08 September 2014
Advances and perspectives of mechanomyography
Eddy Krueger*, Eduardo Mendonça Scheeren, Guilherme Nunes Nogueira-Neto, Vera Lúcia da Silveira Nantes Button, Percy Nohama
Abstract Introduction: The evaluation of muscular tissue condition can be accomplished with mechanomyography (MMG), a technique that registers intramuscular mechanical waves produced during a i ber’s contraction and stretching that are sensed or interfaced on the skin surface. Objective: Considering the scope of MMG measurements and recent advances involving the technique, the goal of this paper is to discuss mechanomyography updates and discuss its applications and potential future applications. Methods: Forty-three MMG studies were published between the years of 1987 and 2013. Results: MMG sensors are developed with different technologies such as condenser microphones, accelerometers, laser-based instruments, etc. Experimental protocols that are described in scientii c publications typically investigated the condition of the vastus lateralis muscle and used sensors built with accelerometers, third and fourth order Butterworth i lters, 5-100Hz frequency bandpass, signal analysis using Root Mean Square (RMS) (temporal), Median Frequency (MDF) and Mean Power Frequency (MPF) (spectral) features, with epochs of 1 s. Conclusion: Mechanomyographic responses obtained in isometric contractions differ from those observed during dynamic contractions in both passive and functional electrical stimulation evoked movements. In the near future, MMG features applied to biofeedback closed-loop systems will help people with disabilities, such as spinal cord injury or limb amputation because they may improve both neural and myoelectric prosthetic control. Muscular tissue assessment is a new application area enabled by MMG; it can be useful in evaluating the muscular tonus in anesthetic blockade or in pathologies such as myotonic dystrophy, chronic obstructive pulmonary disease, and disorders including dysphagia, myalgia and spastic hypertonia. New research becomes necessary to improve the efi ciency of MMG systems and increase their application in rehabilitation, clinical and other health areas.
Keywords Mechanomyography, Mechanomyographic, Biofeedback, Rehabilitation.
Introduction
At the end of the 18th century, scientists realized that the contractions of skeletal muscles (Herroun and Yeo, 1885) could be detected (audibly) on the skin surface (Beck et al., 2007; Brozovich and Pollack, 1983). In 1948, Gordon and Holbourn used a crystal microphone to register the sound of single motor units during muscular contractions. The technique, coined mechanomyography (MMG), measures the skin oscillations of contracting muscles (Orizio, 1993). This type of measurement is also called soundmyography (Orizioet al., 1991), phonomyography (Hemmerlinget al., 2004), acousticmyography (Barry et al., 1985), vibromyography (Cole et al., 2006; Vaz et al., 1997), acceleromyography (Fukano et al., 2011; Schreiber et al., 2011; Varposhti et al., 2011), and mechanomyogram (Alves and Chau, 2010).
Another technique that uses ultrasound echoes to describe structural and morphological changes of skeletal muscles (Al-Mulla et al., 2011) is known
as sonomyography (Guoet al., 2011). MMG is
suitable to monitor neuromuscular tissue in different situations, i.e., muscular displacement, contraction and stretching. These MMG responses may be applied to
several medical areas such as the clinical assessment of neuromuscular tissue, rehabilitation treatment with biofeedback systems or neural/myoelectric prosthetic control.
Considering the scope of MMG measurements and recent advances involving the technique, the goal of this paper is to discuss mechanomyography updates and indicate its applications and future perspectives.
Sensors
Mechanomyography applications
contractions in the three orthogonal directions of movement (X, Y, and Z). The accelerometer (black package) shown in Figure 1 is inserted into a board with its ampliier and power supply.
MMG signal characteristics depend on the type of sensor used (Islam et al., 2013b). For example, Watakabe et al. (2001) evaluated the difference between MMG signals registered using a condenser microphone (MIC) and ACC during bicipital isometric contractions. With a MIC transducer, the effect of the motion artifact (contamination of the signal) became smaller, enabling the MIC to measure the MMG during dynamic muscle contractions or body movements.
When the muscle is divided into three parts (proximal, middle and distal), the greater displacement peak occurs at the muscle belly in the middle (McAndrew et al., 2006) and this part is often selected as the position for the MMG sensor (Qi et al., 2011; Youn and Kim, 2011).
Signal acquisition, processing and analysis
MMG recording analysis uses features similar to those employed in the investigation of electromyography (EMG), such as time and frequency domains (Durling, 1969; Merletti and Lo Conte, 1995; Tarata et al., 2001), and the wavelet technique (Alves and Chau, 2010; Daubechies, 1988; Krueger et al., 2013a), which mixes both domain analyses (Beck et al., 2008; Lee et al., 2011). One outlier in the literature is from Lee et al.(2011) who used 444 features to analyze MMG signals, including the most common features found in MMG papers. To analyze a signal, it is necessary to set the limits of the beginning and ending of the portions to be investigated; in this case,
analysis window length (AWL) is the epoch used in the signal analysis. Nogueira-Neto et al. (2013) evaluated different AWLs and classiied 1.0 s as the best epoch to evaluate variations in muscle condition for the time domain.
The MMG power density spectrum (frequency domain) may regard the iring rates of motor units (Orizio et al., 2003; Yoshitake and Moritani, 1999) and MMG amplitude (time domain) in a voluntary contraction relects motor unit recruitment (Ebersole and Malek, 2008). The MMG amplitude acquired with ACC is a result of the amount of myoibril acceleration. The MMG amplitude response is expressed with units of m/s² when using ACC (Stock et al., 2010a). The root mean square (RMS) analysis is widely used in MMG studies and uses the intensity quadratic mean value to indicate the range of muscle displacement represented by its acceleration (RMSa) (Durling, 1969). The zero-crossing (Youn and Kim, 2011) is the number of times that the signal crosses the baseline (time domain). Peak counting corresponds to the number of peaks (within a given sub-window, e.g., 30 ms) in the AWL (time domain). Although zero-crossing and peak counting are temporal features, both can be used to infer the frequency domain because the zero-crossing is related to the frequency content and peak counting is related with spectral higher frequencies (Krueger et al., 2010). Rényi entropy (H) is an amplitude parameter for quantifying the diversity, uncertainty or randomness of a system. Multistate Lempel-Zivcomplexity (LZ) has been used to determine the complexity grade present in biomedical signals (Cebriánet al., 2010).
The peak frequency (frequency domain) is the frequency at which the greatest amplitude of the spectrum occurs and the median frequency (MDF) is the median of the spectrum (Becket al., 2005) that divides the power spectrum in two parts with equal energy (Merletti and Lo Conte, 1995). The spectral content may be represented by four major indicators: (i) the mean power frequency (MPF) (Merletti and Parker, 2004) that is the average value of the power spectral density (Søgaard et al., 2012; Tarata et al., 2001; Uchiyama and Hashimoto, 2011; Zuniga et al., 2010, 2011); (ii) Mc2, a dispersion index, which represents the variance of the power spectral density; (iii) µ3 (Madeleine et al., 2006), which uses MPF to determine the skewness (Lee et al., 2011) of the spectrum; and (iv) the kurtosis index (Lee et al., 2011) that relects the kurtosis of the power spectral density. In addition to the raw feature values, feature products have also been performed for devising hybrid values. MMG captures muscle oscillations during both contraction and stretching (unlike EMG Figure 1. Triaxial accelerometer mechanomyography sensor
(Rehabilitation Engineering Laboratory at Pontifícia Universidade Católica do Paraná).
Rev. Bras. Eng. Bioméd., v. 30, n. 4, p. 384-401, dez. 2014
Krueger E, Scheeren EM, Nogueira-Neto GN, Button VLSN, Nohama P
for electrical activity). Eventually, RMSa is greater during stretching than contraction. The multiplication of RMSa (energy related) and the zero-crossing (ZC) (frequency related in temporal analyses) can enhance the discriminatory procedure; thus, the RZ (RMSa multiplied by ZC) feature was created (Krueger et al., 2010). Youn and Kim (2011) studied the sum of RMSa and ZC to investigate the accuracy of the force estimation with MMG. To reach this goal, they have used an artiicial neural network (ANN) model. However, the results were better when the model was adjusted individually than when used a standard was used for all participants. The adjustable models have shown the best performance by considering the physiological individual variability. Each MMG sensor technology shows differences in signal response, e.g., Madeleine et al. (2006) evaluated the MMG response during 3 min of isometric elbow lexion at 30% of maximum voluntary contraction (MVC) using ACC and MIC. The results of MMG feature investigations showed that RMSa was higher with the microphone than with the ACC. Contrarily, µ3 (spectral content) showed the inverse relationship.
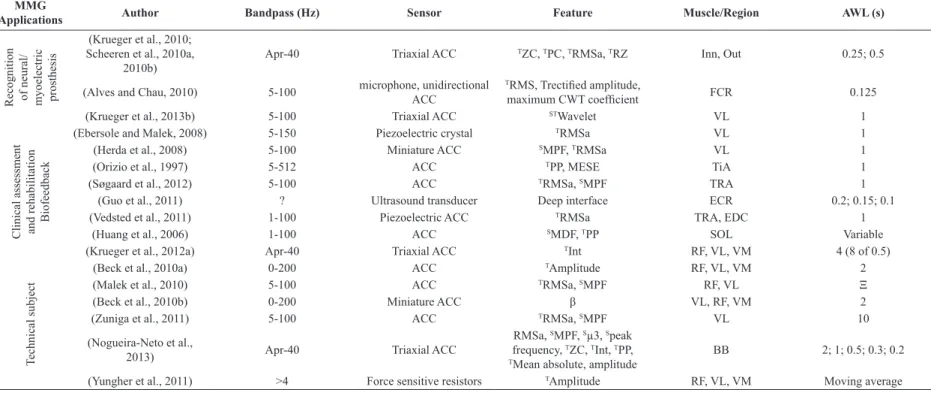
Research groups that work with MMG systems use different conigurations to evaluate their studies. Shows parameters used in 43 MMG studies published between the years of 1987 and 2013. The amount of papers per year was: 1987 (1), 1997 (2), 2003 (1), 2004 (1), 2006 (2), 2008 (2), 2009 (3), 2010 (13), 2011 (12), 2012 (2) and 2013 (4). Table 1 shows the most used conigurations: (i) third and fourth order Butterworth ilter; (ii) 5-100Hz bandpass; (iii) ACC sensor; (iv) RMSa, MDF and MPF features; (v) lower limb muscle vastus lateralis (VL); and (vi) 1 s AWL. Regarding the data in Table 1, there seems to be a consensus in the literature on the use of Butterworth ilters and the accelerometer as the main sensor to obtain the mechanomyographic signal.
Correlation to force response
Yoshitake et al.(2002) elicited single twitches from human medial gastrocnemius muscle and monitored peak to peak (temporal domain) and median frequency (spectral domain) MMG features. They concluded that the characteristic of the MMG signal is dependent on the contractile properties of the active motor units. Considering the dependence of the MMG signal on motor unit characteristics, differences in muscle iber composition inluences the MMG signal.
Orizio et al. (1999) recorded MMG from gastrocnemius muscle of cat and showed that the muscular oscillation amplitudes, expressed by the
RMSa of the MMG (MMGRMSa)parameter, were
positively correlated to increasing muscle strength.
Although investigating medial gastrocnemius muscle performance at different levels of MVC, Ohta et al. (2009) showed that MMG amplitude presents a linear decrease at levels up to 80% of the MVC.
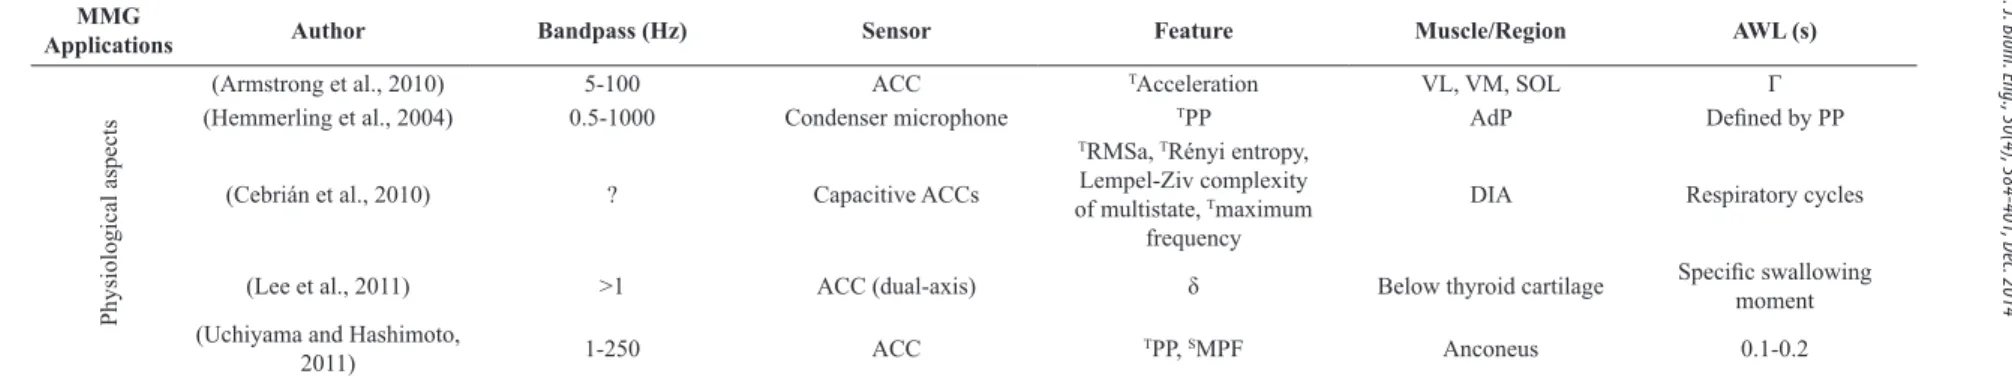
Youn and Kim (2011) evaluated the feasibility of an ANN model to estimate the elbow lexion force using MMG. Elbow lexion forces were performed under isometric muscle contraction and different ANNs and multiple linear regression models were tested and compared. The results showed that same-subject validation tests were signiicantly greater than those of the cross-subject validation tests. Lei et al.(2013) estimated the muscular contraction strength using an MMG-based ANN (Figure 2). Their experimental set up consisted of: (i) dynamometer to monitor the torque, (ii) MMG system, (iii) display for biofeedback, and (iv) computer with a display output to acquire the torque and MMG signals. In signal processing, in addition to the RMSa descriptor, the authors implemented the variation of spectral content to reduce interference from the environment and corporal oscillations on the MMG signal. The results were positive and promising for incorporation into future closed-loop control systems.
Voluntary dynamic contraction
Yungher et al. (2011) showed that the technique of MMG over the quadriceps muscle may estimate the period of knee extension. Stock et al. (2010a) measured the MMG amplitude of able-bodied volunteers and correlated it with torque during concentric movements and compared the results to EMG measurements for this task. They determined that the correlation coeficient ranges were between 0.1 and 0.94 for the VL, between 0.01 and 0.84 for the RF, and between 0.19 and 0.96 for the vastus medialis (VM) muscle; they concluded that MMG should not be used as a mechanical analogue for the eficiency of electrical activity because the MMG amplitude versus the dynamic torque relationship demonstrated poor linearity for individual responses. According to Johnson et al. (1973), the sequence (in ascending order) of muscles with a greater number of fast ibers (most suitable to fatigue) is VM, VL and rectus femoralis (RF), respectively. Comparing these data with those of Stock et al. (2010a), the greater the number of fast ibers, the lower the maximum correlation value between the torque and MMG amplitude during concentric isokinetic movements. In this sense, Ebersole and Malek (2008) investigated the maximal concentric isokinetic leg extensions (180º/s) of able-bodied volunteers (N=11) and observed that during seventy-ive consecutive contractions, the MMG amplitude of VL had a larger decrease than that of Rev. Bras. Eng. Bioméd., v. 30, n. 4, p. 384-401, dez. 2014
Mechanom
yogr
aph
y applic
ations
Table 1. Parameters found in studies with mechanomyography between 1987 and 2013.
MMG
Applications Author Bandpass (Hz) Sensor Feature Muscle/Region AWL (s)
Corre
la
ti
on
to forc
e
re
spons
e (Stock et al., 2010b) 5-100 Miniature ACC TAmplitude BB 1
(Youn and Kim, 2011) 5-9, 11-100 ACC (dual-axis)
TMean absolute value,
TRMSa, TZC, TRMSa+ZC, BB, BRD 0.1
V
ol
unt
ary
dyna
m
ic
cont
ra
ct
ion (Stock et al., 2010a) 5-100 ACC
TAmplitude RF, VL, VM 1
(Ebersole and Malek, 2008) 5-150 Piezoelectric crystal TRMSa VL, VM α
(Zuniga et al., 2010) 5-100 ACC SMPF VL 10
(Qi et al., 2011) ? Piezoelectric transducer TRMS, SMPF by wavelet BB 4
S
ki
nfol
d t
hi
ckne
ss
inl
ue
nc
e
(Krueger et al., 2012b) Apr-40 Triaxial ACC TZC, SMPF, RMSa, TInt, Sµ3 RF 1
N
eurom
us
cul
ar fa
ti
gue
(Beck et al., 2009) 5-100 ACC SCenter frequency RF, VL, VM 2
(Krueger-Beck et al., 2010a, 2010b; Scheeren et al., 2010c)
Apr-40 ACC (triaxial) TRMSa, SMDF RF, VL 1
(Orizio et al., 2003) 5-250 ACC SMPF, TRMSa BB
(Armstrong, 2011) 5-100 ACC (uniaxial) T “Magnitude analysis” VM, VL, SOL 10
(Madeleine et al., 2006) 2-100 Piezoelectric ACC and
condenser microphone
TRMS, SMPF, SMc 2,
Sµ3 BB 1
(Al-Zahrani et al., 2009) 5-100 Triaxial ACC SMDF, SMPF, RMSa, RF 1
(Cè et al., 2013) 4-120 ACC (uniaxial) TEMD BB 2
D
if
fe
re
nt
m
us
cul
ar
le
ngt
hs
(Vaz et al., 1997) 0–20000 Unidirectional ACC TRMSa, SMDF SOL 0.714
(Frangioni et al., 1987) 50-500 Hydrophone (Celesco quartz crystal) TPP, τ GAS ?
(Esposito et al., 2011) 4-120 ACC (mono-directional) TEMD GAS 2
AWL: analysis window length; T: temporal domain; S: spectral domain; RF: rectus femoris; VL: vastus lateralis; VM: vastus medialis; SOL: soleus; BB: biceps brachii; BRD: braquioradialis; TRA: trapezius; GAS:
gastrocnemius; FCR: lexor carpi radialis; AdP: adductor pollicis; TiA: tibialis anterior; DIA: diaphragm; ECR: extensor carpi radialis; EDC: extensor digitorum communis; RMSa: root mean square muscle displacement acceleration; MPF: mean power frequency; MDF: median frequency; PP: peak-to-peak; EMD: electromechanical delay; CWT: continuous wavelet transform; ZC: zero-crossing; MESE: maximum entropy spectral estimation; δ: mean, variance, skewness, kurtosis, interquartile range, ZC, maximum hyolaryngeal excursion (estimated via double integration of accelerometry), dispersion ratio, peak FFT magnitude, frequency at spectral peak and 10th order linear prediction coeficients; Mc2: second-order central instant of spectrum; τ: irst spectral instant divided by area under the power spectral density curve to each sound event; β: mean value, variance, mean frequency and standard deviation of the power spectrum; ξ: calculated as the average of the last three complete pedal thrusts during the inal 10 seconds of each power output; α: calculated over the middle third of each repetition (approximately a 30° range of motion; 0.25 s for 180°/s); γ: the maximum peak-to-peak values for a 10 s; Inn: inner side of forearm; Out: outer side of forearm; ZC: zero-crossing; PC: peak counting; µ3: uses the MPF to determine the skewness of the spectrum; RZ: product of RMSa and zero-crossing; Int: integral; ?: not informed. VAR: variation of frequency response.
Rev
. B
ras
. E
ng
. B
ioméd
., v
. 30, n. 4, p
. 384-401,
dez
. 2014
Br
az. J. Biom. E
ng
., 30(4), 384-401,
D
ec
. 2014
Kr
ueger E
, S
cheer
en EM, N
ogueir
a-N
et
o GN, B
utt
on
VLSN, N
ohama P
MMG
Applications Author Bandpass (Hz) Sensor Feature Muscle/Region AWL (s)
Re
cogni
ti
on
of ne
ura
l/
m
yoe
le
ct
ri
c
pros
the
si
s
(Krueger et al., 2010; Scheeren et al., 2010a,
2010b)
Apr-40 Triaxial ACC TZC, TPC, TRMSa, TRZ Inn, Out 0.25; 0.5
(Alves and Chau, 2010) 5-100 microphone, unidirectional ACC
TRMS, Trectiied amplitude,
maximum CWT coeficient FCR 0.125
(Krueger et al., 2013b) 5-100 Triaxial ACC STWavelet VL 1
Cl
ini
ca
l a
ss
es
sm
ent
and re
ha
bi
li
ta
ti
on
Bi
ofe
edba
ck
(Ebersole and Malek, 2008) 5-150 Piezoelectric crystal TRMSa VL 1
(Herda et al., 2008) 5-100 Miniature ACC SMPF, TRMSa VL 1
(Orizio et al., 1997) 5-512 ACC TPP, MESE TiA 1
(Søgaard et al., 2012) 5-100 ACC TRMSa, SMPF TRA 1
(Guo et al., 2011) ? Ultrasound transducer Deep interface ECR 0.2; 0.15; 0.1
(Vedsted et al., 2011) 1-100 Piezoelectric ACC TRMSa TRA, EDC 1
(Huang et al., 2006) 1-100 ACC SMDF, TPP SOL Variable
(Krueger et al., 2012a) Apr-40 Triaxial ACC TInt RF, VL, VM 4 (8 of 0.5)
T
ec
hni
ca
l s
ubj
ec
t
(Beck et al., 2010a) 0-200 ACC TAmplitude RF, VL, VM 2
(Malek et al., 2010) 5-100 ACC TRMSa, SMPF RF, VL Ξ
(Beck et al., 2010b) 0-200 Miniature ACC β VL, RF, VM 2
(Zuniga et al., 2011) 5-100 ACC TRMSa, SMPF VL 10
(Nogueira-Neto et al.,
2013) Apr-40 Triaxial ACC
RMSa, SMPF, Sµ3, Speak frequency, TZC, TInt, TPP, TMean absolute, amplitude
BB 2; 1; 0.5; 0.3; 0.2
(Yungher et al., 2011) >4 Force sensitive resistors TAmplitude RF, VL, VM Moving average
AWL: analysis window length; T: temporal domain; S: spectral domain; RF: rectus femoris; VL: vastus lateralis; VM: vastus medialis; SOL: soleus; BB: biceps brachii; BRD: braquioradialis; TRA: trapezius; GAS:
gastrocnemius; FCR: lexor carpi radialis; AdP: adductor pollicis; TiA: tibialis anterior; DIA: diaphragm; ECR: extensor carpi radialis; EDC: extensor digitorum communis; RMSa: root mean square muscle displacement acceleration; MPF: mean power frequency; MDF: median frequency; PP: peak-to-peak; EMD: electromechanical delay; CWT: continuous wavelet transform; ZC: zero-crossing; MESE: maximum entropy spectral estimation; δ: mean, variance, skewness, kurtosis, interquartile range, ZC, maximum hyolaryngeal excursion (estimated via double integration of accelerometry), dispersion ratio, peak FFT magnitude, frequency at spectral peak and 10th order linear prediction coeficients; Mc2: second-order central instant of spectrum; τ: irst spectral instant divided by area under the power spectral density curve to each sound event; β: mean value, variance, mean frequency and standard deviation of the power spectrum; ξ: calculated as the average of the last three complete pedal thrusts during the inal 10 seconds of each power output; α: calculated over the middle third of each repetition (approximately a 30° range of motion; 0.25 s for 180°/s); γ: the maximum peak-to-peak values for a 10 s; Inn: inner side of forearm; Out: outer side of forearm; ZC: zero-crossing; PC: peak counting; µ3: uses the MPF to determine the skewness of the spectrum; RZ: product of RMSa and zero-crossing; Int: integral; ?: not informed. VAR: variation of frequency response.
Table 1. Continued...
Rev
. B
ras
. E
ng
. B
ioméd
., v
. 30, n. 4, p
. 384-401,
dez
. 2014
Br
az. J. Biom. E
ng
., 30(4), 384-401,
D
ec
. 2014
Mechanom
yogr
aph
y applic
ations
MMG
Applications Author Bandpass (Hz) Sensor Feature Muscle/Region AWL (s)
P
hys
iol
ogi
ca
l a
spe
ct
s
(Armstrong et al., 2010) 5-100 ACC TAcceleration VL, VM, SOL Γ
(Hemmerling et al., 2004) 0.5-1000 Condenser microphone TPP AdP Deined by PP
(Cebrián et al., 2010) ? Capacitive ACCs
TRMSa, TRényi entropy,
Lempel-Ziv complexity of multistate, Tmaximum
frequency
DIA Respiratory cycles
(Lee et al., 2011) >1 ACC (dual-axis) δ Below thyroid cartilage Speciic swallowing
moment
(Uchiyama and Hashimoto,
2011) 1-250 ACC
TPP, SMPF Anconeus 0.1-0.2
AWL: analysis window length; T: temporal domain; S: spectral domain; RF: rectus femoris; VL: vastus lateralis; VM: vastus medialis; SOL: soleus; BB: biceps brachii; BRD: braquioradialis; TRA: trapezius; GAS:
gastrocnemius; FCR: lexor carpi radialis; AdP: adductor pollicis; TiA: tibialis anterior; DIA: diaphragm; ECR: extensor carpi radialis; EDC: extensor digitorum communis; RMSa: root mean square muscle displacement acceleration; MPF: mean power frequency; MDF: median frequency; PP: peak-to-peak; EMD: electromechanical delay; CWT: continuous wavelet transform; ZC: zero-crossing; MESE: maximum entropy spectral estimation; δ: mean, variance, skewness, kurtosis, interquartile range, ZC, maximum hyolaryngeal excursion (estimated via double integration of accelerometry), dispersion ratio, peak FFT magnitude, frequency at spectral peak and 10th order linear prediction coeficients; Mc2: second-order central instant of spectrum; τ: irst spectral instant divided by area under the power spectral density curve to each sound event; β: mean value, variance, mean frequency and standard deviation of the power spectrum; ξ: calculated as the average of the last three complete pedal thrusts during the inal 10 seconds of each power output; α: calculated over the middle third of each repetition (approximately a 30° range of motion; 0.25 s for 180°/s); γ: the maximum peak-to-peak values for a 10 s; Inn: inner side of forearm; Out: outer side of forearm; ZC: zero-crossing; PC: peak counting; µ3: uses the MPF to determine the skewness of the spectrum; RZ: product of RMSa and zero-crossing; Int: integral; ?: not informed. VAR: variation of frequency response.
Table 1. Continued... Rev. B
ras
. E
ng
. B
ioméd
., v
. 30, n. 4, p
. 384-401,
dez
. 2014
Br
az. J. Biom. E
ng
., 30(4), 384-401,
D
ec
. 2014
Krueger E, Scheeren EM, Nogueira-Neto GN, Button VLSN, Nohama P
VM, most likely because of the greater number of fast ibers in VL than in VM.
Qi et al. (2011) used wavelet analysis during several force level contractions of biceps brachii muscle and they found that different motor unit recruitment strategies were used by the muscle when contracting in different conditions. In a cycle ergometry movement, the MPF of the MMG (MMGMPF) decreased over time (Zuniga et al., 2010). At 80% of MVC during concentric movement, Stock et al. (2010a) demonstrated that RF, VL and VM muscles show a decay in MMG amplitude.
Skinfold thickness inluence
MMG registers mechanical characteristics of the muscle as well as subcutaneous (fat) and skin tissue vibration (Uchiyama and Shinohara, 2013). Zuniga et al. (2011) examined the effect of skinfold thickness at four locations on the VL muscle during incremental cycle ergometry. The placement of ACCs was chosen according to the innervation zone (IZ). The four selected regions were oblique in relation to the limb segment and delimited using the distance between the superior lateral border of the patella and the anterior superior iliac crest: two regions proximal, one on the IZ, and one distal to the IZ. The subjects began pedaling (ergometer) at 50 W and the power output was then increased by 25 W every 2 min until voluntary exhaustion. MMG signals were analyzed in the time (RMSa) and frequency (MPF) domains. The results indicated that skinfold thickness values and MMG sensor placement over the VL did not affect the MMG signal. However, Krueger et al. (2012b) found that the skinfold from fat tissue behaves like a low-pass ilter to MMG signals of RF muscles in able-bodied volunteers.
Neuromuscular fatigue
Muscular fatigue during contractions may be monitored using non-invasive techniques, such as electromyography, near-infrared spectroscopy, ultrasound and mechanomyography (Al-Mulla et al., 2011). The MMG spectral content provide information regarding motor unit iring rate (Orizio et al., 2003). Beck et al. (2007) suggested that the MMG spectral analysis information is qualitative and relects the global motor unit iring rate rather than the iring rates of a particular group of motor units as stated by Orizio et al.(2003).
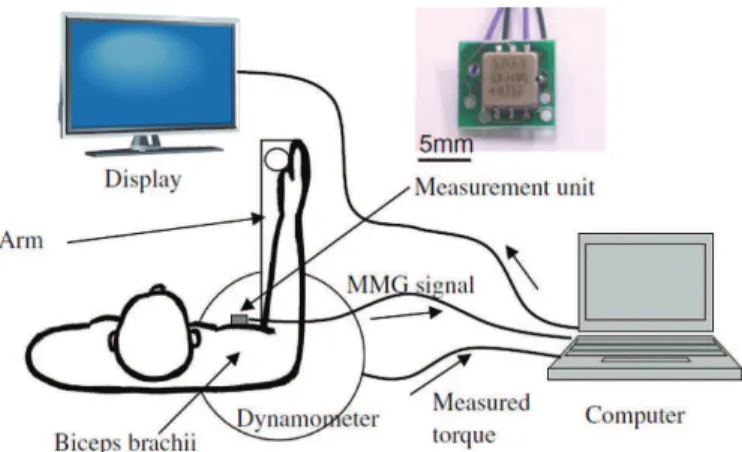
Krueger-Beck et al. (2010a) found that during functional electrical stimulation (FES) application in healthy and spinal cord injured volunteers, as illustrated in Figure 3, MMGRMSa and MMGMDF values tend to diverge as a result of muscle fatigue and/or motoneuron (spike frequency) adaptation. According to Figure 3, the knee movement was in open chain and the knee extension torque was not measured. Similar results were also found by Tarata (2003), who recorded MMG and EMG during voluntary contraction. Madeleine et al. (2006) found similar results observing the RMSa and the MPF during isometric contractions. According to Orizio et al. (2003), who tested pre-fatigued muscles, the MMGRMSa and MMGMF tend to diverge with increasing muscular strength. The decrease in MMGMF values could be explained by the increase in the depolarization threshold of motoneurons (Spielmann et al., 1993) due to the inactivation of Na+ ion channels in the cell
membrane, which according to Hodgkin and Huxley (1952), characterizes the adaptation (habituation) following a prolonged stimulus such as FES.
Once the fresh muscle starts to fatigue, new muscle iber recruitment occurs (Al-Mulla et al., 2011). Orizio et al. (2003) concluded that MMGRMSa
Figure 2. Research layout of Lei et al. (2013) with the experimental set up. Through an artiicial neural network, the author correlated the
force response with the MMG system output.
Mechanomyography applications
increases at low levels of effort due to the probable recruitment of new motor units. At high levels of effort, MMGRMSa decreases, hypothetically as a result of decreased recruitment of fast (glycolytic) ibers, possibly due to muscular fatigue. Stock et al. (2010a) found that above 80% of MVC, there is a decay in the amplitude of MMG responses of RF, VL and VM muscles during concentric movements. The biceps brachii muscle presents an increase in MMG amplitude until near 60% of the MVC. After 60% MVC, MMG amplitude decreases progressively. Therefore, the MMGMF tendency is to increase with the percentage intensiication of MVC (Orizio et al., 2003), mainly above 80% MVC, at force levels when the trend shows a small negative inlexion.
Al-Zahrani et al. (2009) evaluated the reliability between days of the MMG response to assess muscular fatigue. The volunteers were 15 able-bodied males. The participants were submitted to a fatiguing protocol in which they performed three isometric knee extensions at 75% MVC in 40 s. The protocol was repeated on two other days, two to four days apart for between day reliability. They concluded that due to the poor results obtained for between day reliability found in study,
MMGRMSa, MMGMPF and MDF of MMG (MMGMDF)
linear regression slopes from the RF muscle are not suitable for muscle fatigue monitoring. When fatigue reaches the fresh muscle, new muscle iber recruitment starts (Al-Mulla et al., 2011).
Blangsted et al.(2005) suggested that the increase in MMGRMSa during voluntary or FES-elicited muscle
contraction was due to the intramuscular pressure increase. However, Søgaard et al. (2006) showed that the increase in intramuscular pressure does not interfere with the amount of MMGRMSa. Regarding these variations, and according to Oster and Jaffe (1980), a possible explanation is the activation and inactivation events of sarcomere cross-bridges during eccentric contractions. When there is a demand for a stronger muscular force, there is an increase in those events, thus intensifying muscle vibration (Smith et al., 1997).
Zhang et al. (1996), using FES, showed that for
RF muscle, the RMS response of EMG (EMGRMS)
and MMGRMSa had similar behavior. Nevertheless, Madeleine et al. (2002) indicated that for the biceps brachii muscle, MMGRMSa increases more than EMGRMS during the development of voluntary muscle fatigue. These results indicate that the MMG response may suffer variation according to the type of muscle activation, either voluntarily or by FES.
Evaluating the contractions of able-bodied volunteers during different percentages, Beck et al. (2009) showed a concentration of the total spectrum intensity towards the low-frequency band at strength levels above 20% MVC for VL and VM muscles. Considering the RF muscle, the peak amplitude of the MMG spectrum occurred approximately 30-40 Hz at all force levels. Up to 20% of MVC, the MMG signal frequency of the VM, VL and RF muscles was approximately 40 Hz. When the demanding force levels were up to 40% MVC, the VM muscle signal had low-frequency compression for values below 20 Hz, whereas the low-frequency compression of RF and VL muscles were higher than 30 Hz. At 60% of the MVC, the frequency content of the VL and VM MMG signals decayed to frequencies below 20 Hz. When the contraction level was up to 60% MVC, the VL and VM MMG signals always remained at low-frequencies in contrast to the response obtained with RF muscle whose main frequency content was higher than 30 Hz.
Cè et al. (2013) tested low (20±2°C), normal (31±2°C) and high (40±2°C) temperatures on muscular fatigue (N=15 HV) through electromechanical delay. The authors proved that the time delay is greater in fatigued and unfatigued muscle when it is submitted to low temperatures. However, considering the temperatures investigated, the time between the mechanical activation (MMG) and the force register were similar.
Armstrong (2011) evaluated the MMG response during the single-legged stance in males and females. Two Wingate anaerobic tests separated by a 2-min rest time were performed to introduce muscular fatigue. The results showed that the total MMG intensity peak Figure 3. Schematic diagram of functional electrical stimulation
with muscular response monitoring using mechanomyography in open chain knee movement.
Rev. Bras. Eng. Bioméd., v. 30, n. 4, p. 384-401, dez. 2014
Krueger E, Scheeren EM, Nogueira-Neto GN, Button VLSN, Nohama P
was higher in males than in females and was even higher following fatiguing exercises.
Different muscular lengths
MMG features show different responses in distinct modes (e.g., isometric, concentric and eccentric); thus, changes in MMG amplitude/frequency during dynamic movement could relect motor unit recruitment and/ or iring rate modulation (Beck et al., 2005). This can be associated with muscular length (Frangioni et al., 1987; Vaz et al., 1997) or with the thickness of the tissue between the muscle and the MMG sensor (Beck et al., 2007; Orizio, 1993) to corroborate the different results found in distinct contractions and/ or movements. Esposito et al. (2011) found that after acute muscular passive stretching, viscoelastic characteristics of the muscle-tendon unit are modiied, which decreases the peak tetanic force.
Frangioni et al. (1987), studying a frog muscle, discovered that when starting muscular stretching at shorter lengths, the MMG amplitude increases with increasing muscular length; however, at longer lengths, the MMG amplitude begins to decrease. Their setup involved a hydrophone and electrical stimulation with frequencies of 10 Hz to between 30 and 50 Hz (fused tetani). In other words, the MMG amplitude response is dependent on muscular length. Regarding frequency, the increase in muscular length implies a frequency rise in the MMG (Frangioni et al., 1987).
Concerning the velocity-related increase in MMG amplitude, for the passive knee extension movements in VL activation, Ebersole and Malek (2008) hypothesized that it may be associated with turbulence in intracellular and extracellular luid mediums and/or cross-talk from the hamstring muscles.
Vaz et al. (1997) evaluated the effect of stretching on muscle electrical stimulation and concluded that stretching inluences the MMG signal in cats. A force sensor was used to measure the stretching muscular force. The electrical stimulation lasted 6 s (at each frequency) with frequencies from 4 to 35 Hz, and 1 min elapsed between stimulations to prevent muscular fatigue. An ankle angles range test was performed within the normal physiological range (80º-140º) to ensure that transient signals (artifact of movement) at the contraction initiation and conclusion were excluded. The results showed that greater muscular forces were delivered at shorter muscular lengths to each electrical stimulation frequency tested. MMGRMSa is larger at intermediate muscle lengths, which is similar to results found by Frangioni et al. (1987). Vaz et al. (1997) found that MMGMDF tends to increase
with increasing muscular length, and once again, similar results were found by Frangioni et al. (1987).
Krueger et al. (2011b) evaluated the correlation between MMG triaxial features and passive knee angular movement of RF and VL muscles acquired from twelve (N=12) healthy volunteers (HV) and thirteen (N=13) spinal cord injured volunteers (SCIV). Temporal (RMSa and integral – INT) and frequency (MF and µ3) features were extracted. The main results showed that the Spearman correlation between MMGMF and MMG temporal analysis (RMSa and INT) to HV was classiied as positive, moderate (ρ from 0.635 to 0.681) and high (ρ from 0.859 to 0.870) and was not statistically signiicant for SCIV. Possibly the positive (moderate and high) correlation coeficient to HV is due to the dificulty of HV totally relaxing their muscles during passive movement, which does not occur with SCIV due to the impairment/loss of voluntary contraction. These indings differ from studies with voluntary contraction (Tarata, 2003) or with FES application (Krueger-Beck et al., 2010a), due to a negative coeficient correlation between MMGMF and MMGRMSa.
Recognition to neural/myoelectric prosthesis
FES evokes functional movements in subjects with neurological disorders (Kesar et al., 2010; Packman-Braun, 1988; Thrasher et al., 2006), such as spinal cord injury victims. During FES application, the electrical stimuli can interfere with EMG signals due to circuit limitations (Seki et al., 2003) in closed-loop systems (Venkatasubramanian et al., 2006). Because MMG is based on mechanical oscillations of muscles during contraction, it is not affected directly by electrical pulses yielded during FES application (Faller et al., 2009; Seki et al., 2003). MMG signals are viable as biofeedback to human-machine interface, such as a joystick (Xie and Dokos, 2013), myoelectrical prostheses (Krueger et al., 2010; Yu and Chang, 2010) or neuroprostheses control (Popovic and Thrasher, 2004) using temporal and spectral features (Beck et al., 2009; Stock et al., 2010a).
Different FES parameters can be applied using biofeedback systems, like MMG, to choose the most eficient FES proile to create artiicial movement in paraplegic subjects (Krueger-Beck et al., 2010b). Krueger et al. (2011a) evaluated FES application with different off (rest) times in a paraplegic subject during open chain movements. The results showed that the features of MMGRMSa and MMGMDF presented divergent tendencies during FES application, which can be important to neuroprostheses based on MMG systems. In the beginning of a muscular contraction, MMG registers movement transients (Silva and Chau, 2003), which were determined at the onset of the contraction (Nolan and dePaor, 2004). The contraction Rev. Bras. Eng. Bioméd., v. 30, n. 4, p. 384-401, dez. 2014
Mechanomyography applications
onset is the MMG signal inside the rectangular (dashed) window in Figure 4. These artifacts jeopardize signal processing because they contaminate the temporal and spectral signal responses (Silva and Chau, 2003). Some studies used analysis windows with a time delay beginning at the contraction onset to characterize signals, e.g., for prosthetic control (Alves and Chau, 2008; Prociow et al., 2008).
Krueger et al. (2013b) showed that the MMG time-frequency response of paraplegic subjects’ VL muscles during contractions elicited by different FES modulating frequencies proportionated different patterns. The time-frequency muscle response was rather, the same (18.27 Hz), applying a modulated frequency at 20 Hz. However, the muscle did not respond as in the last situation when the FES was set to 50 Hz. Although fast fatigable motor units are in the elicited muscle, its frequency contraction was predominately low, similar to the slow motor unit response (peak energy in 11.31 Hz). The authors hypothetized that this event was a result of changes in axonal physiology and morphology, such as the reduction in axon diameter and motor units’ iring rate and that the muscle tissue was unable to respond (to oscillate) at the same frequency that was elicited (50 Hz).
To control a myoelectrical prosthesis, Scheeren et al. (2010a) investigated mechanomyographic signal analyses with 0.2 s and 1.0 s time delays after contraction onset, during four wrist movements: lexion, extension, ulnar and radial deviations. Figure 5 shows two triaxial (X, Y and Z) MMG sensors positioned in the inner and outer sides of the forearm and lexion wrist movement. The results obtained from all analyzed features 0.2 s after contraction onset (0.2 AOC) and 1.0 AOC demonstrated that in the antagonist movement’s RZ feature, zero-crossing and RMSa are very similar and can be used, if necessary, to reduce the time delay for myoelectrical prosthesis activation. The 1.0 s time delay after the contraction onset (1.0 AOC) was considered too long for practical purposes. Features extracted from MMG signals using this time delay did not allow characterization of the four different arm movements. Because patient acceptance of rehabilitative applications is desirable, the use of AWL with a short time delay is required because human perception takes 300 ms or less to consider an event as having occurred in real time (Englehart and Hudgins, 2003).
Alves and Chau (2010) evaluated the continuous wavelet transform (CWT) algorithm for the detection of forearm muscle activity via MMG signals. The results showed viability of the CWT analysis to be
Figure 4. Time response of an MMG sensor (green color) placed over the rectus femoris muscle during quadriceps muscle concentric contraction (knee angle in red color). Onset of contraction (movement
artifact) can be recognized mainly inside the dashed rectangle. Image modiied from Krueger et al. (Krueger et al., 2011a).
Figure 5. Volunteer with MMG (triaxial ACC) sensor placement
(inner and outer side of forearm). Modiied from Scheeren et al.
(Scheeren et al., 2010a). Rev. Bras. Eng. Bioméd., v. 30, n. 4, p. 384-401, dez. 2014
Krueger E, Scheeren EM, Nogueira-Neto GN, Button VLSN, Nohama P
implemented in real time muscle-activity detection in clinical applications.
When muscles contract, the distance between the fat-muscle and muscle-bone interfaces varies. The mechanical displacement and distance variations between tissue interfaces can be registered, for instance, using sonomyography. Guo et al. (2011) evaluated the real-time change of muscle thickness using sonomyography (SMG), electrogoniometry, power (strain-gauge) and EMG for purposes of prosthetic motor control. The protocol was evaluated with isometric contraction and wrist extension and aimed to control a virtual cursor during different tasks. The results demonstrated that there was no signiicant difference between any of the control signals (EMG and SMG). However, the results also showed that SMG provided more consistent performance than EMG.
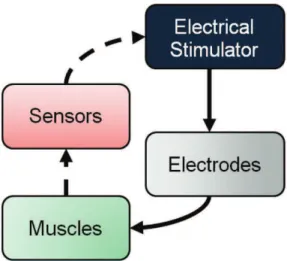
Another important contribution of MMG is the extraction of muscle condition characteristics to reine automatic control of myoelectrical prostheses as illustrated in Figure 6. In this case, the forward path involves adjustment of the stimulation set-point. The stimuli from the electrical stimulator are applied by electrodes to a neuromuscular (muscles) system that is subject to disturbances from the external world. Electrogoniometer and MMG sensors have been used to determine kinematics and condition of the muscle under stimulation. The biofeedback path might correct deviations from the desired set-point.
Clinical assessment and rehabilitation biofeedback
EMG is considered the gold-standard for assessment of neuromuscular tissue. As MMG is a recent technique to monitor muscular contraction (Islam et al., 2013a), it is necessary to prove its eficiency in muscular assessment, comparing MMG results to ground-truth results. Herda et al. (2008) demonstrated the reliability of the MMG features testing its repeatability over time. During neuromuscular tissue activation, the time lag between the onset of EMG and MMG signals (ΔtEMG-MMG) (Esposito et al., 2011) noted the existence
of excitation–contraction coupling. Regarding this, Barry (1987) monitored the electrical and mechanical responses of the gastrocnemius muscle and found that the mechanical response onset occurred after muscle depolarization but before the emergence of external force production.
Cabral et al. (2013) measured the time lag between the onset of electrical stimulation and the onset of the mechanomyographic signal (using accelerometer) in one spinal cord injured subject and one able-bodied subject. The results showed that the time lag for the participant with the spinal cord injury was 723 ms
versus 23 ms for the healthy volunteer. This difference of 700 ms in the preliminary results widens the research perspective to measure the temporal parameters of the muscular reaction in different populations i.e., from pathologies to different sport modalities.
Frangioni et al. (1987) and Ebersole and Malek (2008) created an index coined “electromechanical eficiency” using EMG and MMG values to quantify the unfatigued or fatigued muscular condition of normal and diseased muscles. The illustrative placement using MMG sensors and EMG electrodes is represented in Figure 7 where the MMG sensor is positioned between the EMG electrodes; this placement results in increasing the distance between the electrodes, therefore, they were cut proximally to make them as close as possible.
Orizio et al. (1997) deines “electromechanical delay” (EMD) as the time interval between the instants at which the EMG and the MMG surpassed the threshold of their average resting values (three standard deviations). In other words, the EMD is the existing time delay between the onset of neuromuscular electrical activation, mechanical myoiber activation and the onset of force development. Esposito et al. (2011) found that acute muscular passive stretching alters the viscoelastic characteristics of muscle-tendon units, increasing the EMD.
MMG has applications in the clinical assessment of neuromuscular tissue in animals (Staals et al., 2011), as can be found in the study of Hemmerling et al. (2004), which states that MMG and phonomyography Figure 6. Example of closed-loop system applied to FES application. Electrical stimulator (black box) is related to efferent system like brain and spinal cord. Electrodes (and cables in gray box) represent the
motor neurons’ path to artiicially activate the muscles (green box).
The sensors (red box) represent electrogoniometer, MMG, force sensors, etc. that can be used to determine kinematics and condition of the muscle under stimulation. The biofeedback path can be used to correct deviations from the desired set point (dashed line).
Mechanomyography applications
(condenser microphone) are viable for determining the neuromuscular blockade at the adductor pollicis muscle using the train-of-four method (electrical stimulation applied in nerves during anesthesia). Other studies (Fukano et al., 2011; Varposhti et al., 2011) used MMG and the train-of-four method with the same objective: to evaluate the neuromuscular blockade with anesthetics. Schreiber et al. (2011) evaluated 100 patients submitted to general anesthesia blockade with atracurium through endotracheal intubation. They found that the acoustic myogram using the train-of-four method without calibration is a reliable technique for recognition of neuromuscular blockade/recovery. The anesthesia test in the neuromuscular blockade has been limited due to the invasive requirement (needle electromyography). However, Hsieh et al. (2012) measured the cortical inhibition with MMG and paired-pulse transcranial magnetic stimulation (TMS) in unanesthetized rats. They concluded that TMS-MMG can be employed as a well-tolerated biomarker for measuring gamma-aminobutyric acid type A mediated cortical inhibition in rats.
Orizio et al. (1997) evaluated myotonic dystrophy (MyD) with MMG technique. Single twitches were tested with 5, 10, 15 and 20 Hz for 3 s. The results showed that the MMG amplitude was 67% lower, the duration was 37% longer, the electromechanical delay was 64% longer, and the spectrum mean frequency was 44% lower in the MyD patients than in the control group. During repetitive stimulation, the MMGpeak-to-peak average was even smaller in MyD patients. Those
results indicate the possibility of MyD diagnosis through MMG.
MMG can be applied in the cardiopulmonary system, for instance, to evaluate the condition of the diaphragm muscle (Sarlabous et al., 2012). Cebrián et al. (2010) evaluated the MMG signals in patients with chronic obstructive pulmonary disease (COPD) at different effort levels. The maximum inspiration pressure and MMG amplitude showed a positive correlation and the maximum inspiration pressure showed a negative correlation related to the MMG frequency. These results suggest that the information provided by MMG signals could be used to assess respiratory effort and muscle eficiency in patients with COPD.
As a gold standard, dysphagia is assessed using a videoluoroscopic swallowing study. However, this exam is time-consuming and expensive. In an attempt to solve this problem, Lee et al. (2011) investigated the combination of dual-axes accelerometry and nasal airlow for classiication of healthy and abnormal swallowing in a population with dysphagia. The results showed that MMG can be used to discriminate healthy and abnormal swallows from patients with dysphagia.
Søgaard et al. (2012) assessed changes in myalgic trapezius muscle activation using MMG as part of the analysis. Thirty-nine women were submitted to speciic and general itness training for ten weeks. The results did not show signiicant differences between MMG signals during the tests.
Spastic hypertonia involved an atypical increase in motoneuronal excitability and muscle mechanical properties (Mirbagheri et al., 2007). The modiied Ashworth scale (MAS) is a classical test administered by technicians to rank spasticity level with six values of classiication (0, 1, +1, 2, 3 and 4) (Bohannon and Smith, 1987). Unfortunately, MAS results differ greatly from technician to technician. Researchers continue to investigate relationships between EMG and MMG values using clinical assessments. Huang et al. (2006) characterized the neural and mechanical components of muscle spasticity by correlating them with MAS. Healthy, spinal cord injured and post-stroke volunteers participated in the study. The main result was that the Spearman correlation between MMG amplitude and MAS was ρ = 0.432 (p = 0.011), which indicates a moderate correlation index between the mechanical property of muscle spasticity and MMG signal. The spasticity effects in the muscle can be partially identiied using the MMG signal. However, the Spearman value is not enough to support conclusive statements about MMG usability to identify spasticity. Contrarily, Krueger et al. (2012a) found that MMG presents good reliability and feasibility for clinical Figure 7. MMG sensor and EMG electrodes over third distal biceps
brachii muscle. Modiied from Nogueira-Neto et al.
(Nogueira-Neto et al., 2013).
Rev. Bras. Eng. Bioméd., v. 30, n. 4, p. 384-401, dez. 2014
Krueger E, Scheeren EM, Nogueira-Neto GN, Button VLSN, Nohama P
assessment of patients with spasticity. Krueger et al. (2012a) submitted spinal cord injured participants with MAS=0 and MAS=1 to stretching relexes and evaluated the muscular tonus increase (hamstrings) in the antagonist muscular group (quadriceps femoris). The results showed that the MMGINT was greater for MAS=1 than for MAS=0 participants.
Parkinson’s disease affects elderly subjects with neuromuscular disorders such as tremor and gait dificulties (Cools et al., 2010). Marusiak et al. (2009) evaluated the neuromuscular response of patients (N=10) with Parkinson’s disease using MMG and EMG techniques. The sensors and electrodes were placed in agonist and antagonist muscles of the arm. The volunteers performed maximum voluntary contractions during elbow lexion and extension. They found no differences in MMG or EMG response in patients with Parkinson’s disease. These results may be because patients were tested during the use of medication Parkinson’s disease treatment.
Biofeedback is a technique that helps in rehabilitation training by providing physiological information during the therapy. People who work in offices, particularly subjects who perform monotonous, repetitive work (e.g., to spend several hours typing on a computer), can suffer from osteomuscular diseases. In an attempt to reduce the incidence of these diseases, Vedsted et al. (2011)
used MMG and EMG recordings of the extensor
digitorum communis and trapezius muscles as biofeedback information. The magnitudes were based on MVC percentages. Visual and auditory signals were used as feedback to the volunteers. The authors concluded that biofeedback can reduce muscle activation of the trapezius and the extensor digitorum communis muscles by approximately 30-50% and 10%, respectively, when working with standardized computer tasks. These results are promising for using biofeedback in occupational settings for effectively targeting relief and preventing muscle pain.
Currently
Currently, MMG applications range from myoibril vibration for muscular fatigue characterization in different movements up to pathology assessments. The bibliographical research in this study focused on the period between 1987 and 2013; the most widely used parameters in MMG experimental protocols were: third and fourth order Butterworth ilters; 5-100Hz bandpass ilters; RMSa (temporal), MDF and MPF (spectral) features; 1 s analysis epoch and ACC-based sensors. The vastus lateralis is the most studied muscle.
Future directions
The increase in the amount of research in this ield, the technological advances in the development of novel MMG sensors, and the progress of experimental protocols will improve MMG techniques for acquisition, processing and analysis.
MMG may become, in the near future, the gold standard for muscular assessment to be applied in the development of more accurate systems for closed-loop control in neural or myoelectric prosthetics.
Future applications and perspectives of MMG depend on standardization of the mechanical muscular response to different types of muscular ibers and types of movements. Additionally, future applications depend on the identiication of distinct physiological events as motoneuron adaptation (habituation) and muscular fatigue. Moreover, complementing the information obtained from the MMG with the results of other technique applications, such as EMG, when possible, enriches our knowledge of neuromuscular behavior; EMG reports on the electrical activity of the motor units while the MMG relects their mechanical activity.
Acknowledgements
We thank Conselho Nacional de Desenvolvimento Cientíico e Tecnológico (CNPq), Financiadora de Estudos e Projetos (FINEP), and Secretaria da Ciência, Tecnologia e Ensino Superior do Paraná (SETI-PR) for important funding and inancial support.
References
Al-Mulla MR, Sepulveda F, Colley M. A review of non-invasive techniques to detect and predict localised muscle fatigue. Sensors. 2011; 11(4):3545-94. PMid:22163810 PMCid:PMC3231314. http://dx.doi.org/10.3390/s110403545 Al-Zahrani E, Gunasekaran C, Callaghan M, Gaydecki P, Benitez D, Oldham J. Within-day and between-days reliability of quadriceps isometric muscle fatigue using mechanomyography on healthy subjects. Journal of Electromyography and Kinesiology. 2009; 19(4):695-703. PMid:18294866. http://dx.doi.org/10.1016/j. jelekin.2007.12.007
Alves N, Chau T. Automatic detection of muscle activity from mechanomyogram signals: a comparison of amplitude and wavelet-based methods. Physiological Measurement. 2010; 31(4):461-76. PMid:20182001. http://dx.doi. org/10.1088/0967-3334/31/4/001
Alves N, Chau T. Stationarity distributions of mechanomyogram signals from isometric contractions of extrinsic hand muscles during functional grasping. Journal of Electromyography and Kinesiology. 2008 June; 18(3):509-15. PMid:17276085. http://dx.doi.org/10.1016/j. jelekin.2006.11.010
Mechanomyography applications
Armstrong WJ. Wavelet-based intensity analysis of mechanomyographic signals during single-legged stance following fatigue. Journal of Electromyography & Kinesiology. 2011; 21(5):803-10. PMID: 21708471. http:// dx.doi.org/10.1016/j.jelekin.2011.05.011
Armstrong WJ, McGregor SJ, Yaggie JA, Bailey JJ, Johnson SM, Goin AM, Kelly SR. Reliability of mechanomyography and triaxial accelerometry in the assessment of balance. Journal of Electromyography and Kinesiology. 2010; 20(4):726-31. PMid:20227294. http://dx.doi.org/10.1016/j. jelekin.2010.02.002
Barry DT. Acoustic signals from frog skeletal muscle. Biophysical Journal. 1987; 51(5):769-73. http://dx.doi. org/10.1016/S0006-3495(87)83403-3
Barry DT, Geiringer SR, Ball RD. Acoustic myography: a noninvasive monitor of motor unit fatigue. Muscle & Nerve. 1985; 8(3):189-94. PMid:4058463. http://dx.doi. org/10.1002/mus.880080303
Beck TW, DeFreitas JM, Stock MS. An examination of cross-talk among surface mechanomyographic signals from the supericial quadriceps femoris muscles during isometric muscle actions. Human Movement Science. 2010a; 29(2):165-71. PMid:20334943. http://dx.doi.org/10.1016/j. humov.2009.11.005
Beck TW, DeFreitas JM, Stock MS, Dillon MA. An examination of mechanomyographic signal stationarity during concentric isokinetic, eccentric isokinetic and isometric muscle actions. Physiological Measurement. 2010b; 31(3):339-61. PMid:20130345. http://dx.doi. org/10.1088/0967-3334/31/3/005
Beck TW, Housh TJ, Cramer JT, Weir JP, Johnson GO, Coburn JW, Malek MH, Mielke M. Mechanomyographic amplitude and frequency responses during dynamic muscle actions: a comprehensive review. BioMedical Engineering OnLine. 2005; 4(1):67. PMid:16364182 PMCid:PMC1343566. http://dx.doi.org/10.1186/1475-925X-4-67
Beck TW, Housh TJ, Fry AC, Cramer JT, Weir JP, Schilling BK, Falvo MJ, Moore CA. A wavelet-based analysis of surface mechanomyographic signals from the quadriceps femoris. Muscle & Nerve. 2009; 39(3):355-63. PMid:19208397. http://dx.doi.org/10.1002/mus.21208
Beck TW, Housh TJ, Johnson GO, Cramer JT, Weir JP, Coburn JW, Malek MH. Does the frequency content of the surface mechanomyographic signal relect motor unit iring rates? A brief review. Journal of Electromyography and Kinesiology. 2007; 17(1):1-13. PMid:16497517. http:// dx.doi.org/10.1016/j.jelekin.2005.12.002
Beck TW, von Tscharner V, Housh TJ, Cramer JT, Weir JP, Malek MH, Mielke M. Time/frequency events of surface mechanomyographic signals resolved by nonlinearly scaled wavelets. Biomedical Signal Processing and Control. 2008; 3(3):255-66. http://dx.doi.org/10.1016/j.bspc.2008.01.005 Blangsted AK, Sjøgaard G, Madeleine P, Olsen HB, Søgaard K. Voluntary force contraction elicits prolonged low-frequency fatigue and changes in surface electromyography and mechanomyography. Journal of Electromyography and Kinesiology. 2005; 15(2):138-48. PMid:15664144. http:// dx.doi.org/10.1016/j.jelekin.2004.10.004
Bohannon RW, Smith M. Interrater reliability of a modiied ashworth scale of muscle spasticity. Physical Therapy. 1987 February; 67(2):206-7. PMid:3809245
Brozovich FV, Pollack GH. Muscle contraction generates discrete sound bursts. Biophysical Journal. 1983; 41(1):35-40. http://dx.doi.org/10.1016/S0006-3495(83)84403-8 Cabral LPA, Krueger E, Nogueira-Neto GN, Nohama P, Scheeren EM. (extended abstract) Time lag between the onset of electrical stimulation and the muscular response. In: XXIV Congress of the International Society of Biomechanics and XV Brazilian Congress of Biomechanics; 2013 Aug 4-9; Natal. Natal, Brazil; 2013. p. 1-2.
Cè E, Rampichini S, Agnello L, Limonta E, Veicsteinas A, Esposito F. Effects of temperature and fatigue on the electromechanical delay components. Muscle & Nerve. 2013; 47(4):566-76. PMid:23463680. http://dx.doi.org/10.1002/ mus.23627
Cebrián AT, Uranga LS, Fernández JAF, Guiral JG, Llorens JMM, Prat JM, Campos RJ. Evaluación de la actividad de los músculos inspiratorios mediante se-ales mecanomiográicas en pacientes con EPOC durante un protocolo de carga incremental. In: XXVIII Congreso Anual de la Sociedad Espa-ola de Ingeniería Biomédica; 2010 Nov 24-26. Madrid. Madrid; 2010.
Coburn JW, Housh TJ, Cramer JT, Weir JP, Miller JM, Beck TW, Malek MH, Johnson GO. Mechanomyographic and electromyographic responses of the vastus medialis muscle during isometric and concentric muscle actions. Journal of Strength and Conditioning Research; 2005. p. 412-20. PMid:15903384
Cole JP, Madhavan G, McLeod KJ. Vibromyographic quantiication of voluntary isometric contractile force in the brachioradialis. 28th IEEE EMBS Annual International Conference; 2006; New York. New York; 2006 ; p. 1708-10. PMid:17946062
Cools R, Miyakawa A, Sheridan M, D’Esposito M. Enhanced frontal function in Parkinson’s disease. Brain. 2010; 133(1):225-33. PMid:19995871 PMCid:PMC2801327. http://dx.doi.org/10.1093/brain/awp301
Daubechies I. Orthonormal bases of compactly supported wavelets. Communications on pure and applied mathematics. 1988; 41(7):909-96. http://dx.doi.org/10.1002/ cpa.3160410705
Durling AE. An introduction to electrical engineering. London: Macmillan; 1969.
Ebersole KT, Malek DM. Fatigue and the electromechanical eficiency of the vastus medialis and vastus lateralis muscles. Journal of Athletic Training. 2008; 43(2):152-6. PMid:18345339 PMCid:PMC2267324. http://dx.doi. org/10.4085/1062-6050-43.2.152
Englehart K, Hudgins B. A robust, real-time control scheme for multifunction myoelectric control. IEEE Transactions on Biomedical Engineering. 2003; 50(7):848-54. PMid:12848352. http://dx.doi.org/10.1109/ TBME.2003.813539
Esposito F, Limonta E, Cè E. Passive stretching effects on electromechanical delay and time course of recovery in human skeletal muscle: new insights from an electromyographic and mechanomyographic combined approach. European Journal Rev. Bras. Eng. Bioméd., v. 30, n. 4, p. 384-401, dez. 2014
Krueger E, Scheeren EM, Nogueira-Neto GN, Button VLSN, Nohama P
of Applied Physiology. 2011; 111(3):485-95. PMid:20886228. http://dx.doi.org/10.1007/s00421-010-1659-4
Faller L, Nogueira-Neto GN, Button VLdSN, Nohama P. Muscle fatigue assessment by mechanomyography during application of NMES protocol. Revista brasileira de Fisioterapia. 2009; 13(5):422-9. http://dx.doi.org/10.1590/ S1413-35552009005000057
Frangioni JV, Kwan-Gett TS, Dobrunz LE, McMahon TA. The mechanism of low-frequency sound production in muscle. Biophysical Journal. 1987; 51(5):775-83. http:// dx.doi.org/10.1016/S0006-3495(87)83404-5
Fukano N, Suzuki T, Ishikawa K, Mizutani H, Saeki S, Ogawa S. A randomized trial to identify optimal precurarizing dose of rocuronium to avoid precurarization-induced neuromuscular block. Journal of Anesthesia. 2011; 25(2):200-4. PMid:21225293. http://dx.doi.org/10.1007/s00540-010-1086-z
Gordon G, Holbourn AH. The sounds from single motor units in a contracting muscle. The Journal of Physiology. 1948; 107(4):456-64. PMid:16991826 PMCid:PMC1392395 Guo JY, Zheng YP, Kenney LPJ, Bowen A, Howard D, Canderle JJ. A Comparative evaluation of sonomyography, electromyography, force, and wrist angle in a discrete tracking task. Ultrasound in Medicine & Biology. 2011; 37(6):884-91. PMid:21546151. http://dx.doi.org/10.1016/j. ultrasmedbio.2011.03.008
Hemmerling TM, Michaud G, Trager G, Deschamps S, Babin D, Donati F. Phonomyography and mechanomyography can be used interchangeably to measure neuromuscular block at the adductor pollicis muscle. Anesthesia & Analgesia. 2004; 98(2):377. http://dx.doi.org/10.1213/01. ANE.0000096003.64059.97
Herda TJ, Ryan ED, Beck TW, Costa PB, DeFreitas JM, Stout JR, Cramer JT. Reliability of mechanomyographic amplitude and mean power frequency during isometric step and ramp muscle actions. Journal of Neuroscience Methods. 2008; 171(1):104-9. PMid:18405977. http:// dx.doi.org/10.1016/j.jneumeth.2008.02.017
Herroun EF, Yeo GF. Note on the sound accompanying the single contraction of skeletal muscle. The Journal of Physiology. 1885; 6(4-5):287-92. PMid:16991417 PMCid:PMC1485010
Hodgkin AL, Huxley AF. The dual effect of membrane potential on sodium conductance in the giant axon of Loligo. The Journal of Physiology. 1952; 116(4):497-506. PMid:14946715 PMCid:PMC1392212
Hsieh TH, Dhamne SC, Chen JJJ, Pascual-Leone A, Jensen FE, Rotenberg A. A new measure of cortical inhibition by mechanomyography and paired-pulse transcranial magnetic stimulation in unanesthetized rats. Journal of neurophysiology. 2012; 107(3):966-72. PMid:22013238 PMCid:PMC3289479. http://dx.doi.org/10.1152/jn.00690.2011
Huang CY, Wang CH, Hwang IS. Characterization of the mechanical and neural components of spastic hypertonia with modiied H relex. Journal of Electromyography & Kinesiology. 2006; 16(4):384-91. PMid:16253519. http:// dx.doi.org/10.1016/j.jelekin.2005.09.001
Islam MA, Sundaraj K, Ahmad RB, Ahamed NU. Mechanomyogram for Muscle function assessment: A
review. PLoS ONE. 2013a; 8(3):e58902. PMid:23536834 PMCid:PMC3594217. http://dx.doi.org/10.1371/journal. pone.0058902
Islam MA, Sundaraj K, Ahmad RB, Ahamed NU, Babu M. Mechanomyography Sensor Development, Related Signal Processing and Applications: A Systematic Review. IEEE Sensors Journal. 2013b; 13(7):2499-516. http://dx.doi. org/10.1109/JSEN.2013.2255982
Johnson MA, Polgar J, Weightman D, Appleton D. Data on the distribution of ibre types in thirty-six human muscles:: An autopsy study. Journal of the Neurological Sciences. 1973 Jan; 18(1):111-29. http://dx.doi.org/10.1016/0022-510X(73)90023-3
Kesar TM, Perumal R, Jancosko A, Reisman DS, Rudolph KS, Higginson JS, Binder-Macleod SA. Novel Patterns of Functional Electrical Stimulation Have an Immediate Effect on Dorsilexor Muscle Function During Gait for People Poststroke. Physical Therapy. 2010; 90(1):55-66. PMid:19926681 PMCid:PMC2802826. http://dx.doi. org/10.2522/ptj.20090140
Krueger-Beck E, Scheeren E, Nogueira-Neto GN, Button VLdSN, Nohama P. Mechanomyographic Response during FES in Healthy and Paraplegic Subjects. In: 32nd Annual International Conference of the IEEE Engineering in Medicine and Biology Society (EMBC); August 31 - September 4, 2010; Buenos Aires, Argentina; 2010a. p. 626-9. Krueger-Beck E, Scheeren E, Nogueira-Neto GN, Button VLdSN, Nohama P. Optimal FES Parameters based on mechanomyographic eficiency index. In: 32nd Annual International Conference of the IEEE Engineering in Medicine and Biology Society (EMBC); August 31 - September 4, 2010; Buenos Aires, Argentina; 2010b. p. 1378-81. Krueger E, Scheeren E, Chu GFD, Nogueira-Neto GN, Button VLdSN. Mechanomyography analysis with 0.2 s and 1.0 s time delay after onset of contraction. In: BIOSTEC 2010: 3rd International Joint Conference on Biomedical Engineering Systems and Technologies; 2010 Jan 20-23; Valence. Valence; 2010. p. 296-9.
Krueger E, Scheeren E, Lazzaretti AE, Nogueira-Neto GN, Button VLSN, Nohama P. Cauchy wavelet-based mechanomyographic analysis for muscle contraction evoked by fes in a spinal cord injured person. In: 10th IASTED International Conference on Biomedical Engineering; 2013 Feb 13-15; Innsbruck. Innsbruck, Austria; 2013a. p. 237-42. PMid:23746611
Krueger E, Scheeren E, Nogueira-Neto GN, Nohama P. Time-frequency muscle responses elicited by different FES modulating frequencies in paraplegics. In: 18th IFESS Annual Conference; 2013; Donostia-San Sebastian. Donostia-San Sebastian, Spain; 2013b. p. 249-52.
Krueger E, Scheeren E, Nogueira-Neto GN, Button VLSN, Nohama P. A New Approach to Assess the Spasticity in Hamstrings Muscles using Mechanomyography Antagonist Muscular Group. In: 34th Annual International Conference of the IEEE (EMBS); 2012 Aug 28 - Sept 1; San Diego. San Diego, California; 2012a. p. 2060-3.
Krueger E, Scheeren E, Nogueira-Neto GN, Neves EB, Button VLdSN, Nohama P. Inluence of skinfold thickness in mechanomyography features. In: World Congress on Rev. Bras. Eng. Bioméd., v. 30, n. 4, p. 384-401, dez. 2014