*e-mail: [email protected]
Received: 03 February 2014 / Accepted: 05 August 2014
A systematic review on the evaluation and characteristics of
computer-aided diagnosis systems
Vagner Mendonça Gonçalves*, Márcio Eduardo Delamaro, Fátima de Lourdes dos Santos Nunes
Abstract Introduction: One of the challenges in developing Computer-Aided Diagnosis (CAD) systems is their accurate and comprehensive assessment. This paper presents the conduction and results of a systematic review (SR) that aims to verify the state of the art regarding the assessment of CAD systems. This survey provides a general analysis of the current status of the design, development and assessment of such systems and includes discussions on the most used metrics and approaches that could be utilized to obtain more objective evaluation methods. Methods: The SR was conducted using the scientii c databases, ACM Digital Library, IEEE Xplore Digital Library, ScienceDirect and Web of Science. Inclusion and exclusion criteria were dei ned and applied to each retrieved work to select those of interest. From 156 studies retrieved, 100 studies were included. Results: There is a number of abnormalities that have been used for the development of CAD systems. Images from computed tomographies and mammographies are the most encountered types of medical images. Additionally, a number of studies used public databases for CAD evaluations. The main evaluation metrics and methods applied to CAD systems include sensitivity, accuracy, specii city and receiver operating characteristic (ROC) analyses. In the assessed CAD systems that used the segmentation method, 30.0% applied the overlap measure. Discussion: There remain several topics to explore for the assessment of CAD schemes. While some evaluation metrics are traditionally used, they require a prior knowledge of case characteristics to test CAD systems. We were not able to identify articles that use software testing to evaluate CAD systems. Thus, we realize that there is a gap between CAD assessments and traditional practices of software engineering. However, the scope of this research is limited to scientii c and academic works and excludes commercial interests. Finally, we discuss potential research studies within this scope to create a more objective and efi cient evaluation of CAD systems. Keywords CAD evaluation, Classii cation, Computer-aided diagnosis, Detection, Medical image,
Segmentation.
Introduction
Computer-Aided Diagnosis (CAD) schemes are
computer systems aiming at providing second
opinions to physicians to aid in diagnoses (Doi,
2007). These systems compute outputs based on
information from diverse sources, primarily from
medical images captured using various methods.
According to van Ginneken et al. (2010), CAD has
become the most active i eld of research in medical
imaging. Further, Doi (2006) showed that CAD systems
provide consistent interpretations of medical images
to improve the precision of a diagnosis.
The assessment of CAD schemes is one of the
major difi culties encountered in their development.
Because results can vary depending on the used set
of images, it is not an easy task to determine the
effectiveness of a particular technique. To ascertain the
feasibility of a technique, tests should be conducted
with a set of images that preferably have varied
acquisition characteristics. Additionally, this image
set should meet the requirements of the purpose of the
technique, i.e., they should contain the structures sought
by the computer system. This entails a collaborative
effort with hospitals and clinics to perform detailed
and thorough analyses to obtain appropriate medical
images and their respective reports. The cataloging
of these images based on their characteristics allow
for their fast and accurate retrieval.
This paper presents a systematic review (SR)
aiming to verify the state of the art regarding the
assessment of CAD systems. Additionally, we analyzed
data from the included studies, such as computational
techniques employed in the development of CAD
schemes, abnormalities investigated and modalities of
the most explored medical imaging. Thus, this survey
made possible a general analysis of the current scope
regarding the design, development and assessment
of such systems.
Overviews on the development and trends of
CAD schemes have been presented by Doi (2007)
and Shiraishi et al. (2009). Doi (2007) carried out a
historical review regarding the development of CAD
schemes. Examples of works that explored different
aid in diagnosing several abnormalities, such as lung
nodules, vertebral fractures and intracranial aneurysms.
Doi also discussed the potential of such schemes
for applications in clinical routines. Shiraishi et al.
(2009) presented a review on the application of
analyses using Receiver Operating Characteristic
(ROC) curves to assess CAD systems. The review
included studies published in Radiology Journal
between 1997 and 2006. The review also analyzed the
participation of human observers in the assessment
processes and identiied the most explored medical
imaging modalities.
In our study, the presented unique systematic
review is based on a set of criteria characterizing
the differences and relevance between results, as
listed below:
• A comprehensive selection of scientiic
databases as reference sources, allowing
access to diverse publications in the ield
(these databases were selected after carrying
out an exploratory study that deined relevant
research sources);
• A deinition and disclosure of an SR protocol
that was strictly followed during the review
(this protocol permitted a reproducible review
and audited the used criteria); and
An analysis of results taking into account
each automated task to aid individual diagnoses
(i.e., segmentation, detection and classiication of
abnormalities and regions of interest).
In addition to this introductory section, the paper is
organized as follows. The “Methods” section presents
concepts about the SR, the protocol used and the
process of conducting the review. The “
Results and discussion” section presents and
discusses the results.
Methods
The systematic review is a rigorous methodology of
bibliographic research that aims to identify primary
and secondary studies related to a particular research
topic. It permits the assessment and interpretation of
all relevant research on a particular issue or topic of
interest (Kitchenham, 2004).
According to Biolchini et al. (2007) and
Kitchenham (2004), an SR is carried out in three
well-deined phases: planning, conduction and analysis
of results. In the planning phase, a protocol is deined
specifying research questions and the methodology
to be employed in the conduction of the review.
Furthermore, this protocol deines purposes for the
SR, reference sources, criteria for the inclusion or
exclusion of primary studies, keywords and other
topics of interest. In the conduction phase, the
bibliographic research is carried out. In this phase,
studies are selected according to the deined inclusion
and exclusion criteria. Finally, in the analysis of
results, the data extraction is performed, and the
results are compared.
A major difference between an SR and the
non-systematic review of the literature is the fact that
the establishment of a protocol allows the SR to be
reproduced and audited. Other researchers can follow
the same protocol and assess the methods used for the
case at issue (Biolchini et al., 2007). The following
subsections describe each of the previously cited phases
applied in the SR carried out in the present work.
Planning
First, research questions are deined:
• What are the methodologies currently applied
for the assessment of CAD systems based on
medical imaging?
• What are the modalities of medical imaging,
abnormalities and computational techniques
involved in the development of CAD systems?
• What are the advantages and limitations
presented by the assessment methodologies
employed in CAD systems?
An exploratory analysis on CAD was carried out
over several scientiic databases. This preliminary
survey aided in selecting reference sources and the
deinition of the keywords used in the SR. Based on
our experiences with journals, we consulted databases
that traditionally published articles on the subject.
The following databases were selected:
• ACM Digital Library
(ACM)
• IEEE Xplore Digital Library
(IEEE)
• ScienceDirect
(SD)
• Web of Science
(WS)
From the deined keywords of the protocol, queries
for papers on journals or proceedings of scientiic
conferences were carried out in the selected databases.
Only recent studies (published since 2006) were
considered for assessing the state of the art of CAD.
The selection of acknowledged reference sources
in the ield made it possible to retrieve a signiicant
number of studies on CAD. Moreover, deining
adequate criteria for the inclusion and exclusion of
works focused the sources to the relevant subject
matter. A composition of terms was used to initially
narrow the scope of the reference sources. These terms
had to be present in the title, abstract or keywords to
qualify a source (these indices were searchable by
means of advanced search tools available for each
(evaluation OR testing OR assessment) AND
(aided diagnosis system” OR “computer-aided diagnosis scheme” OR “computer-assisted diagnosis system” OR “computer-assisted diagnosis scheme” OR “diagnosis support system” OR “diagnostic support system”)
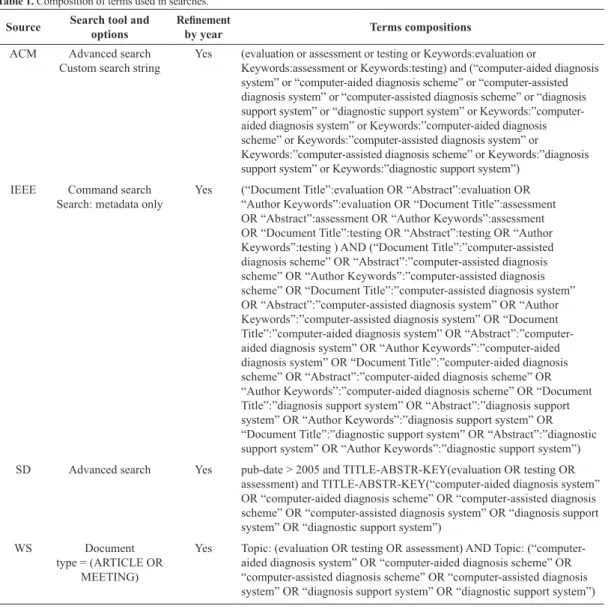
Table 1 presents the compositions of terms
translated for each of the search engines of the
consulted databases.
To select only relevant papers for the subject of
study, we deined the inclusion and exclusion criteria.
We included only studies that met at least one of the
inclusion criteria and none of the exclusion criteria.
Sources that met the deined inclusion criteria
had to:
(a) present or discuss concepts, criteria and
methodologies to assess CAD systems whose
outputs are presented as images or use images
processed in a way to enable diagnoses;
(b) apply a specific methodology in the
assessment of some CAD system with
the characteristics mentioned in the irst
inclusion criterion; or
(c) present concepts or historical reviews on CAD.
In turn, excluded sources that met all the deined
exclusion criteria had to:
(d) be similar, in content and results, with other
studies by the same authors retrievable from
any of the consulted databases;
(e) have a publication year outside the speciied
deadline (i.e., earlier than 2006); and
Table 1. Composition of terms used in searches.
Source Search tool and
options
Reinement
by year Terms compositions
ACM Advanced search
Custom search string
Yes (evaluation or assessment or testing or Keywords:evaluation or
Keywords:assessment or Keywords:testing) and (“computer-aided diagnosis system” or “computer-aided diagnosis scheme” or “computer-assisted diagnosis system” or “computer-assisted diagnosis scheme” or “diagnosis support system” or “diagnostic support system” or Keywords:”computer-aided diagnosis system” or Keywords:”computer-Keywords:”computer-aided diagnosis scheme” or Keywords:”computer-assisted diagnosis system” or Keywords:”computer-assisted diagnosis scheme” or Keywords:”diagnosis support system” or Keywords:”diagnostic support system”)
IEEE Command search
Search: metadata only
Yes (“Document Title”:evaluation OR “Abstract”:evaluation OR “Author Keywords”:evaluation OR “Document Title”:assessment OR “Abstract”:assessment OR “Author Keywords”:assessment OR “Document Title”:testing OR “Abstract”:testing OR “Author Keywords”:testing ) AND (“Document Title”:”computer-assisted diagnosis scheme” OR “Abstract”:”computer-assisted diagnosis scheme” OR “Author Keywords”:”computer-assisted diagnosis scheme” OR “Document Title”:”computer-assisted diagnosis system” OR “Abstract”:”computer-assisted diagnosis system” OR “Author Keywords”:”computer-assisted diagnosis system” OR “Document Title”:”computer-aided diagnosis system” OR “Abstract”:”computer-aided diagnosis system” OR “Author Keywords”:”computer-“Abstract”:”computer-aided diagnosis system” OR “Document Title”:”computer-aided diagnosis scheme” OR “Abstract”:”computer-aided diagnosis scheme” OR “Author Keywords”:”computer-aided diagnosis scheme” OR “Document Title”:”diagnosis support system” OR “Abstract”:”diagnosis support system” OR “Author Keywords”:”diagnosis support system” OR “Document Title”:”diagnostic support system” OR “Abstract”:”diagnostic support system” OR “Author Keywords”:”diagnostic support system”)
SD Advanced search Yes pub-date > 2005 and TITLE-ABSTR-KEY(evaluation OR testing OR assessment) and TITLE-ABSTR-KEY(“computer-aided diagnosis system” OR “computer-aided diagnosis scheme” OR “computer-assisted diagnosis scheme” OR “computer-assisted diagnosis system” OR “diagnosis support system” OR “diagnostic support system”)
WS Document
type = (ARTICLE OR MEETING)
(f) not be fully available in the consulted databases
or in any other database accessible on the
Internet.
Conduction and data extraction
The searches were carried out between April and
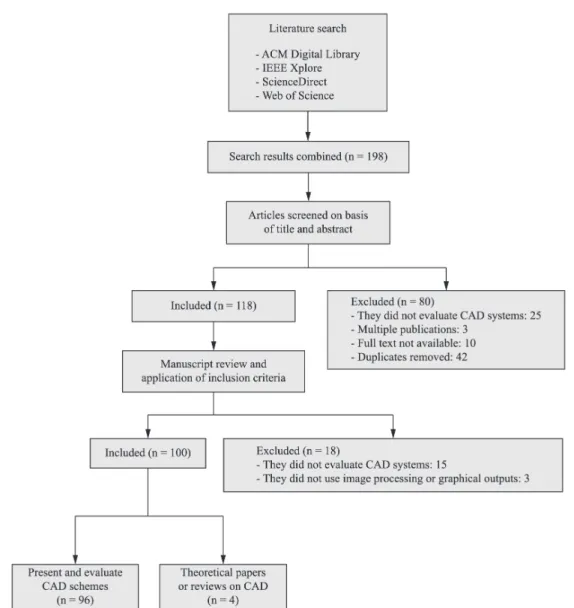
June 2014. In total, 156 studies were retrieved. As
a whole, 100 studies (64.10%) were included, 96 of
which had CAD schemes and the employed assessment
methodologies. Four papers contained conceptual
contents as described in the subsection “
Review and
theoretical papers
”.
Every conduction stage of the SR was duly
documented based on the models proposed in
Biolchini et al. (2007) and Kitchenham (2004). The
produced documents and the tools used are described
below.
Conduction form
: One form was produced for each
consulted database. They document all the relevant
information of the search: access dates, a composition
of terms used, a list of retrieved studies and their
satisied inclusion criteria and other observations.
Data extraction form
: For each included study, in
addition to the bibliographic and reference information,
a summary of the study and documented topics of
interest were included. The main topics of interest
extracted included: the purpose of the system used/
proposed, assessment method of the employed CAD,
modality and number of images/cases used in the
test, main tests and results and other information
relevant research.
Figure 1 shows a flow diagram, based on
Liberati et al. (2009), which summarizes the selection
of the studies.
Table 2 shows the studies included, and their
satisied inclusion criteria. We retrieved studies
published in scientific journals, conference
proceedings and other collections of articles. In
particular, a signiicant variety of medical publications,
computational intelligence, and imaging processing
and analyses (other than pattern recognition) were
observed. Table 3, Table 4 and Table 5 show the
Table 2. Criteria met by each included paper.
Reference Criteria Reference Criteria
Al-Absi et al. (2012) (b) López et al. (2011) (a) (b)
Ampeliotis et al. (2007) (b) Muramatsu et al. (2013) (b)
Ashwin et al. (2012) (a) (b) Markkongkeaw et al. (2013) (b)
Barhoumi et al. (2007) (b) Martinez-Murcia et al. (2014) (b)
Beuren et al. (2012) (a) (b) Mironică et al. (2011) (b)
Bevilacqua (2013) (a) (b) Miyaki et al. (2013) (b)
Bhooshan et al. (2011) (b) Moon et al. (2011) (b)
Chan (2010) (b) Mumcuoglu et al. (2011) (a) (b)
Chang et al. (2006) (b) Muramatsu et al. (2013) (b)
Charbonnier et al. (2013) (a) (b) Nagata et al. (2013) (b)
Charisis et al. (2013) (b) Nava et al. (2014) (b)
Cheng et al. (2012) (a) (b) Odeh et al. (2006) (a) (b)
David et al. (2008) (b) Osman et al. (2009) (a) (b)
Elizabeth et al. (2012) (a) (b) Pietka et al. (2010) (a) (b)
Endo et al. (2012) (a) (b) Pietka et al. (2011) (a) (c)
Filipczuk et al. (2013) (b) Raja et al. (2007) (b)
García-Orellana et al. (2008) (b) Raja et al. (2010) (b)
Garnavi et al. (2011) (a) (b) Ramírez et al. (2009) (b)
Garnavi et al. (2012) (b) Ramos et al. (2012) (a) (b)
Gedik and Atasoy (2013) (a) (b) Retter et al. (2013) (b)
Geetha et al. (2008) (a) (b) Roberts et al. (2010) (b)
Giannakopoulou et al. (2010) (b) Sanchez et al. (2011) (a) (b)
Gomathi and Thangaraj (2010) (b) Sasaki et al. (2010) (b)
Gopinath and Shanthi (2013) (a) (b) Sato et al. (2011) (a) (b)
Grana et al. (2011) (b) Schilham et al. (2006) (a) (b)
Gruszauskas et al. (2008) (a) (b) Segovia et al. (2012) (a) (b)
Gruszauskas et al. (2009) (b) Shen et al. (2007) (a) (b)
Haindl et al. (2007) (b) Shilaskar and Ghatol (2013) (a) (b)
Hatanaka et al. (2011) (b) Shiraishi et al. (2009) (a) (c)
He et al. (2011) (b) Song et al. (2010) (a) (b)
Hebert et al. (2012) (b) Streba et al. (2012) (b)
Huang et al. (2007) (b) Suganthi and Madheswaran (2010) (b)
Huang et al. (2009a) (b) Sulaiman et al. (2012) (b)
Huang et al. (2009b) (a) (b) Tahmasbi et al. (2011) (b)
Álvarez Illán et al. (2010) (b) Tan et al. (2010) (a) (b)
Itai et al. (2009) (b) Tanner et al. (2006) (b)
Jasmine et al. (2009) (b) Tolouee et al. (2011) (b)
Koriatis et al. (2007) (b) Usha and Sandya (2013) (b)
Korotkov and Garcia (2012) (c) Verikas et al. (2006) (b)
Kovacs et al. (2006) (a) (b) Verma (2009) (b)
Kuang and Ye (2008) (b) Vertan et al. (2011) (b)
Kumar et al. (2011) (a) (b) Voigt et al. (2010) (b)
Lartizien et al. (2014) (a) (b) Volpi et al. (2009) (b)
Lee et al. (2009) (a) (b) Wada et al. (2006) (b)
Lerdsinmongkol et al. (2011) (a) (b) Wang et al. (2009) (b)
Li et al. (2009) (a) (b) Wittenberg et al. (2012) (b)
Li et al. (2012) (a) (b) Wu et al. (2006) (b)
Liu et al. (2012) (a) (b) Xiao et al. (2010) (b)
Liu et al. (2013) (b) Zhang et al. (2011) (a) (c)
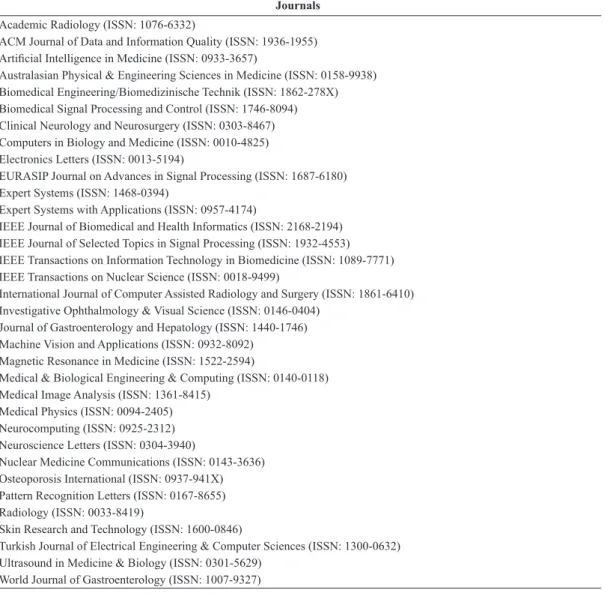
Table 3. Journals that provided the included papers.
Journals Academic Radiology (ISSN: 1076-6332)
ACM Journal of Data and Information Quality (ISSN: 1936-1955) Artiicial Intelligence in Medicine (ISSN: 0933-3657)
Australasian Physical & Engineering Sciences in Medicine (ISSN: 0158-9938) Biomedical Engineering/Biomedizinische Technik (ISSN: 1862-278X) Biomedical Signal Processing and Control (ISSN: 1746-8094) Clinical Neurology and Neurosurgery (ISSN: 0303-8467) Computers in Biology and Medicine (ISSN: 0010-4825) Electronics Letters (ISSN: 0013-5194)
EURASIP Journal on Advances in Signal Processing (ISSN: 1687-6180) Expert Systems (ISSN: 1468-0394)
Expert Systems with Applications (ISSN: 0957-4174)
IEEE Journal of Biomedical and Health Informatics (ISSN: 2168-2194) IEEE Journal of Selected Topics in Signal Processing (ISSN: 1932-4553) IEEE Transactions on Information Technology in Biomedicine (ISSN: 1089-7771) IEEE Transactions on Nuclear Science (ISSN: 0018-9499)
International Journal of Computer Assisted Radiology and Surgery (ISSN: 1861-6410) Investigative Ophthalmology & Visual Science (ISSN: 0146-0404)
Journal of Gastroenterology and Hepatology (ISSN: 1440-1746) Machine Vision and Applications (ISSN: 0932-8092)
Magnetic Resonance in Medicine (ISSN: 1522-2594)
Medical & Biological Engineering & Computing (ISSN: 0140-0118) Medical Image Analysis (ISSN: 1361-8415)
Medical Physics (ISSN: 0094-2405) Neurocomputing (ISSN: 0925-2312) Neuroscience Letters (ISSN: 0304-3940)
Nuclear Medicine Communications (ISSN: 0143-3636) Osteoporosis International (ISSN: 0937-941X) Pattern Recognition Letters (ISSN: 0167-8655) Radiology (ISSN: 0033-8419)
Skin Research and Technology (ISSN: 1600-0846)
Turkish Journal of Electrical Engineering & Computer Sciences (ISSN: 1300-0632) Ultrasound in Medicine & Biology (ISSN: 0301-5629)
World Journal of Gastroenterology (ISSN: 1007-9327)
Table 4. Collections that provided the included papers.
Collections
Advances in Neuro-Information Processing (Lecture Notes in Computer Science, ISBN: 978-3-642-02489-4) Advances in Visual Computing - Part II (Lecture Notes in Computer Science, ISBN: 978-3-540-48626-8) Computer Analysis of Images and Patterns (Lecture Notes in Computer Science, ISBN: 978-3-540-74271-5) Digital Mammography (Lecture Notes in Computer Science, ISBN: 978-3-540-35625-7)
Image Analysis and Recognition (Lecture Notes in Computer Science, ISBN: 978-3-540-44894-5)
Knowledge-Based Intelligent Information and Engineering Systems (Lecture Notes in Computer Science, ISBN: 978-3-540-74828-1)
Medical Biometrics (Lecture Notes in Computer Science, ISBN: 978-3-642-13922-2)
Medical Image Computing and Computer-Assisted Intervention - MICCAI 2009 (Lecture Notes in Computer Science, ISBN: 978-3-642-04270-6)
Medical Imaging and Augmented Reality (Lecture Notes in Computer Science, ISBN: 978-3-540-37220-2)
sources from which studies included in this SR were
taken. The next section presents and discusses the
results obtained through this SR.
Results and Discussion
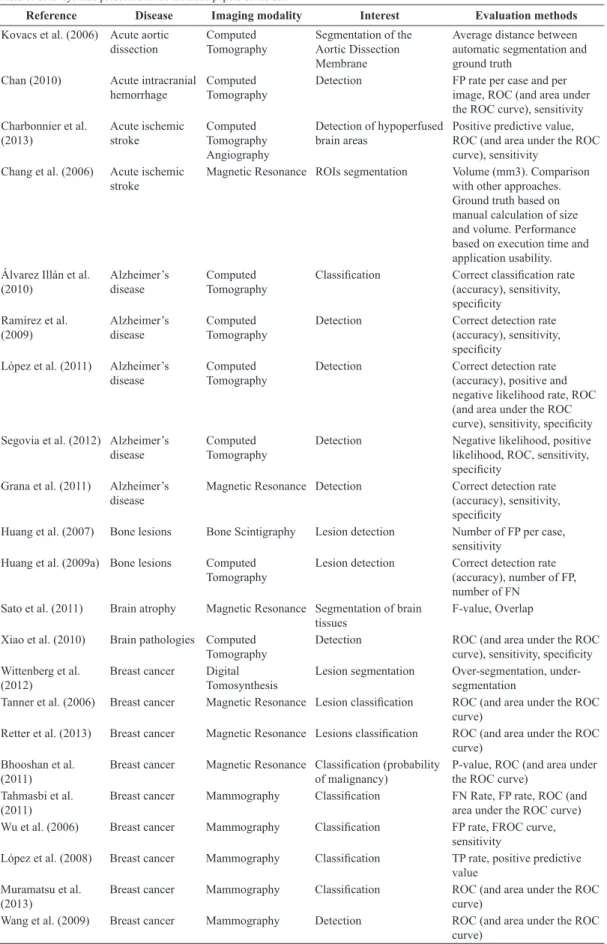
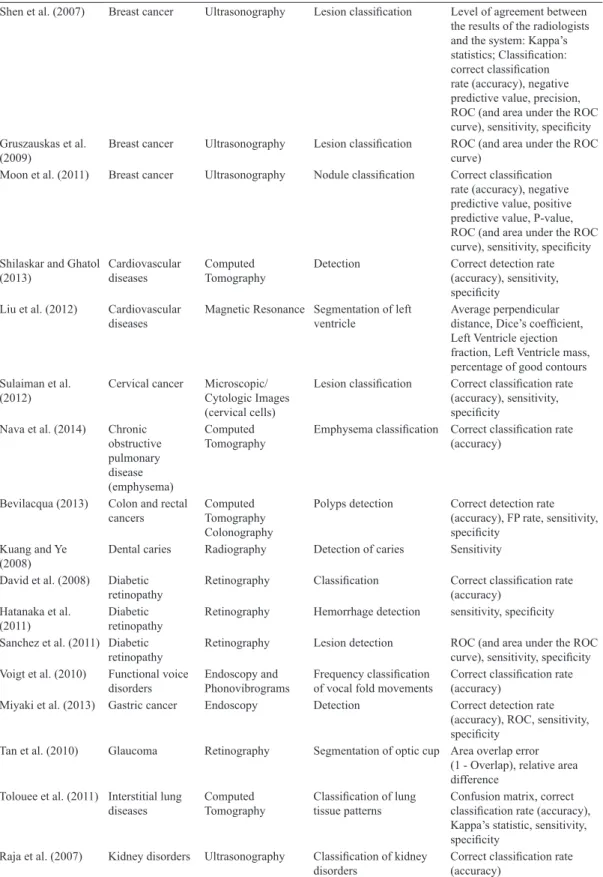
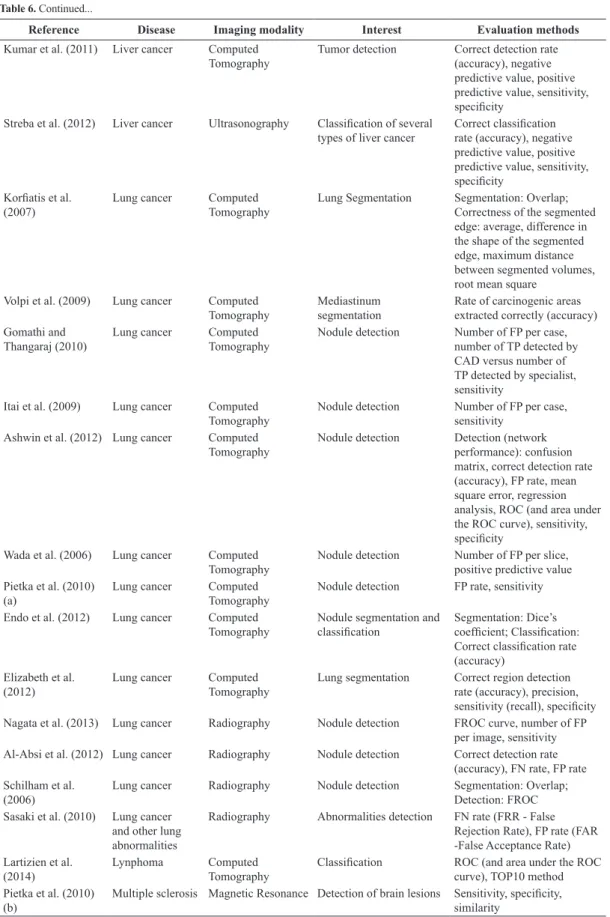
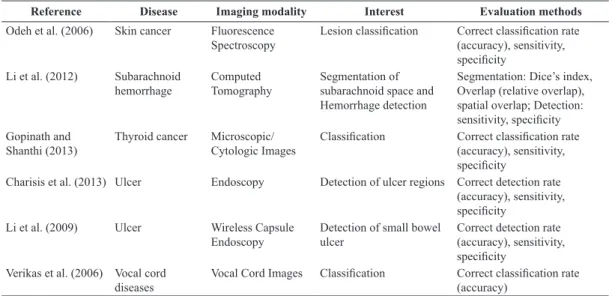
Table 6 presents the 98 CAD systems reported in
the 96 included studies (Pietka et al. (2010) reported
the development of three distinct systems). In the
following subsections, an overview of the state of
the art regarding the development and assessment
of CAD systems is presented based on the studies
included through the SR.
Abnormalities studied
As seen in Table 6, there is a signiicant variety of
abnormalities that are currently subjects of study
for the development of CAD systems. As shown
in Figure 2, breast cancer and lung cancer are the
diseases most commonly studied within the scope
of this SR. Such evidence is signiicant, considering
the importance of early diagnoses of many different
types of neoplasia is well known.
In addition to the diseases mentioned, other
abnormalities were also reported, encompassing the
processing of medical images of different structures
and organs of the human body, including brain, skin,
retina, bones, heart, arteries, liver, ear, prostate, and
gastrointestinal tract, among others (Table 6). CAD
systems are the subject of study and research with
applicability in a wide range of various medical areas.
Although many approaches are still far from clinical
application, the variety of ideas, techniques and
application areas show that one can expect signiicant
development in computational applications for the
diagnosis of many well-known abnormalities.
Modalities of medical imaging exploited
Different types of medical imaging have been objects
of study for the development of CAD systems. This
statement is conirmed by observing the results of
this SR. From the 29 systems that reported dealing
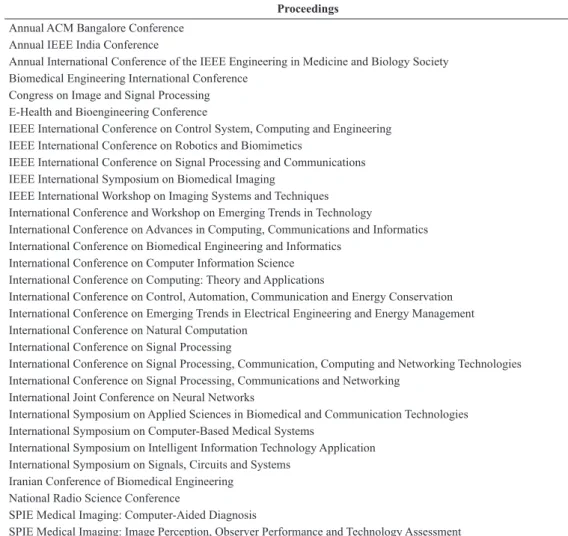
Table 5. Proceedings that provided the included papers.
Proceedings
Annual ACM Bangalore Conference Annual IEEE India Conference
Annual International Conference of the IEEE Engineering in Medicine and Biology Society Biomedical Engineering International Conference
Congress on Image and Signal Processing E-Health and Bioengineering Conference
IEEE International Conference on Control System, Computing and Engineering IEEE International Conference on Robotics and Biomimetics
IEEE International Conference on Signal Processing and Communications IEEE International Symposium on Biomedical Imaging
IEEE International Workshop on Imaging Systems and Techniques International Conference and Workshop on Emerging Trends in Technology
International Conference on Advances in Computing, Communications and Informatics International Conference on Biomedical Engineering and Informatics
International Conference on Computer Information Science International Conference on Computing: Theory and Applications
International Conference on Control, Automation, Communication and Energy Conservation International Conference on Emerging Trends in Electrical Engineering and Energy Management International Conference on Natural Computation
International Conference on Signal Processing
International Conference on Signal Processing, Communication, Computing and Networking Technologies International Conference on Signal Processing, Communications and Networking
International Joint Conference on Neural Networks
International Symposium on Applied Sciences in Biomedical and Communication Technologies International Symposium on Computer-Based Medical Systems
International Symposium on Intelligent Information Technology Application International Symposium on Signals, Circuits and Systems
Iranian Conference of Biomedical Engineering National Radio Science Conference
SPIE Medical Imaging: Computer-Aided Diagnosis
Table 6. CAD systems presented in the included papers of the SR.
Reference Disease Imaging modality Interest Evaluation methods
Kovacs et al. (2006) Acute aortic dissection
Computed Tomography
Segmentation of the Aortic Dissection Membrane
Average distance between automatic segmentation and ground truth
Chan (2010) Acute intracranial hemorrhage
Computed Tomography
Detection FP rate per case and per
image, ROC (and area under the ROC curve), sensitivity Charbonnier et al.
(2013)
Acute ischemic stroke
Computed Tomography Angiography
Detection of hypoperfused brain areas
Positive predictive value, ROC (and area under the ROC curve), sensitivity
Chang et al. (2006) Acute ischemic stroke
Magnetic Resonance ROIs segmentation Volume (mm3). Comparison with other approaches. Ground truth based on manual calculation of size and volume. Performance based on execution time and application usability. Álvarez Illán et al.
(2010)
Alzheimer’s disease
Computed Tomography
Classiication Correct classiication rate (accuracy), sensitivity, speciicity
Ramírez et al. (2009)
Alzheimer’s disease
Computed Tomography
Detection Correct detection rate
(accuracy), sensitivity, speciicity
López et al. (2011) Alzheimer’s disease
Computed Tomography
Detection Correct detection rate
(accuracy), positive and negative likelihood rate, ROC (and area under the ROC curve), sensitivity, speciicity Segovia et al. (2012) Alzheimer’s
disease
Computed Tomography
Detection Negative likelihood, positive
likelihood, ROC, sensitivity, speciicity
Grana et al. (2011) Alzheimer’s disease
Magnetic Resonance Detection Correct detection rate (accuracy), sensitivity, speciicity
Huang et al. (2007) Bone lesions Bone Scintigraphy Lesion detection Number of FP per case, sensitivity
Huang et al. (2009a) Bone lesions Computed Tomography
Lesion detection Correct detection rate (accuracy), number of FP, number of FN
Sato et al. (2011) Brain atrophy Magnetic Resonance Segmentation of brain tissues
F-value, Overlap
Xiao et al. (2010) Brain pathologies Computed Tomography
Detection ROC (and area under the ROC
curve), sensitivity, speciicity Wittenberg et al.
(2012)
Breast cancer Digital Tomosynthesis
Lesion segmentation Over-segmentation, under-segmentation
Tanner et al. (2006) Breast cancer Magnetic Resonance Lesion classiication ROC (and area under the ROC curve)
Retter et al. (2013) Breast cancer Magnetic Resonance Lesions classiication ROC (and area under the ROC curve)
Bhooshan et al. (2011)
Breast cancer Magnetic Resonance Classiication (probability of malignancy)
P-value, ROC (and area under the ROC curve)
Tahmasbi et al. (2011)
Breast cancer Mammography Classiication FN Rate, FP rate, ROC (and
area under the ROC curve)
Wu et al. (2006) Breast cancer Mammography Classiication FP rate, FROC curve,
sensitivity
López et al. (2008) Breast cancer Mammography Classiication TP rate, positive predictive value
Muramatsu et al. (2013)
Breast cancer Mammography Classiication ROC (and area under the ROC
curve)
Wang et al. (2009) Breast cancer Mammography Detection ROC (and area under the ROC
Reference Disease Imaging modality Interest Evaluation methods
Ramos et al. (2012) Breast cancer Mammography Lesion detection ROC (and area under the ROC curve)
Song et al. (2010) Breast cancer Mammography Lesion segmentation Difference between edges based in distances, Overlap, over-segmentation, under-segmentation
Geetha et al. (2008) Breast cancer Mammography Microcalciication
classiication ROC, sensitivity, speciicity Jasmine et al. (2009) Breast cancer Mammography Microcalciication
classiication Sensitivity Osman et al. (2009) Breast cancer Mammography Microcalciication
classiication Sensitivity, speciicity Giannakopoulou et al.
(2010)
Breast cancer Mammography Microcalciication
classiication ROC (and area under the ROC curve), sensitivity, speciicity
García-Orellana et al. (2008)
Breast cancer Mammography Microcalciication detection
FROC, sensitivity
Gedik and Atasoy (2013)
Breast cancer Mammography ROIs classiication Correct classiication rate (accuracy), ROC, sensitivity, speciicity
Verma (2009) Breast cancer Mammography ROIs classiication Correct classiication rate (accuracy)
Haindl et al. (2007) Breast cancer Mammography ROIs segmentation Indexes of the Prague Texture Segmentation Datagenerator and Benchmark (Haindl and Mikes, 2008)
Zheng et al. (2008) Breast cancer Mammography ROIs segmentation and
classiication Segmentation: relative area difference; Classiication: ROC (and area under the ROC curve)
He et al. (2011) Breast cancer Mammography Segmentation of tissue structure and risk classiication
Segmentation: comparison between automated and manual segmentation; Risk classiication: satisfaction of health professionals, sensitivity
Suganthi and Madheswaran (2010)
Breast cancer Mammography Tumor classiication Correct classiication rate (accuracy), ROC (and area under the ROC curve) Filipczuk et al.
(2013)
Breast cancer Microscopic/
Cytologic Images Classiication Classiication: correct classiication rate (accuracy), Matthews correlation coeficient, sensitivity, speciicity
Markkongkeaw et al. (2013)
Breast cancer Microscopic/ Cytologic Images (breast tissue cells)
Classiication of histological structures
Correct classiication rate (accuracy)
Lee et al. (2009) Breast cancer Ultrasonography Lesion classiication Correct classiication rate (accuracy), Fisher estimator, negative predictive value, precision, ROC (and area under the ROC curve), sensitivity, speciicity Gruszauskas et al.
(2008)
Reference Disease Imaging modality Interest Evaluation methods
Shen et al. (2007) Breast cancer Ultrasonography Lesion classiication Level of agreement between the results of the radiologists and the system: Kappa’s statistics; Classiication: correct classiication rate (accuracy), negative predictive value, precision, ROC (and area under the ROC curve), sensitivity, speciicity Gruszauskas et al.
(2009)
Breast cancer Ultrasonography Lesion classiication ROC (and area under the ROC curve)
Moon et al. (2011) Breast cancer Ultrasonography Nodule classiication Correct classiication rate (accuracy), negative predictive value, positive predictive value, P-value, ROC (and area under the ROC curve), sensitivity, speciicity Shilaskar and Ghatol
(2013)
Cardiovascular diseases
Computed Tomography
Detection Correct detection rate
(accuracy), sensitivity, speciicity
Liu et al. (2012) Cardiovascular diseases
Magnetic Resonance Segmentation of left ventricle
Average perpendicular distance, Dice’s coeficient, Left Ventricle ejection fraction, Left Ventricle mass, percentage of good contours Sulaiman et al.
(2012)
Cervical cancer Microscopic/ Cytologic Images (cervical cells)
Lesion classiication Correct classiication rate (accuracy), sensitivity, speciicity
Nava et al. (2014) Chronic obstructive pulmonary disease (emphysema)
Computed Tomography
Emphysema classiication Correct classiication rate (accuracy)
Bevilacqua (2013) Colon and rectal cancers
Computed Tomography Colonography
Polyps detection Correct detection rate (accuracy), FP rate, sensitivity, speciicity
Kuang and Ye (2008)
Dental caries Radiography Detection of caries Sensitivity
David et al. (2008) Diabetic retinopathy
Retinography Classiication Correct classiication rate (accuracy)
Hatanaka et al. (2011)
Diabetic retinopathy
Retinography Hemorrhage detection sensitivity, speciicity
Sanchez et al. (2011) Diabetic retinopathy
Retinography Lesion detection ROC (and area under the ROC curve), sensitivity, speciicity Voigt et al. (2010) Functional voice
disorders
Endoscopy and Phonovibrograms
Frequency classiication of vocal fold movements
Correct classiication rate (accuracy)
Miyaki et al. (2013) Gastric cancer Endoscopy Detection Correct detection rate
(accuracy), ROC, sensitivity, speciicity
Tan et al. (2010) Glaucoma Retinography Segmentation of optic cup Area overlap error (1 - Overlap), relative area difference
Tolouee et al. (2011) Interstitial lung diseases
Computed Tomography
Classiication of lung tissue patterns
Confusion matrix, correct classiication rate (accuracy), Kappa’s statistic, sensitivity, speciicity
Raja et al. (2007) Kidney disorders Ultrasonography Classiication of kidney disorders
Correct classiication rate (accuracy)
Reference Disease Imaging modality Interest Evaluation methods
Kumar et al. (2011) Liver cancer Computed Tomography
Tumor detection Correct detection rate (accuracy), negative predictive value, positive predictive value, sensitivity, speciicity
Streba et al. (2012) Liver cancer Ultrasonography Classiication of several types of liver cancer
Correct classiication rate (accuracy), negative predictive value, positive predictive value, sensitivity, speciicity
Koriatis et al. (2007)
Lung cancer Computed
Tomography
Lung Segmentation Segmentation: Overlap; Correctness of the segmented edge: average, difference in the shape of the segmented edge, maximum distance between segmented volumes, root mean square
Volpi et al. (2009) Lung cancer Computed Tomography
Mediastinum segmentation
Rate of carcinogenic areas extracted correctly (accuracy) Gomathi and
Thangaraj (2010)
Lung cancer Computed
Tomography
Nodule detection Number of FP per case, number of TP detected by CAD versus number of TP detected by specialist, sensitivity
Itai et al. (2009) Lung cancer Computed Tomography
Nodule detection Number of FP per case, sensitivity
Ashwin et al. (2012) Lung cancer Computed Tomography
Nodule detection Detection (network performance): confusion matrix, correct detection rate (accuracy), FP rate, mean square error, regression analysis, ROC (and area under the ROC curve), sensitivity, speciicity
Wada et al. (2006) Lung cancer Computed Tomography
Nodule detection Number of FP per slice, positive predictive value Pietka et al. (2010)
(a)
Lung cancer Computed
Tomography
Nodule detection FP rate, sensitivity
Endo et al. (2012) Lung cancer Computed Tomography
Nodule segmentation and
classiication Segmentation: Dice’s coeficient; Classiication: Correct classiication rate (accuracy)
Elizabeth et al. (2012)
Lung cancer Computed
Tomography
Lung segmentation Correct region detection rate (accuracy), precision, sensitivity (recall), speciicity Nagata et al. (2013) Lung cancer Radiography Nodule detection FROC curve, number of FP
per image, sensitivity Al-Absi et al. (2012) Lung cancer Radiography Nodule detection Correct detection rate
(accuracy), FN rate, FP rate Schilham et al.
(2006)
Lung cancer Radiography Nodule detection Segmentation: Overlap;
Detection: FROC Sasaki et al. (2010) Lung cancer
and other lung abnormalities
Radiography Abnormalities detection FN rate (FRR - False Rejection Rate), FP rate (FAR -False Acceptance Rate) Lartizien et al.
(2014)
Lynphoma Computed
Tomography
Classiication ROC (and area under the ROC curve), TOP10 method Pietka et al. (2010)
(b)
Multiple sclerosis Magnetic Resonance Detection of brain lesions Sensitivity, speciicity, similarity
Reference Disease Imaging modality Interest Evaluation methods
Huang et al. (2009b) Nuclear cataract Slit lamp Classiication Ranking of cases: normalized discounted cumulative gain; Classiication: accuracy in the prediction of score to images, mean error between predicted scores and scores deined by experts
Muramatsu et al. (2013)
Osteoporosis Radiography Detection of osteoporotic risk
Sensitivity, speciicity
Roberts et al. (2010) Osteoporosis Radiography Detection of vertebral fractures
FP rate, ROC, sensitivity
Vertan et al. (2011) Otitis Otoscopy Otitis detection Correct detection rate
(accuracy) Mironică et al.
(2011)
Otitis Otoscopy Otitis detection Correct detection rate
(accuracy) Usha and Sandya
(2013)
Ovarian abnormalities
Ultrasonography Segmentation,
measurement and feature extraction of ovarian
Percentage of error in the measurements (based on measurements made manually by experts)
Martinez-Murcia et al. (2014)
Parkinson Computed
Tomography
Detection Correct detection rate
(accuracy), negative likelihood, positive likelihood, sensitivity, speciicity Hebert et al. (2012) Pathological state
of pulmonary alveoli
Confocal Microscopy
Classiication Correct classiication rate (accuracy)
Lerdsinmongkol et al. (2011)
Pleural mesotelioma
Computed Tomography
Pleura segmentation Bit quads, 3D connected component labeling Pietka et al. (2010)
(c)
Pneumothorax Computed Tomography
Segmentation Sensitivity, speciicity
Ampeliotis et al. (2007)
Prostate cancer Magnetic Resonance Classiication of prostate tissues
Correct classiication rate (accuracy)
Liu et al. (2013) Prostate cancer Magnetic Resonance Detection ROC (and area under the ROC curve)
Mumcuoglu et al. (2011)
Renal cortical scars
Renal Cortical Scintigraphy
Detection of cortical scars FROC
Raja et al. (2010) Renal cysts Ultrasonography Classiication of cases Cross validation with specialist analysis results, F-score, ROC
Cheng et al. (2012) Retinal diseases Retinography Segmentation of optic disk Area overlap error (1 - Overlap) Garnavi et al. (2011) Skin cancer Dermatoscopy Detection of melanoma
edges
Correct detection rate (accuracy), edge error, positive predictive value, sensitivity, similarity, speciicity
Barhoumi et al. (2007)
Skin cancer Dermatoscopy Lesion classiication Correct classiication rate (accuracy), precision versus revocation, ROC
Reference Disease Imaging modality Interest Evaluation methods
Odeh et al. (2006) Skin cancer Fluorescence Spectroscopy
Lesion classiication Correct classiication rate (accuracy), sensitivity, speciicity
Li et al. (2012) Subarachnoid hemorrhage
Computed Tomography
Segmentation of subarachnoid space and Hemorrhage detection
Segmentation: Dice’s index, Overlap (relative overlap), spatial overlap; Detection: sensitivity, speciicity Gopinath and
Shanthi (2013)
Thyroid cancer Microscopic/
Cytologic Images Classiication Correct classiication rate (accuracy), sensitivity, speciicity
Charisis et al. (2013) Ulcer Endoscopy Detection of ulcer regions Correct detection rate (accuracy), sensitivity, speciicity
Li et al. (2009) Ulcer Wireless Capsule
Endoscopy
Detection of small bowel ulcer
Correct detection rate (accuracy), sensitivity, speciicity
Verikas et al. (2006) Vocal cord diseases
Vocal Cord Images Classiication Correct classiication rate (accuracy)
Table 6. Continued...
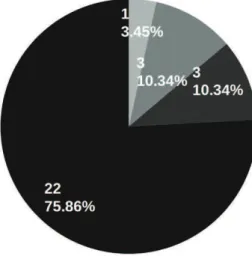
Figure 2. Number of CAD systems used for each abnormality.
with breast cancer, eighteen (62.07%) addressed
mammograms. Mammography is the most effective
technique for the early diagnosis of breast cancer
(Giger, 1999). Thus, the utilization of such images
is still very important due to the possibility that a
physician may misread or misinterpret an exam
(Giannakopoulou et al. 2010; Jasmine et al. 2009;
Osman et al. 2009; Verma, 2009). Five other systems
(17.24%) reported work with ultrasound imaging, a
technique that has been very important, in conjunction
with mammography, in increasing the precision of
breast cancer diagnosis (Giger, 1999; Lee et al., 2009;
Shen et al., 2007). Other reported imaging modalities
dealing with breast cancer included magnetic resonance
imaging (10.34%), microscopic/cytologic imaging
(6.90%) and digital tomosynthesis (3.45%). Works
with magnetic resonance, microscopic/cytologic
imaging and digital tomosynthesis have only been
recently developed, which suggests the use of new
imaging techniques to aid in breast cancer diagnoses.
The literature search also yielded thirteen CAD
systems focused on lung cancer, nine of which
(69.23%) used images from CT examinations. The
other four systems (30.77%) used chest radiography
images.
Four systems reported using images from
dermatoscopy examinations to address skin cancer,
while only one used images from luorescence
spectroscopy.
Five systems were reported to diagnose eye diseases
affecting the retina using processed retinography
images. In turn, the system used to diagnose nuclear
cataracts (Huang et al., 2009b) worked with images
obtained by means of a slit lamp.
The graph in Figure 3 presents the number of
systems for each medical imaging method in the
studies. In this graph, each reported system is evaluated
for modality, independent of the studied abnormality.
As seen, images from CTs and mammographies
were the most exploited for the development of
CAD systems.
Tasks for computer-aided diagnosis systems
Each developed technique performed a speciic task
utilizing a computer-aided diagnosis. In general, a
complete CAD system involved segmented structures,
the detection of abnormalities and the extraction of
their characteristics for a subsequent classiication
of the problem (e.g., normal, benign or malignant,
depending on the case). For example, to classify
structures, the previous stages of segmentation and
detection are required. Studies with CAD schemes
have contributed to the automation of these tasks,
either by means of developing a new technique or
improving an existing technique. For each task of
interest, the charts presented in Figure 4, Figure 5
and Figure 6 show the number of reported systems
that contributed innovations.
Figure 3. Number of CAD systems used for each medical imaging modality.
Most of the CAD systems used for the diagnosis
of breast cancer (Figure 4) aimed at classifying
microcalciications, lesions or other regions of interest
(ROIs). This indicates that the main focus of CAD
technology for breast cancer is the identiication
of suspicious structures in medical images and the
determination of whether these structures are benign or
malignant (i.e., capable of being cancerous). This can
help physicians diagnose the disease and its severity
level, thereby reducing chances of misinterpretation
and aiding in determining recommended treatments.
He et al. (2011) presented an approach to risk
classiications for breast cancer, i.e., a formula to
determine the risk of developing the disease. This
risk was estimated by analyzing mammary tissue
patterns through mammography.
For lung cancer CAD systems (Figure 5), most
systems were designed to detect nodules. Regardless
of the disease studied, it can be seen that the main
tasks of interest were the detection and classiication
of abnormalities (Figure 6). This was expected because
these are the tasks that most relect the contribution
of CAD systems.
Among the reported systems in the reviewed
studies, different techniques have been proposed
to complete the different aforementioned tasks.
Systems utilizing segmentation used techniques
based on thresholding (Ashwin et al., 2012;
Koriatis et al., 2007; Liu et al., 2012; Pietka et al.,
2010; Suganthi and Madheswaran, 2010; Usha and
Sandya, 2013), morphological operators (Beuren et al.,
2012; Lerdsinmongkol et al., 2011; Li et al., 2012;
Usha and Sandya, 2013; Volpi et al., 2009), fuzzy
k-means clustering (Beuren et al., 2012; Li et al.,
2012; Wittenberg et al., 2012), region growing
(Wittenberg et al., 2012; Zheng et al., 2008), and
Figure 5. Tasks executed in the CAD systems: tasks of CAD systems for lung cancer.
Gaussian mixture models (Haindl et al., 2007;
Tan et al., 2010), among others.
For systems focused on detecting abnormalities,
images were analyzed by using techniques to segment
structures in the images. A few of the segmentation
techniques were based on the Fuzzy Set Theory
(Huang et al., 2007; Pietka et al., 2010), thresholding
(Garnavi et al., 2011; Gomathi and Thangaraj, 2010)
and models (Mumcuoglu et al., 2011; Schilham et al.,
2006). Detection approaches were based on the
use of classiiers, such as artiicial neural networks
(Ashwin et al., 2012; Bevilacqua, 2013;
García-Orellana et al., 2008; Itai et al., 2009; Kumar et al.,
2011; Li et al., 2009; López et al., 2011; Mironică et al.,
2011; Sasaki et al., 2010), k-nearest neighbor
(Al-Absi et al., 2012; Li et al., 2009; Mironică et al., 2011;
Sanchez et al., 2011; Schilham et al., 2006), support
vectors machine (Grana et al., 2011; Li et al., 2009;
Martinez-Murcia et al., 2014; Mironică et al., 2011;
Miyaki et al., 2013; Segovia et al., 2012; Shilaskar
and Ghatol, 2013; Wang et al., 2009) and probabilistic
classiiers (Li et al., 2012; Liu et al., 2013; Mironică et al.,
2011; Ramírez et al., 2009; Vertan et al., 2011).
Finally, for classiication tasks, we observed the use
of classiiers such as k-nearest neighbor (Filipczuk et al.,
2013; Gedik and Atasoy, 2013; Gopinath and
Shanthi, 2013; He et al., 2011; Muramatsu et al.,
2013; Nava et al., 2014; Odeh et al., 2006;
Osman et al., 2009; Raja et al., 2010; Verikas et al.,
2006), artiicial neural networks (Barhoumi et al.,
2007; Geetha et al., 2008; Jasmine et al., 2009;
López et al., 2008; Raja et al., 2007; Streba et al., 2012;
Verma, 2009; Wu et al., 2006), Bayesian classiiers
(Ampeliotis et al., 2007; Bhooshan et al., 2011;
Garnavi et al., 2012; Gruszauskas et al., 2008, 2009;
Retter et al., 2013; Tolouee et al., 2011) techniques
based on linear discriminant analysis (Lee et al.,
2009; Muramatsu et al., 2013; Tanner et al., 2006)
and logistic regression models (Shen et al., 2007;
Tanner et al., 2006).
A few studies combined clustering algorithms
with classiication algorithms. He et al. (2011) and
Raja et al. (2010) both used the k-means and k-nearest
neighbor algorithms. Verma (2009) used a clustering
algorithm with artiicial neural networks trained with
back propagation. Barhoumi et al. (2007) classiied
skin lesions by combining results from artiicial neural
networks with results of a content-based image retrieval
(CBIR) scheme through the Dempster-Shafer Theory.
Public databases of medical images
One of the dificulties encountered in the development
of CAD systems is the lack of availability of test cases.
It is not always possible to obtain a medical image
database containing various acquisition characteristics,
structures or abnormalities that a technique requires
for the detection, analysis or diagnosis of a disease.
Factors such as partnerships with clinics and hospitals,
ethical issues, and image access permissions, tend to
hamper the task.
For this reason, a few projects have been developed
and maintained aiming to provide medical images
for research groups that develop CAD technologies.
These projects consist of public databases of medical
images that document reports made by physicians
and often include information about structures of
interest in the images.
We cataloged various public databases from the
systems reported in the studies.
Digital Database for Screening
Mammography - DDSM
(García-Orellana et al.,
2008; Haindl et al., 2007; Muramatsu et al., 2013;
Ramos et al., 2012; Song et al., 2010; Suganthi and
Madheswaran, 2010; Verma, 2009; Wang et al., 2009;
Zheng et al., 2008): maintained by the University
of South Florida, this database serves as a resource
for research in mammographic imaging analysis
(Heath et al., 2001). The database contains 2,620
cases divided into 43 volumes, each composed of
normal cases, cases containing suspicious structures
proved benign or proven cases of cancer. Delineations
of regions of interest (i.e., ground truth regions), if
any, are provided. A set of programs for decoding and
manipulating mammography images are also included.
The mini-MIAS database of mammograms
(Gedik
and Atasoy, 2013; Geetha et al., 2008; He et al., 2011;
Jasmine et al., 2009; López et al., 2008; Osman et al.,
2009; Tahmasbi et al., 2011; Wu et al., 2006): this database
is maintained by the Mammographic Image Analysis
Society (MIAS) and offers 322 mammograms for use
in research. In addition to mammograms, the database
contains information concerning the type, severity and
coordinates of the central pixel of abnormalities, if any,
in each image (Suckling et al., 1994).
Lung Image Database Consortium - LIDC
(Koriatis et al., 2007; Pietka et al., 2010): this public
database is the result of an initiative that aimed to
provide chest CT images to support the development,
training and assessment of CAD schemes for the
detection of pulmonary nodules (Armato III et al.,
2011). The database provides exams of 1,010 patients,
delimitations of existing lesions, and a software for
the manipulation of images.
Japanese Society of Radiological Technology
(JSRT) database
(Al-Absi et al., 2012; Nagata et al.,
2013; Schilham et al., 2006): this database of chest
radiographs of the JSRT was created in cooperation
consists of 247 images, comprising 154 cases of a
single pulmonary nodule (grouped by subtlety) and
93 cases without nodules. It also provides information
about patients (e.g., age and gender), diagnoses (i.e.,
benign or malignant) and central coordinates of each
node (Shiraishi et al., 2000).
MESSIDOR Digital Retinal Images
(Sanchez et al.,
2011): the MESSIDOR database was developed to
facilitate CAD studies for diabetic retinopathy. It
contains 1,200 images of the eye fundus. Moreover,
for each image, it provides scores given by experts
indicating the level of the retinopathy, and the risk
of macular edema (Messidor, 2014).
Digital Retinal Images for Vessel
Extraction - DRIVE
(Hatanaka et al., 2011;
Jiménez et al., 2010): this database was established
with the aim of enabling a comparative study on the
segmentation of blood vessels in retinal images. To
this end, 40 photographs of the retina (eye fundus)
are available. For each photo, there are two manually
segmented blood vessel images (Staal et al., 2004).
Researchers who use the database to test methods for
segmentation of blood vessels can submit their results
through the home-page of the project, to make them
available for comparison with other studies in the area.
STructured Analysis of the Retina - STARE
(Jiménez et al., 2010): The STARE project, initiated
in 1975 at the University of California, focuses on
developing a system to aid in the detection of diseases
of the human eye (McCormick and Goldbaum,
1975). The project has a database with 402 eye
fundus photographs and a corresponding diagnosis
for each image.
Alzheimer ’s Disease Neuroimaging
Initiative - ADNI
(López et al., 2011; Segovia et al.,
2012): The ADNI (Mueller et al., 2005) has the goal
of deining the progression of Alzheimer’s disease. To
this end, it aims to collect and validate data, such as
images from positron emission tomography, magnetic
resonance imaging and other sources, to predict the
disease. The initiative provides collected data for
research purposes. The database contains data and
images on 895 patients.
Assessment of CAD systems
As previously mentioned, the main objectives of this
SR were to examine and analyze the state of the art of
CAD systems. We have already presented the studied
abnormalities, medical imaging modalities, tasks of
interest and public databases used in the testing and
development of the reported systems. In this section,
the assessment techniques are discussed.
From Table 6, we see that assessments of CAD
systems involved carrying out segmentations,
detections or classiications based on a set of inputs
and on previously known correct results (provided
mostly by specialists) to obtain performance metrics
for the system. None of the assessed studies used test
criteria established in the literature, such as functional
or structural techniques. From this point of view, the
assessment is made on an ad hoc basis.
Assessment metrics
Figure 7, Figure 8 and Figure 9 show charts for each
diagnosis and the metrics and assessment methods
applied to the reported systems. We only considered
mentioned methods. However, for the analysis of these
results, we considered the main tasks of each system
and any secondary metrics and methods (Figure 7).
For example, if the main task of interest of a given
work is the classiication of lesions but also reported
on the assessment of a previous segmentation task (i.e.,
mentioning the metrics and/or methods used), these
were included in the chart concerning segmentations.
For each chart, the total number of reported systems
is shown.
The graph in Figure 7 shows that six systems that
assessed a segmentation method applied the
overlap
measure. This measurement consisted obtaining the
Figure 8. Metrics and methods of assessment used in different tasks to aid diagnosis: detection (40 systems reported).
relative area of the intersection between two considered
regions (Gruszauskas et al., 2008; Koriatis et al., 2007)
by means of assessing the set of pixels resulting from
the segmentation process. Given |
A
seg|, the area of an
automatically segmented region
A
seg, and |
A
man|, the
area of a region
A
man, which is considered correct for
the segmentation process (e.g., generated manually),
the overlap measure is deined by Equation 1. A
value of 0 indicates the worst performance, i.e., there
is no intersection between the correct area and the
automatically obtained area. A value of 1 indicates
a perfect segmentation.
seg man
seg man
Overlap A A
A A
∩ =
∪
(1)
A relative area difference metric, applied in the
assessment of three systems (Beuren et al., 2012;
Tan et al., 2010; Zheng et al., 2008), predicts an
extension of the automatically segmented region
that does not match the expected correct region
(Tan et al., 2010). This measure can be obtained
through Equation 2. It is seen, that if
A
seg=
A
man, then
the relative area difference is 0.
seg man
man
Relative Area Difference A A A
−
=
(2)
A metric applied to evaluate segmentation results,
reported in three systems (Endo et al., 2012; Li et al.,
2012; Liu et al., 2012), is Dice’s coeficient. This metric
calculates overlapping areas between an automatically
segmented region and the correct expected region
(Liu et al., 2012). Equation 3 deines the calculation of
this metric. If
Aseg∩Aman =Aseg =Aman, then a perfect
segmentation results (Dice’s coeficient = 1).
seg man '
seg man
2
Dice s coefficient A A
A A
× ∩ =
+
(3)
Other metrics that were also observed for the
segmentation assessment included accuracy and
sensitivity. These metrics are part of a set of very
traditional statistic metrics in the assessment of CAD
systems. They are based on true positive (TP), true
negative (TN), false positive (FP) and false negative
(FN) results (Garnavi et al., 2011), which are concepts
deined by Wagner et al. (2007):
• True positive: a positive detection result of
an abnormal structure present in the organ or
tissue represented in the image, or a correct
classiication for a detected structure;
• True negative: a negative detection result of
an image of an organ or tissue that does not
show any abnormal structure, or a correct
classiication that indicates an abnormal
structure that does not belong to a particular
class;
• False positive: a positive detection result
of an image of an organ or tissue that does
not represent any abnormal structure, or
an incorrect classiication that indicates a
particular structure belonging to a given class
when, in fact, it does not; and
• False negative: a negative detection result of
an image of an organ or tissue that presents
one or more abnormal structures that should
be detected, or an incorrect classiication that
indicates a structure that does not belong to a
given class when, in fact, it does.
In the case of segmentation, an approach for
the use of these metrics is to deine TP pixels (i.e.,
segmented and within the region of interest), TN
(outside the region of interest and not segmented), FP
(segmented and not within the region of interest) and
FN (within the region of interest and not segmented).
Later in this section, these metrics are presented in
relation to inal results of CAD systems. Other methods
and assessment metrics, applicable to segmentation
routines, were observed in the reported systems are
listed in Table 6 and their references.
The metrics and assessment methods applied for
the classiication and detection tasks are mostly the
same. The graphs in Figure 8 and Figure 9 show the
metrics and methods used for each particular task, and
the chart in Figure 10 show the results for both tasks.
As we can be seen, there was a predominant
use of metrics based on TP, TN, FP and FN for the
assessment of classiication and detection tasks in
reported systems. In the combined cases, the sensitivity
metric is the most considered method for evaluating
a CAD system. Table 7 lists the key reported metrics
in Garnavi et al. (2011).
ROC curve
Another widely known method used in the
assessment of CAD systems is the Receiver Operating
Characteristic (ROC) curve. As seen in Figure 7-10,
this method was used to assess 45% of the classiication
systems reported. Figure 10 combines the applied
classiication and detection methods and metrics.
This curve represents the sensitivity as a function
of the fraction of false positives (FFP = 1 – speciicity;
Metz, 1999; Wagner et al., 2007). An example of an
ROC curve trace is shown in Figure 11. An ideal
CAD system presents an operating point (0,1) on the
graph, where 0 represents the minimum FFP and 1
represents the maximum sensitivity. The ROC curve
estimates operating points that the CAD system can
example, this permits the comparison of performances
of multiple techniques, and considers performance
changes with parameter variations.
An assessment metric extracted from the ROC
curve and often employed in the assessment process of
the systems is the
area under the ROC curve
. The larger
the area under the curve, the better the performance
of the CAD system. More details regarding this
metrics can be obtained in Metz (1999) and other
included studies.
FROC curve
Another curve used in the assessment of CAD systems
is the Free-Response Receiver Operating Characteristic
(FROC) curve. This curve represents the sensitivity
as a function of the average number of false positives
per image (Nishikawa, 2007). Despite having been
employed in few reported systems, this method is
worth mentioning given the scope of this SR.
To show the differences between an FROC curve
and a conventional ROC curve, Metz (1999) used an
example of structure detection. A conventional ROC
curve provides the probability for a positive region (i.e.,
containing an abnormal structure) to be diagnosed as
positive (sensitivity) and the probability for a negative
region (i.e., containing no abnormal structure) to be
diagnosed as positive (FFP). An FROC curve provides
the probability that a randomly selected lesion will be
detected after an average number of FP detections.
Figure 10. Metrics and methods of assessment used in different tasks to aid diagnosis: classiication or detection (80 systems reported).
Table 7. Main metrics and assessment methods reported in the papers.
Metrics Formula Description
Sensitivity (or Recall)
(
)
TP
100% TP+FN ×
Percentage of abnormalities correctly detected/ classiied.
Speciicity
(
)
TN
100% TN+FP ×
Percentage of normal structures not incorrectly detected/classiied as possible abnormalities.
Correct classiication / detection rate
(Accuracy) TP TN
(
100%)
TP TN FP FN
+ ×
+ + +
Percentage of abnormalities and normal structures correctly classiied/detected.
Similarity
(
)
2 TP
100%
2 TP FN FP
× ×
× + +
Representation of the level of matching between the obtained results and the expected results (taken as true).
Precision (or Positive predictive
value) TP
(
100%)
TP+FP ×
Percentage of detected structures that are actually abnormalities.
Negative predictive value
(
)
TN
100% TN+FN ×