*e-mail: [email protected] Received: 20 January 2014 / Accepted: 15 October 2014
Impact evaluation of the geometry on measurements of solid
radioactive waste exposure rates in nuclear medicine
Cláudia Régio Brambilla*, Gabriela Hoff
Abstract Introduction: The objective of this paper is to verify the inl uence of the source geometry on Geiger Müller (GM) exposure rate data. This paper presents a validation of an application based on Monte Carlo (MC) data simulated using Geant4, based on a comparison of the exposure rates calculated via MC and Deterministic Calculations (DC) to experimental (measured) exposure rates. Methods: Experimental data that were collected through measurements of standard sources were used for MC and DC validation. In addition, the best method of analyzing the impact of the real source geometry on calculations of a descarpack box of radioactive waste
was verii ed. Furthermore, were estimated the exposure rates from a homogeneous solid waste box (used at clinical sites) and from a point source. These results were compared to coni rm possible discrepancies related to source geometry in exposure rates collected using a GM detector. Results: The investigated estimation methods were statistically compared; the MC presented higher agreement with the experimental data than did the deterministic calculations. The impact of considering a point source instead of the real geometry (descarpack
box) was an underestimation of between 20% and 70%, depending on the source – detector distance and the isotope evaluated. Conclusion: The DC always presented a higher difference with respect to the experimental data than did the MC calculation. The use of realistic geometry proved to exert a signii cant impact on the exposure rate data for solid radioactive waste compared with the exposure rate induced by a point source; the exposure rate estimation obtained using the real geometry was always at least 16% higher than the estimation obtained for a point source, and some differences greater than 50% were found.
Keywords Radioactive solid waste, Nuclear medicine, Exposure rate, Monte Carlo simulations.
Introduction
Radioactive waste management procedures have been established in a cooperative manner since 1957 by the International Atomic Energy Agency (IAEA). Several recommendations and guidelines have been published to protect individuals and the environment from radioactive emitters produced from a variety of sources, including medical applications (International…, 2005, 2006). The management of radioactive waste is achieved through several essential steps: pre-treatment, treatment, conditioning and disposal. Some elements of these management procedures include multiple steps of conditioning, labeling and transportation to a Radioactive Waste Management and Disposal Center (International…, 2006). Furthermore, it is important to maintain traceability through registration of the waste packages, including records of the exposure rate and dose rate at the surface of the package, the measurement date, and the estimated date of disposal (Comissão…, 1985; International…, 2006). In Brazil, the National Commission of Nuclear Energy (CNEN), which is comparable to similar administrative bodies in Portugal, Germany, Italy and other countries of the European Union, places limits on the disposal of radioactive waste in the solid state in accordance
with Brazilian law CNEN – NE – 6.05 (Comissão…, 1985). The limit for radioactive waste with low exposure rate levels, such as those characteristic of Nuclear Medicine (NM) applications, is up to 0.2 R/h for measured surface exposure rates (Comissão…, 1985; Rao, 2001), and an estimated activity of 2 µCi/ kg must be achieved before disposal (Comissão…, 1985; European…, 1999). To manage the procedures for solid radioactive waste storage and disposal, it is important to estimate the activity of each waste package based on exposure rate measurements using a specii c radiation detector.
The estimations of solid waste package activity are typically performed using a Geiger Müller (GM) detector with an area probe. The activity estimation that is performed at NM centers is typically based on a theoretical formula that is based on the relationship between the exposure rate (measured using the GM detector) and the activity. This formula considers a point-source exposure rate in units of R/h for 1 Ci of activity at 1 meter of distance, which is expressed as Γ, an exposure rate constant in units of Rm2/h.Ci
In Brazil, this measurement is performed at distances of 10 cm and/or 100 cm between the waste package surface and the surface of the detector.
The primary objective of this paper is to investigate the inluence of the source geometry on Geiger Müller (GM) exposure rate data. Any effect on the estimated activity will, in turn, affect solid radioactive waste management procedures. This paper presents a validation of a Monte Carlo (MC) application tool for dosimetric analysis in NM. As an example of its application, the impact of the geometrical point-source approximation on the estimated exposure rate produced by a source of 30.5 × 31.5 × 25.0 cm3 is considered.
This analysis can be performed by applying various numerical and analytical methods that produce approximate mathematical solutions, but such methods do not always yield suficiently accurate estimates of exposure/dose rates.
Methods
The exposure rates produced by solid radioactive waste package sources that are commonly used at NM centers were evaluated using a three-step methodology: (i) experimental measurements of the activities of various standard calibration sources, (ii) validation of deterministic and MC calculation methods, and (iii) exposure rate comparison between estimations considering a point source and a non-point source.
Experimental data collection
The GM detector that was used for data collection was a Victoreen model ASM990S manufactured by Fluke, with a model 491-40 area probe, which was well calibrated (Elimpex, 2012) for exposure rate measurements of standard sources. Barium-133 (133Ba),
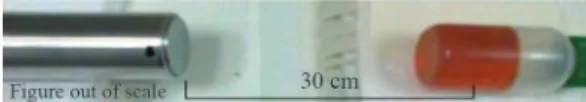
cobalt-57 (57Co) and cesium-137 (137Cs) standard sources from Eckert & Ziegler Isotope Products (Eckert…, 2012) are typically used for dose calibration quality control in NM. The experimental data were collected at a NM center in a low-background (BG) room, and the known background was subtracted from all measurements. The geometry for the experimental data collection is illustrated in Figure 1.
The data collection was performed with the center of the face of the GM detector centered on the base of the standard source, with a detector – source distance
of 30 cm. Thirty measurements were performed for each standard source, constituting 30 seconds of accumulated exposure (X) (Schwarcke et al., 2009). The exposure rate (Ẋ) was calculated based on Equation 1, presented below.
X X
t
=
(1)
The type A error (s) for the experimental data was considered (Equation 2), which represents the standard deviation (SD) around the mean of the collected data and is dependent on the sample size (N). The type B error (m) (Equation 3) was also considered, which represents the errors originating from the experimental system (both measurement equipment and methodology). The expanded error reported in the GM calibration certiication was 14%, and the error associated with the methodological measurement approach was estimated to be 3% (thus, for this research, m = 17%). Furthermore, the combined errors (CE) of both the A and B types (Equation 3) were used (Reichenbächer and Einax, 2011).
SD s
N
= (2)
2 2
CE= s +m (3)
Descriptive statistics were calculated for the collected data to evaluate the appropriate statistical tests to be applied to the experimental data distributions used in this research. The following parameters were calculated: the mean value; the median; the mode; the standard deviation; the sample variance; the kurtosis; the conidence interval for the mean at a level of 95% or 99%, depending on the statistical test used; and asymmetry indices (including Pearson’s). The asymmetry index (IAs), Pearson’s asymmetry index (AIPearson) and the kurtosis (C), were calculated
based on Equations 4 - 7. Pearson’s asymmetry index depends on the mean value (X), the mode (MO), the standard deviation (SD) and the variance (σ), as described in Equations 4 and 5. The asymmetry indexes and C were calculated by considering the relationship between the average of the measurements (X) and each of the measured values Xi as well as the total number of measurements (N). Equations 6 and 7 were used.
Pearson DP
X MO IA
SD
= − (4)
Pearson
X MO IA σ= −
σ (5)
(
)
(
)
3 1
s 3/ 2
2 1 1 1 N i i N i i X X N IA X X N − = − − ∑ ∑ − (6)
(
)
(
)
4 1 2 2 1 1 1 N i i N i i X X N C X X N − − − ∑ = ∑ − (7)All Pearson asymmetry indices were calculated and they indicated slight negativity values, however the Pearson SD is more suitable for the evaluation of sample groups we decided to show this value for the evaluation.
The experimental data distributions were analyzed using the Anderson - Darling, Cramér - von Mises, Kolmogorov - Smirnov, and Shapiro - Francia normality tests for a signiicance level of 0.01. All normality tests and descriptive analyses, with the exception of the kurtosis and asymmetry tests, were performed using the statistical tools available in the spreadsheet program Gnumeric (https://projects. gnome.org/gnumeric/).
The evaluation of proximity/equivalence between each studied model and the collected experimental data was accomplished through the use of Student’s t-test, statistical parametric tests, and the non-parametric tests Pearson chi-squared, chi-squared and Wald-Wolfowitz runs; all were evaluated for a signiicance level of 0.05. In this study, each value determined by each model was compared to the experimental data. Parametric tests were used to evaluate the differences in pairs of means between groups (Student’s t-test). Pearson’s chi-squared test assesses the proximity between measured data and the expected value; the chi-squared statistic assesses the equivalence between the measured data and the expected value by considering the error or variation associated with each value, including the expected error or variation (if possible). To assess the impact of the distribution of the data around the mean and the errors associated with experimental measurement, the chi-squared values were calculated considering several different variations. In the data analysis, both one SD and the combined error (CE) of the experimental measurements were considered. The statistical luctuations in the MC calculations were considered, whereas for the deterministic model (D), no luctuations or variations were considered. This difference between D and MC was not signiicant in this analysis because the contributions of SD and CE from the experimental data accounted for over 98% of the error associated with each measurement in all cases. Although the chi-squared test can assess the
proximity/relationship between curves and trends, this test is not sensitive to systematic variations in the data. To evaluate the distribution of the experimental data around the expected value for each model, the Wald - Wolfowitz test for randomness was also performed. This analysis allowed for the evaluation of the proximity of the data to the value predicted by each model while accounting for their distribution around that value.
Validation of deterministic and Monte Carlo methods
The validation was performed by comparing the experimental data with the results of the deterministic calculation method and the data simulated using the Geant4 MC tool (Agostinelli et al., 2003; Allison et al., 2006). The authors chose to use the Geant4 toolkit because it is widely used for various applications (Pia et al., 2012) and it has been validated for the transport of photons and electrons in the energy range relevant to this work (Batic, 2012, 2013; Lechner, 2009); this validation indicates that version 9.1.p03 is most accurate for the description of the transport process of interest in this study.
The detector characteristics for the modeling of the detector were obtained from the manual (Elimpex, 2012). The simpliied simulated GM detector model consisted of a cylinder with external dimensions of 1.35 cm in radius and 2.01 cm in length. The cover consisted of stainless steel with a thickness of 0.05 cm, according to Karaiskos et al. (1998). The internal active volume of 10.141 cm3 was also simulated as
a cylinder, with a radius of 1.30 cm and a height of 1.91 cm, consisting of pure neon (Ne) with a density of 8.385×10⁻¹ g/m3 under a pressure of 1.021 atm. The
standard sources (133Ba, 57Co and 137Cs) were simulated
with a cylindrical active volume of 20.5 cm3, with a
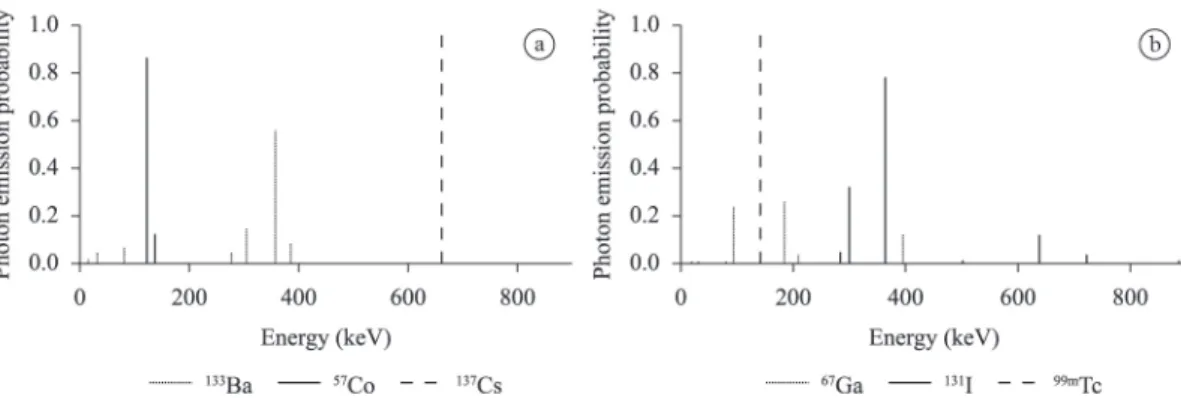
radius of 1.45 cm and a height of 3.1 cm. The self-absorption of the active epoxy matrix was modeled using an attenuation coeficient equivalent to that of water. Figure 2 presents the energy spectra of the standard sources and isotopes used in the routine clinical DC and MC estimations. These spectra were generated based on the NuDat2 database, which is available online from Brookhaven National Laboratory (Sonzogni, 2011). The spectra of the standard sources were used to validate the simulation data and the modeling of the GM (Bhat, 1998; Browne and Tuli, 2007; Khazov et al., 2011).
experimental measurement. The cross sections used to calculate photon attenuation in air were generated by the XCOM tool, based on the Photon Cross Sections Database published by the National Institute of Standards and Technology (NIST) (Berger et al., 2010). Equation 8 was used to calculate the number of photons arriving at the surface of the detector with the energy of interest (i.e., within a particular energy range), and the number of photons that reached the surface of the detector (I) after air attenuation (over the source - detector distance) was calculated based on the total number of photons emitted by the source (I0)
using the activity calculated from the nominal activity for the date of data collection, the mass attenuation coeficient (μ/ρ) in air in units of cm2/g, the density (ρ)
of air in units of g/cm3, the temperature and pressure
conditions reported by NIST (Berger et al., 2010), and the distance (x) between the center of the source and the surface of the detector, which was predeined to be 30 cm. The GM detector was used with the particle shield locked; therefore, particles were not considered in any phase of the study.
0
x
I I e
µ − ρρ
= (8)
In the DC method, the absorption of the wall of the GM detector was not considered, meaning that the radiation emitted by the source was considered to interact only with the air between the source and the detector and with the detector gas. However, the geometric correction factor accounted for the self-absorption of the source based on a model of a cylindrical source of radius r, using the relation presented in Equation 9 (Stabin, 2007), which gives the exposure rate in units of C/(kg per hour) at point h (m) from a source with an activity concentration (MBq/m3)
described by Cv. This expression also contains the exposure rate constant Γ [(C/kg).m2/MBq.h], the
source t (m) and its absorption coeficient μ (m-1),
as follows:
(
)
2 22
1 t ln
v
C r h
X = e
h
−µ +
π µ −
Γ (9)
The quantity µ/ρ can be used to calculate the energy and the energy (Eab) absorbed by the neon gas of the GM detector in units of keV based on the mass absorption attenuation coeficient (µ/ρ)ab,
which depends on the energy (hν) of the source, and the mass attenuation coeficient (µ/ρ) of the neon gas (density 8.39 × 10⁻¹ g/cm3), using Equation 10
(Almeida et al., 2009).
( / )
/ ab ab
E = νh µ ρ
µ ρ (10)
The mass attenuation coeficient for absorption was determined based on data released by the National Institute of Standards and Technology (Berger et al., 2010).
Finally, the exposure rate in units of mR/hr was determined based on the total energy absorbed in the detector, using the detector characteristics published by Weiss and Bernstein (1956), such as an active volume of 10.141 cm3 of gas and a We
pair value of
neon (Ne) of 35.3 eV/pair.
The MC method was implemented based on the Geant4 toolkit, version 9.1.p03. The cross section library standard was used to model radiation transport
in the simulated medium. The cutoff value chosen for the production of secondary particles was 0.01 mm for electrons and photons. The interval that was assigned to low power in the Geant4 code corresponded to energies between 990 eV and 100 GeV. The simulation considered the spectrum description, the compositions of the detector and source materials, and the distances and geometry described above.
Figure 2. Plots of the energy spectrum data from the standard sources (a) and the clinical sources (b) used in this work. (a) presents the
photon emission probabilities vs. energy for 133Ba (dot line), 57Co (continuous line) and 137Cs (segmented line), and (b) presents the photon
The quenching gas of the GM detector was not considered in the simulation because the purpose of this gas is to control cascade ionization detection and enable a decrease in the dead time of the detector. This extends the useful gas volume of the detector because the neutralizing effect of the quenching gas prevents constant ionization cascades in the detector (Knoll, 2010). Therefore, this factor does not directly affect the response of the dose absorbed in the detector generated through the ionization of the neon gas, which was the main gas used in this analysis.
The energy absorbed in the sensitive volume of the detector was simulated and then converted into an exposure rate.
The simulation results were normalized to the number of photons emitted from the source to represent the probability of photon energy absorption, which is speciic to the studied geometry.
Simulation of real geometries for
comparison to the exposure rate estimation for a point-source geometry
Using the GM detector modeling validated and described above, two distinct geometries were simulated: 1) a point-source geometry and 2) a box-source geometry (Descarpack, 2012). These two geometries were developed with the intent of assessing the impact of the geometry on the estimated exposure induced by a waste package of the type used in radioactive waste management, in a manner relevant to the geometries that are used in clinical practice at many nuclear medicine centers in Brazil. The sources implemented in the simulations had the same emission spectra as those presented in Figure 2.
The point source implemented in the Geant4 simulation tool was deined to produce isotropic emission and was positioned in the center of the simulated space (0, 0, 0). Several different cases were simulated for the point geometry, always with the point source centered within the descarpack volume (representing the emission source): (1) a distance of 10 cm between the surface of the detector and the center of the source; (2) a distance of 100 cm between the surface of the detector and the center of the source; and (3) a distance of 100 cm between the surface of the detector and the center of the source when measured parallel to the center axis, to represent the same distance as that in the case of the box-source geometry.
The descarpack box (descarpack, 2012) was simulated with dimensions of 30.5 × 31.5 × 25.0 cm3
and centered on the center of the simulated space. The photon emission was isotropically modeled. The simulated cases corresponding to the descarpack
box were all performed with the simulated box in the same position and with the activity of each isotope (radioisotope mixing was not considered) distributed homogeneously throughout the descarpack volume. To facilitate comparison, the same initial activity was simulated for both the point source and the source distributed throughout the descarpack volume.
The evaluation of the geometric effect was performed by normalizing the total absorbed energy with respect to the total number of photons emitted by the simulated source, both for the simulated energy absorbed from the descarpack source and for the simulated energy absorbed from the point source; therefore, any variation related to the detection characteristics and methodology was negligible in this analysis. For the simulations (with distances of 100 cm between the detector surface and the center of the descarpack box), 7 × 10⁹ iterations were run,
and the statistical luctuations represented a maximum level of 3%. The simulations were performed with the sensitive volumes centered on all box surfaces, and the same detection scenarios as those for the point source were used.
The relative impact of the geometry (IG), speciically the source geometry, as deined in Equation 11, represents the relationship between the probability of energy deposition in the detector by a photon emitted from the descarpack source, Prob_Eab [descarpack], and the probability of energy deposition
in the detector by a photon emitted from the point source, Prob_Eab [point], as described previously.
[
]
[
]
_ _ ab G
ab
Prob E descarpack I
Prob E point
= (11)
This study considered a homogeneous source distribution in the descarpack box and did not analyze the case of mixed radioisotopes. This preliminary study focused only on the simplest possible geometry and a single type of radioisotope in each waste package (the simplest practical case).
Results
Validation of Monte Carlo and deterministic calculations on experimental data
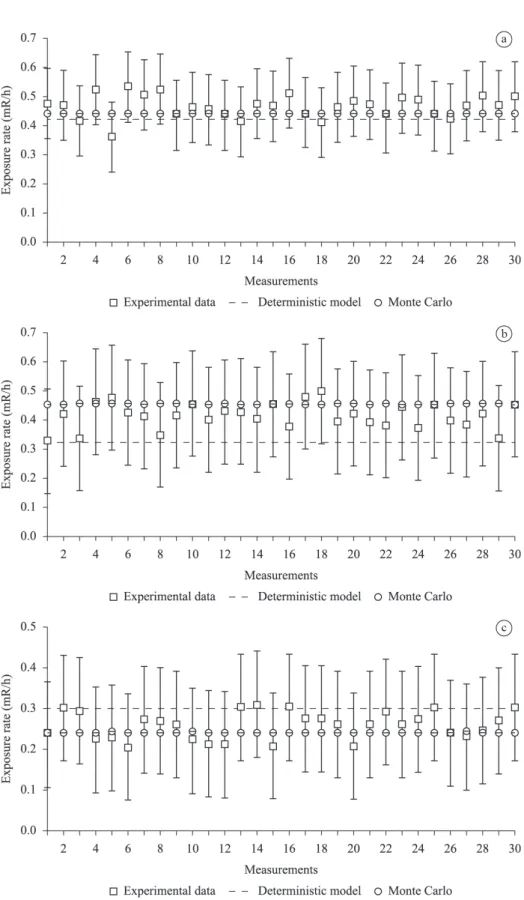
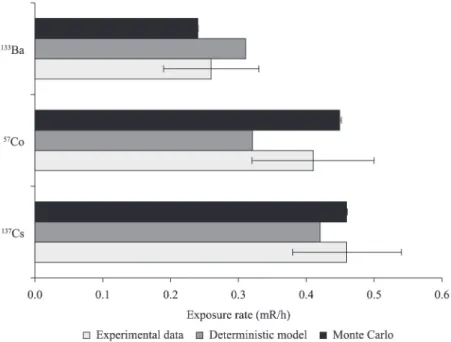
Figure 3 presents the results of comparing the average exposure rates from the experimental data, the DC and the MC simulations for several standard reference sources.
Figure 3. Data validation based on the distributions of exposure rate data collected using standard sources and a Geiger Müller tube area
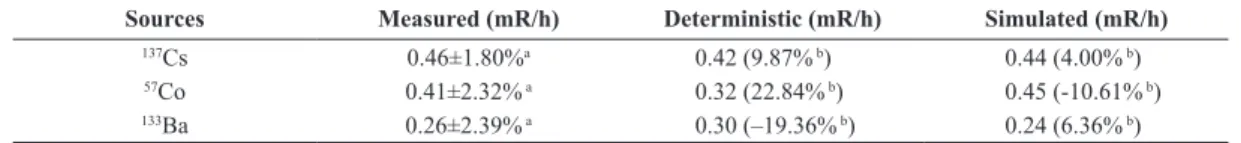
did the deterministic calculation for evaluating the averages. In comparison with the experimental data, the deterministic calculations exhibited greater discrepancy than did the simulated data. The results presented in Table 1 summarize the mean values of the experimentally measured exposure rates and their corresponding percentage standard deviations as well as the exposure rates estimated using each method and the corresponding percentage errors with respect to the experimental data (regarded as the “gold standard”).
The results presented in Table 1 reveal the similarity of the exposure rate data for the 137Cs source
obtained using both analysis methods (deterministic and simulated). This similarity arose because this type of source is typically used for the calibration of GM detectors and also features a range of nearly monoenergetic signals. It is known that GM detectors are strongly energy dependent; however, they are not suficiently sensitive that different correction factors can be determined and applied in different energy bands of the spectrum. Because of this characteristic, it is known that the exposure rates measured for polyenergetic spectra are less accurate than those for monoenergetic spectra relative to the expected exposure rate in the sensitive volume of the detector (the volume containing neon gas). For the other sources, 57Co and 133Ba, the MC simulations demonstrated
better performance than the DC. The larger error associated with the deterministic method relects the limitations of its estimation of the exposure rates in the neon gas, demonstrating the superiority of the MC method for situations in which complex event modeling of the interaction of radiation with matter is required, when the studied phenomenon involved polyenergetic signals. Additionally, it is shown in Figure 4 that the deviations of the MC simulation are negligible compared with the average values of the distributions and are always more similar to those of the experimental data (which exhibit larger deviations) than are the deterministically calculated deviations. Note that the variations produced by the MC method represent the modeling of intrinsic variations and
do not account for possible deviations in the input variables of the simulation (material compositions, cross sections, etc.)
Table 2 below presents the results of the descriptive analysis of the collected data as well as the statistical comparison of the measured data to the simulated and deterministic data, as described in the Methods section.
The results presented in Table 2 are characterized in terms of the type of analysis used based on the behavior of the sampling distributions for the sources:
137Cs, 57Co and 133Ba. The most sensitive test that was
employed for the analysis of normality in this study, although others were also applied and their results are presented, was the Anderson - Darling test, whose P value for all groups (with respect to the sources used in the experimental portion of the research) exhibited normal behavior with P > 0.05. Based on this inding, it was possible to compare the means of the groups, either determined from the distributions produced through MC simulations or deterministically calculated, with the group of experimental data for each of the standard sources used in this study using Student’s t-test. However, in the evaluation of the results of this test, it was found that for all estimated data sets in relation to the reference data (experimental data), all values of T were higher than the critical t. These results indicated that the groups of evaluated data were not statistically equivalent or similar to the data of the experimental distributions. Moreover, for all cases studied, the T values for the MC results were smaller than those for the deterministic results, implying less discrepancy with respect to the experimental data. In this case, the t-test did not provide suficient evidence for deinitive conclusions to be drawn from these distributions. Thus, an additional analysis using non-parametric tests was performed.
The Pearson chi-squared test was more sensitive than the t-test and was therefore discarded from this analysis. The chi-squared tests presented in Table 2 were performed using critical values of χ2 = 49.6 and
α = 0.01, both for the analysis based on the combined error and for the analysis based on 1 standard deviation.
Table 1. Average exposure rates from the measured data and the corresponding percent standard deviations (Measured (mR/h)), the exact
exposure rates determined through deterministic calculation and the corresponding percent deviations from the experimental averages (Deterministic (mR/h)), and the average values calculated via Monte Carlo and the corresponding percent deviations from the experimental averages (Simulated (mR/h)) for Geiger Müller validation.
Sources Measured (mR/h) Deterministic (mR/h) Simulated (mR/h)
137Cs 0.46±1.80%a 0.42 (9.87% b) 0.44 (4.00% b)
57Co 0.41±2.32% a 0.32 (22.84% b) 0.45 (-10.61% b)
133Ba 0.26±2.39% a 0.30 (–19.36% b) 0.24 (6.36% b)
aThe values following ± in the measured data represent the % standard deviations for measured data groups; bThe values between parentheses are
All values of χ2 for the combined error analysis
were lower than the critical value of χ2. These results
indicated that for the MC distributions, all simulations of the standard sources exhibited a strong relation to the experimentally measured distributions of these sources
(“gold standard” comparison validation). From analysis of the test data values for the deterministic method, it was evident that for the 57Co and 133Ba sources, the χ2
values were above the critical value, indicating that the deterministic calculation was not an appropriately
Table 2. Statistical data validation analysis.
137Cs 57Co 133Ba
Average 0.4642 0.4104 0.2580
Median 0.4686 0.4158 0.2604
Mode 0.4752 0.4188 0.2604
Standard Deviation 0.0395 0.0438 0.0339
Variance of the Sample 0.0016 0.0019 0.0012
99% CI to average 0.4443 0.3883 0.2410
Anderson - Darling – p value 0.779 0.858 0.073
Cramér - von Mises – p value 0.742 0.882 0.129
Kolmogorov - Smirnov – p value 0.445 0.929 0.242
Shapiro - Francia – p value 0.591 0.871 0.098
Pearson Asymmetry Index (AIPearson_SD) –0.280 –0.191 –0.070
Skewness Asymmetry Index (AIS) –0.376 –0.183 –0.166
Kurtosis 2.936 2.616 1.723
Exp-MC Exp-D Exp-MC Exp-D Exp-MC Exp-D
Student’s t-Test – Ta value 3.350 6.123 4.949 11.297 2.912 6.773
Student’s t-Test – p value 0.002 <0.001 <0.001 <0.001 0.007 <0.001
Student’s t-Test – difference between averages 0.024 0.044 0.039 0.090 0.018 0.042
Chi-Squaredb (CE) 9.401 14.730 27.250 53.470 19.130 58.850
Chi-Squaredb (1 SD) 40.190 65.500 53.450 166.600 19.130 73.490
Wald - Wolfowitz (Z) 0.624 0.896 0.913 Fail* –1.770 –1.541
Wald - Wolfowitz (cc Z) 0.846 1.315 –0.965 Fail* –0.976 –1.245
aFor a critical t of 2.045 (α=0.05); bFor a critical χ2 of 49.6 (α=0.01); cFor a critical Z of 1.96 (α=0.05). *For this distribution, all values of the
deterministic model were greater than the experimental reference data, corresponding to a single-run value that fails the test.
Figure 4. Data validation based on mean exposure rates and mean deviations obtained using standard sources and a Geiger Müller area probe
representative model for these distributions. Based on the standard deviations of the sample values, it was observed that for all standard sources, the values of χ2
exhibited signiicant discrepancies with respect to the critical value, and for the MC simulations, only one source (57Co) exhibited a value slightly higher than that of the comparison standard. Therefore, the MC simulation method was considered to be statistically validated. It was observed that the MC simulation was more accurate than the DC in representing the random phenomenon of radiation emission from these sources and the interaction of the radiation with matter.
The Wald - Wolfowitz Z test was also applied to assess whether the distributions of the samples exhibited random behavior or if they samples exhibited systematic variations (bias). A conidence interval of 95% was considered, implying α = 0.05 and a Z range of –1.96 to +1.96 (critical Z interval). By observing the Z values for all samples, it was concluded that in most cases, except in the comparison between the experimental data and the deterministic calculations (Exp-D) for 57Co, all models exhibited
no systematic variations outside the analysis range. It was also observed that for all distributions, the MC method yielded the best results in relation to the experimental patterns, again demonstrating that the MC modeling better reproduced the behavior of the realistic distributions and reinforcing the validation of the MC simulation method. The critical value of CCZ (Count Critical Z) was used and indicated better results for the MC simulations than for the DC compared to the experimental data. Notably, in one case (the 57Co source), the deterministic method failed entirely, producing calculated values that were all greater than the experimental values; this inding reinforced the conclusion that the best representation of the distribution of the exposure rate data was produced by the MC method.
Assessing the impact of geometry on the exposure rates calculated for a point source and for a typical waste package used in nuclear medicine
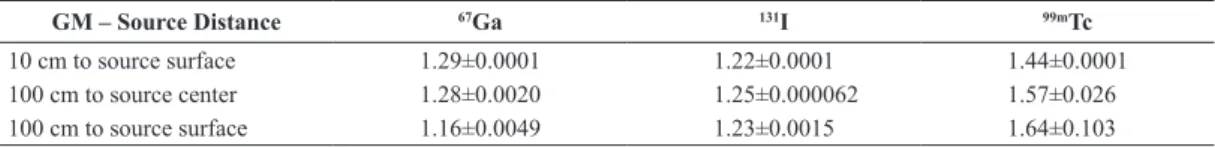
The results presented in Table 3 illustrate the impact of the source geometry on the estimation of the solid waste exposure rate.
When Equation 11 was applied, variations were identiied in the exposure rates of the waste package
relative to the exposure rates from a point source for isotopes that are routinely used in the practice of NM (Browne and Tuli, 2011; Junde et al., 2005; Khazov et al., 2006). Such variations were observed for all isotopes evaluated in this study and were especially prominent in the case of a waste package of 99mTc, the most widely used isotope in clinical
practice. The discrepancies between the values caused by the geometrical factor lay in a range of 20% to 70%; such discrepancies are suficiently large to potentially impact the estimated activity of a waste package for the management of radioactive waste and, consequently, the estimation of the storage time required for the waste to decay before its disposal.
For the purpose of the characterization/ identiication of waste packages, such measurements are important; as such, it is good practice to apply the necessary corrections to the estimations of quantities related to the radioactive decay of waste packages during routine operations.
Discussion
In this paper, a comparison was presented between the results of a method for deterministic calculation and the results of an MC tool (Geant4 version 9.1.p03 standard library for the description of physical models) to verify the accuracy of the results produced by each method. The MC simulation demonstrated a statistically signiicant reproduction of the experimental data. After the model was validated, the inluence of the source geometry on the measurement of the exposure rate produced by a nuclear medicine waste package was investigated. The approximation of the waste package (descarpack) as a point source was demonstrated to inluence the determination of the exposure rate. The differences between the results obtained using the point-source geometry and the real geometry ranged from 20% to 70% depending on the radioactive isotope and measurement distance (between the detector and the waste package), and the exposure rates estimated for the real geometry were always higher than those estimated for the point-source geometry. This increased rate can be attributed to the exposure to scattered radiation and the fact that the dimensions of the source box are larger than those of the detector itself, invalidating the point-source assumption. Another important factor to be considered
Table 3. Analysis of the effect of the source geometry on the estimation of the exposure rate produced by radioactive waste.
GM – Source Distance 67Ga 131I 99mTc
10 cm to source surface 1.29±0.0001 1.22±0.0001 1.44±0.0001
100 cm to source center 1.28±0.0020 1.25±0.000062 1.57±0.026
is the ratio of the inverse square of the distance. As the detector moves farther from a source of inite dimensions, the geometry approaches a point-source geometry. However, given the practical limitations of measurement (the activity to be estimated and the energies of the emitted spectra), it is impossible to perform measurements at a distance that would enable the descarpack to be treated as a point source.
Further work will be needed to evaluate the signiicance of these geometry-related discrepancies in estimates of waste package activities and the corresponding correction factors. The impact of different concentrations and mixtures of radioisotopes as well as non-homogeneities in the distributions thereof can also be evaluated using the MC method.
Acknowledgments
The authors would like to thank the Department of Nuclear Medicine and PET/CT of the Mãe de Deus Hospital, which enabled the experimental data collection. We would also like to thank the nano5 group and, in particular, Maria Grazia Pia, PhD, for the use of the cluster on which were run the Monte Carlo simulations presented in this work.
References
Agostinelli S, Allison J, Amako K, Apostolakis J, Araujo H, Arce P, Asai M, Axen D, Banerjee S, Barrand G, Behner F, Bellagamba L, Boudreau J, Broglia L, Brunengo A, Burkhardt H, Chauvie S, Chuma J, Chytracek R, Cooperman G, Cosmo G, Degtyarenko P, Dell’Acqua A, Depaola G, Dietrich D, Enami R, Feliciello A, Ferguson C, Fesefeldt H, Folger G, Foppiano F, Forti A, Garelli S, Giani S, Giannitrapani R, Gibin D, Cadenas JJG, Gonzalez I, Abril GG, Greeniaus G, Greiner W, Grichine V, Grossheim A, Guatelli S, Gumplinger P, Hamatsu R, Hashimoto K, Hasui H, Heikkinen A, Howard A, Ivanchenko V, Johnson A, Jones FW, Kallenbach J, Kanaya N, Kawabata M, Kawabata Y, Kawaguti M, Kelner S, Kent P, Kimura A, Kodama T, Kokoulin R, Kossov M, Kurashige H, Lamanna E, Lampen T, Lara V, Lefebure V, Lei F, Liendl M, Lockman W, Longo F, Magni S, Maire M, Medernach E, Minamimoto K, Freitas PM, Morita Y, Murakami K, Nagamatu M, Nartallo R, Nieminen P, Nishimura T, Ohtsubo K, Okamura M, O’Neale S, Oohata Y, Paech K, Perl J, Pfeiffer A, Pia MG, Ranjard F, Rybin A, Sadilov S, Di Salvo E, Santin G, Sasaki T, Savvas N, Sawada Y, Scherer S, Seil S, Sirotenko V, Smith D, Starkov N, Stoecker H, Sulkimo J, Takahata M, Tanaka S, Tcherniaev E, Tehrani ES, Tropeano M, Truscott P, Uno H, Urban L, Urban P, Verderi M, Walkden A, Wander W, Weber H, Wellisch JP, Wenaus T, Williams DC, Wright D, Yamada T, Yoshida H, Zschiesche D. Geant4-a simulation toolkit. Nuclear Instruments and Methods in Physics Research Section A: Accelerators, Spectrometers, Detectors and Associated Equipment. 2003; 506(3):250-303. http://dx.doi. org/10.1016/S0168-9002(03)01368-8.
Allison J, Amako K, Apostolakis J, Araujo H, Dubois PA, Asai M, Barrand G, Capra R. Chauvie S, Chytracek R, Cirrone GAP, Cooperman G, Cosmo G, Cuttone G, Daquino GG, Donszelmann M, Dressel M, Folger G, Foppiano F, Generowicz J, Grichine V, Guatelli S, Gumplinger P, Heikkinen A, Hrivnacova I, Howard A, Incerti S, Ivanchenko V, Johnson T, Jones F, Koi T, Kokoulin R, Kossov M, Kurashige H, Lara V, Larsson S, Lei F, Link O, Longo F, Maire M, Mantero A, Mascialino B, McLaren I, Lorenzo PM, Minamimoto K, Murakami K, Nieminen P, Pandola L, Parlati S, Peralta L, Perl J, Pfeiffer A, Pia MG, Ribon A, Rodrigues P, Russo G, Sadilov S, Santin G, Sasaki T, Smith D, Starkov N, Tanaka S, Tcherniaev E, Tome B, Trindade A, Truscott P, Urban L, Verderi M, Walkden A, Wellisch JP, Williams DC, Wright D, Yoshida H. Geant4 developments and applications. IEEE Transactions on Nuclear Science. 2006; 53(1):270-8. http://dx.doi.org/10.1109/TNS.2006.869826.
Almeida JN, Terini RA, Herdade SB. Determinação experimental de coeicientes de atenuação de BR-12 através de espectrometria de fótons. In: Anais do XIV Congresso Brasileiro de Física Médica; 2009; São Paulo, Brasil. São Paulo: Associação Brasileira de Física Médica (ABFM); 2009.
Batic M, Hoff G, Pia MG, Saracco P. Photon elastic scattering simulation: validation and improvements to Geant4. IEEE Transactions on Nuclear Science. 2012; 59(4):1636-64. http://dx.doi.org/10.1109/TNS.2012.2203609.
Batic M, Hoff G, Pia MG, Saracco P. Weidenspointner G. Validation of Geant4 simulation of electron energy deposition. IEEE Transactions on Nuclear Science. 2013; 60(4):2934-57. http://dx.doi.org/10.1109/TNS.2013.2272404.
Berger MJ, Hubbell JH, Seltzer SM, Chang J, Coursey JS, Sukumar R, Zucker DS, Olsen K. XCOM: Photon Cross section Database (version 1.5) [Internet]. Gaithersburg: National Institute of Standards and Technology; 2010. [access in 2013 Nov 15]. Available from: http://physics. nist.gov/xcom.
Bhat MR. Nuclear Data Sheets 85 - 415 [Internet]. 1998. [access in 2013 Nov 15]. Available from: http://www.nndc. bnl.gov/nudat2/decaysearchdirect.jsp?nuc=57CO&unc=nds. Browne E, Tuli JK. Nuclear Data Sheets 108 - 2173 [Internet]. 2007. [access in 2013 Nov 15]. Available from: http://www.nndc.bnl.gov/nudat2/decaysearchdirect. jsp?nuc=137CS&unc=nds.
Browne E, Tuli JK. Nuclear Data Sheets 112-275 [Internet]. 2011. [access in 2013 Nov 15]. Available at: http://www.nndc. bnl.gov/nudat2/decaysearchdirect.jsp?nuc=99TC&unc=nds. Comissão Nacional de Energia Nuclear – CNEN. Gerência de Rejeitos Radioativos em Instalações Radiativas - CNEN-NE-6.05 [Internet]. 1985. [access in 2013 Nov 15]. Available from: http://www.cnen.gov.br/seguranca/normas/pdf/ Nrm605.pdf.
Eckert & Ziegler. Eckert & Ziegler Isotope Products. Medical imaging sources: product information [Internet]. [access in 2013 Nov 15]. Available from: www.isotopeproducts.com. Elimpex. Survey Meters 491-40 Utility 1R GM Probe [Internet]. [access in 2013 Nov 15]. Available from: www. elimpex.com/products/survey_meters/491-40/491-40.html. European Commission – EUR. Management of radioactive waste arising from medical establishments in the European Union. In: Proceedings of a workshop by the Directorate-General for the Environment, Unit C.2; 1999 Feb 16-17; Brussels, Belgium. Brussels: European Commission; 1999. p. 1-118.
International Atomic Energy Agency – IAEA. Management of waste from the use of radioactive material in medicine, industry – agriculture - research and education safety guide [Internet]. Vienna: IAEA; 2005. [access in 2013 Nov 15]. Available from: http://www-pub.IAEA.org/MTCD/ publications/PDF/Pub1138_scr.pdf.
International Atomic Energy Agency – IAEA. Storage of radioactive waste. Safety Guide No. WS-G-6.1. Vienna: IAEA; 2006.
Junde H, Xiaolong H, Tuli JK. Nuclear Data Sheets 106 - 159 [Internet]. 2005. [access in 2013 Nov 15]. Available from: http://www.nndc.bnl.gov/nudat2/decaysearchdirect. jsp?nuc=67GA&unc=nds.
Karaiskos P, Angelopoulos A, Sakelliou L, Sandilos P, Antypas C, Vlachos L, Koutsouveli E. Monte Carlo and TLD dosimetry of an 192Ir high dose-rate brachytherapy source. Medical Physics.1998; 25(10):1975-84. http://dx.doi.
org/10.1118/1.598371. PMid:9800706
Khazov YU, Mitropolsky I, RodioNov A. Nuclear Data Sheets1072715 [Internet]. 2006. [access in 2013 Nov 15]. Available from: http://www.nndc.bnl.gov/nudat2/ decaysearchdirect.jsp?nuc=131I&unc=nds.
Khazov YU, RodioNov A, Kondev FG. Nuclear Data Sheets 112 – 855 [Internet]. 2011. [access in 2013 Nov 15]. Available from:http://www.nndc.bnl.gov/nudat2/decaysearchdirect. jsp?nuc=133BA&unc=nds.
Knoll GF. Radiation detection and measurement. 4th ed. USA: John Wiley & Sons; 2010.
Lechner A, Pia MG, Sudhakar M. Validation of Geant4 low energy electromagnetic processes against precision measurements of electron energy deposit. IEEE Transactions on Nuclear Science. 2009; 56(2):398-416. http://dx.doi. org/10.1109/TNS.2009.2013858.
Pia MG, Basaglia T, Bell ZW. Publication patterns in HEP computing. [Internet]. 2012. [access in 2013 Nov 15]. Available from: http://arxiv.org/abs/1209.5994.
Rao KR. Radioactive waste: the problem and its management. Current Science [internet]. 2001 Dec [access in 2013 Nov 15]; 81(12):1534-46. Available from: http://www.iisc.ernet. in/currsci/dec252001/1534.pdf.
Reichenbächer M, Einax JW. Types of errors in instrumental analysis. In: Reichenbächer M, Einax JW, editors. Challenges in analytical quality assurance. New York: Springer-Verlag Berlin Heidelberg; 2011. p. 7-35. http://dx.doi. org/10.1007/978-3-642-16595-5_2.
Schwarcke MMB, Cardoso DD, Ferreira NM. Comparação entre detectores utilizados para medidas ambientais em serviços de medicina nuclear. Revista Militar de Ciência e Tecnologia. 2009; 26-32.
Sonzogni A. NuDat 2 database manager and web programming. [Internet]. 2011. [access in 2013 Nov 15]. Available at: http://www.nndc.bnl.gov/nudat2/chartNuc.jsp. Stabin ME. Radiation protection and dosimetry: an introduction to health physics. Nova Iorque: Springer; 2007. Weiss J, Bernstein W. Energy required to produce one ion pair in several noble gases. Physical Review. 1956; 103(5):1253. http://dx.doi.org/10.1103/PhysRev.103.1253.
Authors
Cláudia Régio Brambilla*, Gabriela Hoff
Faculdade de Física – GESiC, Pontifícia Universidade Católica do Rio Grande do Sul – PUCRS, Av. Ipiranga, 6681, Prédio 10, Partenon, CEP 91619-900, Porto Alegre, RS, Brasil.
Cláudia Régio Brambilla