Olinda do Carmo LuizI,II
Luiza Sterman HeimannIII
Roberta Cristina BoarettoIII
Adriana Galvão PachecoIII
Umberto Catarino PessotoIII
Lauro Cesar IbanhesIII
Iracema Ester do Nascimento CastroIII
Jorge KayanoI,IV
Virginia JunqueiraIII
Jucilene Leite da RochaIII
Carlos Tato CortizoIII
Emílio Telesi JuniorIII
I Centro de Estudos de Saúde Coletiva. Faculdade de Medicina do ABC. Santo André, SP, Brasil
II Departamento de Medicina Preventiva. Faculdade de Medicina. Universidade de São Paulo. São Paulo, SP, Brasil III Núcleo de Investigação em Serviços e
Sistemas de Saúde. Instituto de Saúde. Secretaria de Estado da Saúde de São Paulo. São Paulo, SP, Brasil
IV Instituto Polis. São Paulo, SP, Brasil Correspondence:
Olinda do Carmo Luiz R. Santo Antônio, 590 – 4º andar 01314-000 São Paulo, SP, Brasil E-mail: [email protected] Received: 9/6/2007 Revised: 4/29/2008 Approved: 6/11/2008
Differences in the living conditions
and health between cities
ABSTRACT
OBJECTIVE: To describe an index to identify inequities in living conditions and health and its relationship with health planning.
METHODS: Variables and indicators that would reflect demographic, economic, environment and education processes as well as supply and production of health services were applied for nondimensional scaling and clustering of 5,507 Brazilian municipalities. Data sources were the 2000 Census and the Brazilian Ministry of Health information systems. Z-score test statistic and cluster analysis were performed allowing to defi ning 4 groups of municipalities by living conditions.
RESULTS: There was seen a polarization between the group with the best living conditions and health (Group 1) and the group with the worst living conditions (Group 4). Group 1 consisted of municipalities with larger populations while Group 4 comprised mainly the smallest municipalities. As for Brazilian macroregions, municipalities in Group 1 are clustered in the south and southeast and those in Group 4 are in the Northeast.
CONCLUSIONS: The living conditions and health index comprises reality dimensions such as housing, environment and health which allows to identifying the most vulnerable municipalities and can provide input for setting priorities, and developing criteria for more equitable fi nancing and resource allocation.
DESCRIPTORS: Indicators of Quality of Life. Socioeconomic Factors. Health Services Accessibility. Health Inequalities. Social Conditions. Health Services Epidemiology. Single Health System.
INTRODUCTION
In Brazil, inequalities are well-known. These are differences that are socially expressed between segments of the population with different purchasing power. They are geographically manifested in the disparity between regions and also wi-thin the major municipalities. As a result, social inequalities throughout history, they are made evident in the lack of access and the inappropriate organization of activities and services in general, and specifi cally in the health sector.
Structural determinants result in different epidemiological profi les and patterns of consumption of goods and services, in accordance with the living conditions of the population groups. Besides health indicators, these differences are also expressed by means of the general living conditions.
adminis-trative and political powers of the health services that
has consequences for the planning process.8
Recognizing and detailing social inequalities, especially in health, are the fi rst step towards planning with the purpose of reaching equity. Equity is understood to be not only a set of measures capable of guaranteeing universal access to health, but a principle of social justice, which makes it possible to have a universal
and comprehensive healthcare.5
Attempts have been made to identify the heterogeneity in Brazil using synthetic indicators.5,9,10,aHowever, one of the main criticisms is the arbitrary selection of its components and the restricted approach to reality.4,6,9
Although much has been published in technical texts, books and congress annals, the construction of synthetic indices as a form of recognizing social inequality is not expressive in scientifi c articles in indexed journals. Therefore, it is necessary to systematize and publish studies that deal with the problem.
The objective of the present article was to describe a new way of recognizing the inequality in living conditions and health and their relation to health planning. As a contri-bution to the living conditions and health index (ICVS), an attempt is made to overcome the limitations of the traditional synthetic indices by identifying new scenarios and constructing indicators that offer information that will be useful for subsidize policy formulation.
METHODS
The study is the product of the project, “Health Service Funding in Brazil and the Search for Equity”, which was
carried out in the period between 1999 and 2002.b
The fi rst step towards constructing the ICVS was the selection of the indicators that would refl ect the com-plexity of the health and sickness reality. To do so, as a theoretical framework, the proposal developed by
Castellanos was applied,2 according to which living
conditions express the way in which the population relate to one another in the general process of social organization. In order to recognize the living conditions, the author has considered four dimensions in the social reproduction process: economic, awareness and con-duct, ecological and biological. Each of these is expres-sed in a predominant way in a group of health problems, corresponding to a fi eld of social responses.
Sixteen indicators were identifi ed and classifi ed in accordance with the dimensions: demography; income;
supply and production of health services; environment and housing; and education.
The data source for obtaining the 16 indicators was the last national census of 2000. To guarantee methodolo-gical uniformity, the data obtained from the Database of the Brazilian National Health System (DATASUS) were also related to the year 2000, despite the fact that more recent data were available.
The second step was to scale the 16 indicators relative to the 5,507 Brazilian municipalities, by transforming the values of each indicator into the same scale to enable comparison and to establish the position of the muni-cipality in relation to the others. This option is similar to that for constructing the Human Development Index
(HDI),c which uses a non-dimensional scale from zero
to one, in which the highest value receives score one and the smallest value, zero.
After scaling the 16 indicators in this way, fi ve com-pound indicators were constructed, corresponding to the dimensions originally identifi ed from the theoretical framework: demography; income; supply and produc-tion of health services; environment and housing; and education.
The ICVS results from the arithmetic average of these fi ve indicators.
The third stage consisted in grouping the 5,507 munici-palities, according to the ICVS. To do so the following were carried out: z-score tests with the fi ve synthetic components; a frequency analysis; an internal varia-bility analysis and an analysis of the gains when the number of groups was increased; cluster analysis; and correlation and regression tests.
The 5,507 municipalities were distributed according to the clusters and population size.
RESULTS
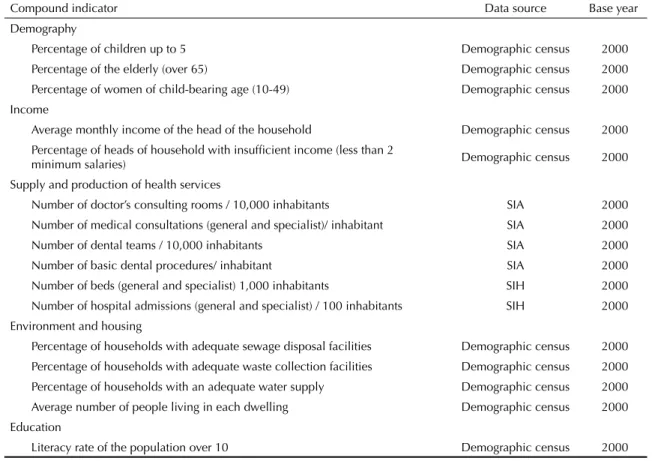
Table 1 shows the 16 indicators and the fi ve compound indicators created for the ICVS.
In defi ning the clusters the distribution curve of the municipalities, according to the ICVS, had a bimodal distribution. The smallest ICVS value was 0.022 in the municipality of Jordão, in the state of Acre, and the highest value was 0.880 in the municipality of Vitória, in the state of Espírito Santo.
Statistical analysis allowed four study groups to be defi ned:
a Kayano J, Caldas EL. Indicadores para o diálogo. São Paulo: Instituto Polis; 2002
Group 1 – Best living conditions – comprising 1,242 municipalities, with the best income, education and housing conditions. They are concentrated in the Southern region, in the state of São Paulo, in the south of the states of Minas Gerais and Rio de Janeiro and in some areas in the Central-West. A few are located in the North of the country.
Group 2 – Higher average living conditions – com-prising 1,895 municipalities with good health service indices, but with intermediate housing, education and income indices. They are located in the South (mainly in the State of Paraná), the Southeast (mainly in the mid-west region of the state of Minas Gerais, north of Rio de Janeiro and the state of Espírito Santo), a large part of Central-West (states of Goiás and Mato Grosso do Sul) and in some of the areas in the Northeast, but also very spread out in this region.
Group 3 – Lower average living conditions – There were 1,164 municipalities with low income and unsatisfactory health service and housing indices. They are mainly loca-ted in the North (states of Tocantins, Pará, Amapá, Rorai-ma and Rondônia), in areas of the Central-West (state of Mato Grosso) and sparsely spread across the Northeast and the northern part of the Southeast region.
Group 4 – Worst living conditions – Comprising 1,206 municipalities with the worst income, health service, housing and education indices. They are mainly located in the North (state of Acre and Amazonas) and throu-ghout the Northeast.
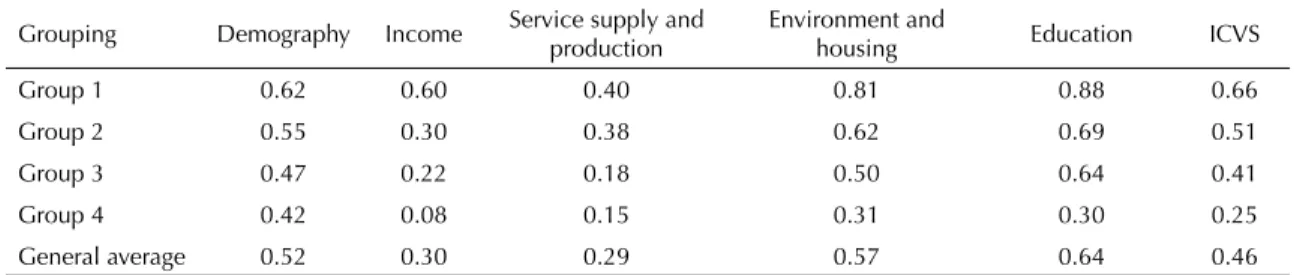
Table 2 shows the average of the components of the ICVS, in accordance with the four groups.
The Figure represents the geographic distribution of the 5,507 Brazilian municipalities in 2000, according to the four ICVS groups.
Table 3 describes the distribution of the Brazilian mu-nicipalities by population size and ICVS group.
In Group 1 (best living conditions) three quarters of the municipalities had fewer than 50,000 inhabitants. On the other hand, of the 193 municipalities with a population of between 100,000 and 500,000 inhabitants in Brazil, 142 are in this group. Likewise, of the 31 municipalities over 500,000 inhabitants, 29 were in the best living conditions group. This group was marked by the concentration of larger municipalities.
Group 2 (higher average living conditions) had a population size distribution that was similar to that
Table 1. Indicators of components related to the defi nition of the ICVS in Brazilian municipalities. Brazil 2000.
Compound indicator Data source Base year
Demography
Percentage of children up to 5 Demographic census 2000
Percentage of the elderly (over 65) Demographic census 2000
Percentage of women of child-bearing age (10-49) Demographic census 2000 Income
Average monthly income of the head of the household Demographic census 2000 Percentage of heads of household with insuffi cient income (less than 2
minimum salaries) Demographic census 2000
Supply and production of health services
Number of doctor’s consulting rooms / 10,000 inhabitants SIA 2000
Number of medical consultations (general and specialist)/ inhabitant SIA 2000
Number of dental teams / 10,000 inhabitants SIA 2000
Number of basic dental procedures/ inhabitant SIA 2000
Number of beds (general and specialist) 1,000 inhabitants SIH 2000
Number of hospital admissions (general and specialist) / 100 inhabitants SIH 2000 Environment and housing
Percentage of households with adequate sewage disposal facilities Demographic census 2000 Percentage of households with adequate waste collection facilities Demographic census 2000 Percentage of households with an adequate water supply Demographic census 2000 Average number of people living in each dwelling Demographic census 2000 Education
Literacy rate of the population over 10 Demographic census 2000
of Group 1. It differed from the rest because most of its municipalities had between 50,000 and 500,000 inhabitants.
Groups 3 and 4 (lower average and worst living conditions) were similar in their population sizes. However, in Group 3, 1% of the municipalities had between 100,000 and 500,000 inhabitants and in Group 4 almost all the municipalities had fewer than 50,000 inhabitants (97.5%), with no municipality having more than 100,000 inhabitants.
The Figure shows the distribution of the ICVS across Brazil. In the North, municipalities in Groups 3 and 4 predominate (72.6%).In the Northeast 74.8% of the municipalities are in these same groups. The North and Northeast regions differed mainly with regard to Group 1, with the North having 3.6% of the municipalities and the Northeast just 1%.
Comparing the percentages of municipalities classifi ed in Groups 1 and 2 with Groups 3 and 4, a hierarchy from the South to the Southeast and then to the Central-West can be observed. However, there are no municipalities in the Central-West region in the worst living condi-tions group, while 4.6% of the municipalities in the Southeast form part of it, which indicates there is great heterogeneity in this region.
DISCUSSION
From the mid-20th century, the use of indicators that would enable to measure the socioeconomic develo-pment of nations became popular. At that time, these indicators were essentially used for economic quan-tifi cation. The most prominent indicator that became universally known as the growth measure of countries
was the GDP (Gross Domestic Product) per capita,
which relates the dimensions of the economy with those
Table 2. Average scaled scores of the compound indicators that comprise the living conditions and health index, by group. Brazil, 2000.
Grouping Demography Income Service supply and production Environment and housing Education ICVS
Group 1 0.62 0.60 0.40 0.81 0.88 0.66
Group 2 0.55 0.30 0.38 0.62 0.69 0.51
Group 3 0.47 0.22 0.18 0.50 0.64 0.41
Group 4 0.42 0.08 0.15 0.31 0.30 0.25
General average 0.52 0.30 0.29 0.57 0.64 0.46
Table 3. Number of municipalities and percentage according to population size and living conditions and health index groups. Brazil, 2000.
Grouping
Population size
Up to 10.000 From 10,001 to 50,000 De 50.001 to 100.000 De 100.001 to 500.000 Over 50,000 Total
1
Municipalities 414 510 147 142 29 1.242
% line 33.3 41.1 11.8 11.4 2.3 100.0
% column 15.7 21.7 48.8 73.6 93.5 22.6
2
Municipalities 943 828 83 39 2 1.895
% line 49.8 43.7 4.4 2.1 0.1 100.0
% column 35.8 35.3 27.6 20.2 6.5 34.4
3
Municipalities 762 350 40 12 1.164
% line 65.5 30.1 3.4 1.0 100.0
% column 28.9 14.9 13.3 6.2 21.1
4
Municipalities 518 657 31 1.206
% line 43.0 54.5 2.6 100.0
% column 19.6 28.0 10.3 21.9
Total
Municipalities 2637 2345 301 193 31 5.507
% line 47.9 42.6 5.5 3.5 0.6 100.0
of demography; these dimensions are recognized as an
integral part of the development process.a
These measures are currently called fi rst generation indicators,5 which started recognizing aspects related to development, the human factor and the environment in order to reach the intended growth. In 1954, the United Nations suggested that measuring well-being should not be based exclusively on economic indicators, but on multiple components that together would constitute the level of life of an individual or a population.7
Thus, it became necessary to construct synthetic indi-ces based on broader concepts than economic growth and the demographic dynamic. With this debate the dimensions of poverty, conditions and quality of life and socioeconomic conditions became integrated,
considering that each one of the dimensions deals with a different concept of development.
Construction of such indices includes, therefore, va-rious dimensions of human life that, depending on the objectives and value judgment they carry, represent the satisfaction of basic needs; needs created by the degree of economic and social development of a par-ticular society.6
The use of synthetic indices is indicated by various authors as a way of overcoming the idea of poverty exclusively as insuffi cient income. It has opened up to a plurality of perspectives, proving to be a path for infl uencing the formulation of public policies and constituting conditions for ways to settle indicated differences.1,3,9
a Guimarães JRS, Jannuzzi PM. Indicadores sintéticos no processo de formulação e avaliação de políticas públicas: limites e legitimidades. In: Anais do XIV Encontro Nacional de Estudos Populacionais; 2004 set 20-24; Caxambu, BR. Caxambu: Associação Brasileira de Empresas de Pesquisa; 2004. [cited 2007 Aug] Available from: http://www.abep.nepo.unicamp.br/site_eventos_abep/PDF/ABEP2004_296.pdf
Figure. Distribution of Brazilian municipalities according to living conditions and health index groups. Brazil, 2000. Higher average living conditions group
Among the indicators of this nature, the one that gained most prominence was the Human Development Index (HDI), which was created in 1990 for the United
Na-tions Development Program (UNDP).a
The HDI calculation includes the variables health/life expectancy, education and income and is obtained from four indicators. In Brazil, the HDI has been calculated since 1998 and has received countless criticisms over the years. The main one is the arbitrary selection of the indicators and the weights used, as well as the simpli-fi ed calculation that attributes an equal relation to the chosen dimensions. Another criticism is that when it is applied to more restricted geographical limits, the rankings produced differ little from those of income.6 In the case of Brazil, the most important dimension refers to income distribution, because the HDI is incapable of measuring the poverty of a territory related to income concentration, since it takes the average income of a certain geographic area as an indicator; it is also very sensitive to variations in currency value.b Other ques-tions raised about the scope of the HDI also highlight the absence of recognizably important dimensions, such
as housing and the environment.4
Nevertheless, the advantages of the HDI are more related to its concept. Initially, it signals progress that is not exclusively economic and is based on the notion of capabilities, considering that the dimensions of education, health and income are states that allow capabilities to expand, or “inversely, the limitation of these dimensions would be an obstacle to the full realization of human potential”.6
Besides the HDI, other synthetic indices were develo-ped, but they maintained the proposal to present sum-marized measures of human conditions with the aim of using them as the basis for formulating and evaluating public policies in Brazil. In general, such indices try to be an alternative, which is either more comprehensive or more focused than the HDI.
In their formulation synthetic indices take various concepts of human development from the HDI and contain a variety of understandings on “socio-economic performance”, “quality of life”, “living conditions”, “poverty” among others.9,c,d,e,f
However, the HDI is still the most widely used synthetic index, on which all the others are based, whether in their construction or in their criticism.
The ICVS proposed in the present study uses a similar methodology to that of the HDI, the only difference being that it tries to be more specifi c with regard to its application to health.
The selection of indicators started with a structured theoretical framework, therefore it was not arbitrary. It also avoids the problem of measuring the economic di-mension by per capita income, since it uses the average monthly income of the head of the household and the percentage of heads of household with insuffi cient inco-me (below two minimum salaries). This is how the ICVS takes into account income concentration in Brazil.
The ICVS is a broader indicator than other synthetics indices, since it incorporates other dimensions of reality, like housing, the environment and health. It is therefore more suitable for supporting health planning. The use of 16 indicators allowed for greater discrimination of the living and health conditions of Brazilian municipalities when compared with the HDI, which works with just four components. With its greater descriptive capacity it is possible to construct different groups of municipa-lities by analyzing the clusters. Furthermore, the greater number of indicators made it possible to internally characterize the groups, based on the differences of the components (compound indicators) of the ICVS. In this way there are municipalities with the same ICVS end value in different groups (Table 1).
Another advantage of the ICVS is use of data from available information systems, in addition to census data, which allows for more frequent updating during inter-census periods. This makes it possible to follow and monitor essential changes for planning and mana-gement purposes.
In identifying more vulnerable municipalities the ICVS bases its defi nition of priorities on the action of the health manager. It can also establish criteria for fi nancing and passing on funds in a more equitable allocation: “The study of inequalities in health has been important, not only for helping in understanding the
a Programa das Nações Unidas para o Desenvolvimento, Instituto de Pesquisa Econômica Aplicada. Atlas do Desenvolvimento Humano no Brasil. Brasília; 1998. (CD-ROM)
b Machado AF, Andrade MV, Albuquerque EM. Atraso tecnológico, atraso social: uma investigação sobre as relações entre produção científi co-tecnológica e desenvolvimento humano no Brasil. Belo Horizonte: Centro de Desenvolvimento e Planejamento Regional da UFMG; 2003. (Texto para discussão, 197).
c Haddad PR, Bonelli R, coordenadores. Desenvolvimento humano e condições de vida: indicadores brasileiros. Brasília: Programa das Nações Unidas para o Desenvolvimento/ Instituto de Pesquisa Econômica Aplicada / Fundação João Pinheiro /Instituto Brasileiro de Geografi a e Estatística; 1998. (Coleção Desenvolvimento Humano).
d Barros RP, Carvalho M, Franco S. O Índice de Desenvolvimento da Família. Rio de janeiro: Instituto de Pesquisa Econômica Aplicada; 2003 [cited 2007 Feb 04]. (Texto para discussão, 986). Available from: http://www.ipea.gov.br/pub/td/2003/td_0986.pdf
e Rolim C. Um índice de pobreza humana municipal para o Brasil. In: Anais do III Encontro da Associação Brasileira de Estudos Regionais; 2004; Belo Horizonte, BR, Belo Horizonte: Associação Brasileira de Estudos Regionais; 2004. [cited Aug 2007] Available from: http://www.boletimdeconjuntura.ufpr.br/textos_discussao/texto_para_discussao_ano_2005_texto_17.pdf
complex process for determining illnesses, but above all it relates to the possibility of using this information for adopting health intervention strategies aimed at
extending equity in health”.10 Therefore, the ICVS can
serve as an example of the use of available databases and census information for preparing indicators that are capable of recording the inequality in health more accurately.
1. Akerman M. Examinando elementos que possam infl uenciar a formulação de políticas em estudos que utilizaram indicadores compostos: o chão contra o cifrão. CiencSaude Coletiva. 2000;5(1):115-23. DOI: 10.1590/S1413-81232000000100010
2. Castellanos PL. Proyecto: sistemas nacionales de vigilancia de la situación de salud según condiciones de vida y del impacto de las acciones de salud y bienestar. Washington: Organización Panamericana de la Salud; 1994.
3. Costa OV. Pesquisa de condições de vida. Sao Paulo
Perspec. 2003;17(3-4):142-50. DOI:
10.1590/S0102-88392003000300015
4. Ferreira SP. Produção e disponibilização de estatísticas: uma abordagem institucional. Sao Paulo
Perspec. 2003;17(3-4):17-25. DOI:
10.1590/S0102-88392003000300003
5. Luiz OC. Direitos e eqüidade: princípios éticos para a saúde. Arq Med ABC. 2005;30(2):69-75.
6. Minayo MCS, Hartz ZMA, Buss PM. Qualidade de vida e saúde: um debate necessário. Cienc Saude
Coletiva. 2000;5(1):7-18. DOI:
10.1590/S1413-81232000000100002
7. Organização das Nações Unidas. International Defi nition and Measurements of Standards and Levels of Living. New York: United Nations Publications; 1954.
8. Paim JS. Gestão da Atenção Básica nas cidades. In: Rassi Neto E, Bógus CM, organizadores. Saúde nos aglomerados urbanos: uma visão integrada. Brasília: Organização Pan-Americana da Saúde; 2003. (Série Técnica Projeto de Desenvolvimento de Sistemas e Serviços de Saúde, 3). p.183-212.
9. Pochmann M, Amorim R. Atlas da Exclusão Social no Brasil. 2.ed. São Paulo: Editora Cortez; 2003. 10. Silva LMV, Paim JS, Costa MCN. Desigualdades na
mortalidade, espaço e estratos sociais. Rev Saude
Publica. 1999;33(2):187-97. DOI:
10.1590/S0034-89101999000200011
REFERENCES