Short Report
Printed in Brazil - ©2017 Sociedade Brasileira de Química0103 - 5053 $6.00+0.00*e-mail: [email protected]
Assessment of Metabolism of the Eastern Oyster and Eastern Elliptio
Using NMR Spectroscopy
Haakil Lee*
Department of Chemical Engineering, Keimyung University, 1095 Dalgubeoldaero, 42601 Dalseo-Gu, Daegu, Korea
Metabolites are known to characterize the functional responses of a cell. Therefore, a quantitative measurement of metabolite profiles can provide insight into the underlying effect of genetic or environmental actions on cell metabolism. It follows then that the study of the metabolite profiles of bivalve mollusks, such as oysters, can be particularly worthwhile in assessing changes in physiology, pharmacology and toxicology that result from their adaptation to changing environments. We have determined the metabolic profiles of three different organ groups in freshwater mussel and oysters by using 1H (proton) and 13C (carbon) NMR (nuclear magnetic
resonance) spectroscopy following the infusion of 13C glucose or 13C glycine, respectively. The
result shows infused glucose formed glycogen by glycogen synthesis, alanine by glycolysis, and glutamate and aspartate through the Krebs cycle and glycine formed serine by the glycine cleavage system in oysters. Decrease in adenosine triphosphate (ATP), glucogen, putrescine and ornithine were observed in the fasting state freshwater mussel. Our result opens the possibility that organ specific metabolic fingerprints can be established to interpret functional adaptations to environmental and nutritional challenges using NMR spectroscopy.
Keywords: metabolite, oyster, molecular analysis, freshwater mussel
Introduction
Metabolites are small molecules serving as either intermediates or end products of metabolism. Thus, metabolites express the functional response of a living organism from external factors.1 The study of metabolites,
referred to as metabolomics, is a process requiring comprehensive quantification of molecules participating in the biosystem. Metabolome is the chemical profile of metabolites in the biological sample.2 Quantitative
or qualitative characterization of the metabolites can provide insight into the underlying mechanisms by which the genomic or environmental factors have effect
on the metabolism.3 The environment around mud
flats fluctuates constantly producing a vast diversity of physical and chemical challenges to organism living under these conditions. The study of the metabolic profile of those marine organisms could be particularly useful for understanding changes in physiology, pharmacology and toxicology.4 Organ specific metabolic fingerprints
can establish time dependent assessments necessary for
interpreting functional adaptations to environmental and nutritional challenges. Traditionally radioactive tracers have been used for such studies.5
Even though the sensitivity of nuclear magnetic resonance (NMR) spectroscopy and magnetic resonance imaging (MRI) techniques is relatively low as compared with other analytical techniques such as mass or chromatic spectrometer, NMR technique has been widely used since it permits quantitative and unbiased monitoring of the metabolome.6 The advance in NMR processing software to
interpret the results has been also vital for wide acceptance of NMR technique.7 Non-invasive imaging methods have
been investigated to measure anatomic traits and predict body composition in a variety of freshwater and marine species, including some bivalves, since the early 1990’s.8 As
an extension of MRI applications, we have shown that usage of MR spectroscopic imaging technique, also called chemical shift imaging (CSI), permits metabolic profiles to be generated in a conventional MR image format representing the various metabolites.9 As a part of our ongoing effort to
The oysters are an interesting model organism for tissue metabolism study since they are subject to the daily low and high tide cycle, which is thought to result in a hypoxia experience at low tide.4,11 Oysters also constitute
an useful model because (i) the oysters have well separated organs with certain functions resulting in distinct metabolic profiles, (ii) its organs are lipid-rich making them easily distinguishable with T2-weighted MRI, (iii) oysters are sessile creatures and easy to immobilize during data accumulation allowing long acquisition times for high resolution MRI images without image blurring effects.8 Its relatively few organs are easily delineated
in the MR image and there is sufficient understanding of their functions based on classical assays to support interpretation of NMR results. Typically metabolomic studies using NMR have been performed on tissue extracts using the most abundant and most sensitive
proton (1H) metabolites.12 However, metabolomic
perturbations to biosystems can also be easily detected using NMR active trace materials such as carbon-13 (13C). The use of these techniques are possible since the
background signal due to the natural abundance of 13C is
very small or negligible in most cases.13 Here we have
applied high-resolution 1H NMR methods to fresh water
bivalve Eastern Elliptio to investigate the variation in the metabolic profile of different organ groups after 3 days of fasting stress and 13C NMR methods to Eastern oyster
(Crassostrea virginica) to investigate the variation in the metabolic profile of different organ groups after infusing metabolically important NMR detectable stable isotopes, uniformly-labeled (U-13C)-glucose or 2-13C-glycine.2,14 In
a previous 1H NMR metabolomic study, we have shown
that betaine was the most abundant metabolite in all oyster tissues.9 Betaine is an important metabolite functioning
both as an osmolyte to protect against osmotic stress and a methyl group donor.9,15 Hence, glucose was chosen to
probe glycolysis and the Krebs cycle, while glycine was chosen to probe betaine, which is trimethylglycine, a catabolic product of glycine.14
Therefore, the major goal of this study was to establish baseline distributions of metabolites derived from U-13C-glucose and 2-13C-glycine over oyster tissues
by using 13C NMR measurement and to demonstrate the
feasibility of using NMR for that purpose. In addition,
we also performed the 1H NMR measurements on the
freshwater bivalve Eastern Elliptio (Elliptio complanata) which is not subject to a daily tidal cycle to measure the effect of 3 days fasting stress on metabolites. A biochemical schematic is also presented that relates metabolites to biochemical pathways correlated with physiological organ functions for oysters.
Experimental
Detailed oyster sample preparation procedures are described in our previous results.6 In short, Eastern oysters
(Crassostrea virginica) (50-70 g) were collected from Taylor Creek near Beaufort, NC, USA, and freshwater mussels (Elliptio complanata) were collected from the inland creek near Beaufort, NC, USA. After fasting for a day, oysters were transferred to a beaker containing 200 mL of water and the appropriate 13C labeled nutrients (5.5 mM 13C-glucose or 2.7 mM 2-13C-glycine, Cambridge Isotope
Lab., Andover, MA, USA) for 48 h prior to dissection. Aeration was provided with a 1/4 inch diameter Tygon (Aqueon Products, Franklin, WI, USA) tube inserted into each beaker bubbling room air lightly to avoid startling the oyster into closing. After the experiment, the oyster was quickly opened, and three organ blocks were dissected (muscle; gastrointestinal (GI) with digestive gland; and mantle with gills) rapidly and immediately frozen in liquid nitrogen. Each organ block was pulverized individually using a stainless steel mortar and pestle with constant addition of liquid nitrogen. The crushed organ block was then transferred to a polyethylene disposable centrifuge tube and weighed. For metabolite extraction, 8% perchloric acid was added 2-to-1 v:w (volume:weight) and the mixture vortexed for 1 min, before being stored overnight in a refrigerator (4 °C). The mixture was then centrifuged and the supernatant collected. The pH of the supernatant was adjusted with potassium hydroxide to alkaline pH between pH 7-7.4. The supernatant was then lyophilized and stored at −80 °C until MR spectroscopy analysis. Freshwater bivalve samples were also prepared in the similar method without assimilation period and they were used as baseline data, assuming as the fed state, against which to measure the change during fasting state. Fasting data was acquired after mussels were housed in 18 liter tanks, which were filled with the same water with aeration for 3 days. For NMR spectroscopy, the lyophilized powder from each of the organ blocks was dissolved in D2O with 0.2% deuterated
TSP (trimethylsilyl propanoic acid, referenced at 0.0 ppm in
1H spectrum). Proton spectra were acquired at 25 °C, using
a 16.4 T Varian Inova spectrometer (700 MHz 1H resonance
frequency) using the same acquisition and processing parameters as in previous study, with a 90° pulse flip angle, 1.5 second presaturation pulse on residual water, with 64 transients.9,16 The sweep width was 10 kHz and the number
(Advanced Chemistry Development, Inc. Toronto, Canada). The area of peak is proportional to the number of nuclei responsible for the peaks and NMR determination of peak area is a conventional and validated method for metabolic profiling.16,17 Peaks were assigned by comparing the
observed chemical shifts with reference spectra using the databases in the Human Metabolome Database (HMDB) and using Chenomx NMR Suite 8.2 (Chenomx, Edmonton, Alberta, Canada) and most of the chemical shift values were already reported in the previously results.9,16,17 The
14.1 T Varian Inova spectrometer equipped with a 5 mm
broadband NMR probe was used to acquire 13C NMR
spectra at 25 °C. The pulse and acquire sequence was used with WALTZ decoupling only during acquisition, a sweep width 32,000 Hz and 64,000 complex data points, a 2 second relaxation time, and the number of transients was 640. Peaks were assigned by comparing the observed chemical shifts with the results reported earlier.14,18
To perform a multivariate statistical analysis using the principal components analysis (PCA), NMR spectra were binned into buckets, reducing data size by grouping spectral responses.19 For the spectral data obtained from
fed-fasting study, the binning size was changed to 0.02 ppm using the Intelligent Bucketing option in ACD NMR processor to mitigate the possible misalignments. The feature chooses integral divisions based on local minima with the ability to adjust them by 50%, so that the bucket sizes could range from 0.01 to 0.03 ppm. In both cases, TSP (< 0.5 ppm), water (4.7-4.9 ppm) and > 9.5 ppm regions were excluded to further reduce the data size. The integral tables were normalized to a total sum equal to one. Data were moved to the SIMCA P+ software (Ver. 12, Umetrics, Umea, Sweden) where PCA on X-block was performed after Pareto scaling.
MR imaging and 13C-CSI were performed using a Varian
4.7T Inova MRI system (Varian, Inc., Palo Alto, CA, USA) with a 33 cm horizontal bore magnet equipped with a 20 cm inside diameter gradient coil insert with integrated shims (Resonance Research Inc, Billerica, MA, USA, Model BFG-300/200). The maximum gradient strength was 300 mT m-1. At this field strength, the resonance frequencies
of 1H and 13C were 200 and 50 MHz, respectively. MRI
method can acquire different contrast images by varying timing parameters in the sequences. In this example, the
1H MR images were collected using a multi-slice spin echo
sequence with TR/TE (time of repetition/time of echo) settings of 2,000 ms/30 ms, which is the ideal parameter set to acquire T2-weighted image.8 It was shown that the
T2-weighted imaging sequence produced an image with the most contrast between anatomically distinct regions. The field of view was 8 × 4 cm with 256 and 128 pixels acquired, producing 0.31 × 0.31 mm pixel resolution for each image. The slice thickness was 1 mm. The number of averages was two. Therefore the total image acquisition times were 512 seconds. Experimental conditions to acquire
13C CSI data are described in a previously published paper
with the exception that no slice selection gradient was applied.8 Since the main purpose of the 13C imaging was to
identify the spatial distribution of infused 13C compounds,
no slice selection was required and the resultant 13C image
was a projection image.
Results and Discussion
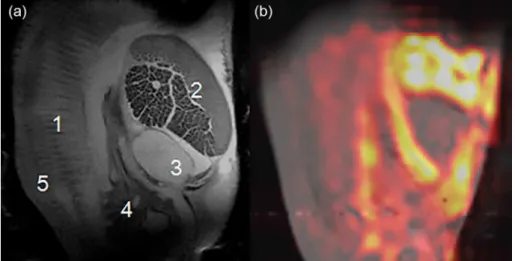
Figure 1 shows the results of an MR imaging study of an oyster. Figure 1a shows one slice out of a 12-slice
1H MRI acquisition, a caption for the internal organs is
also shown. Figure 1b is a composite image consisting of a
Figure 1. Magnetic resonance image of an oyster (a) T2-weighted 1H MR image of an oyster in a life support system. 1: gills; 2: adductor muscle and hemolymph
sinuses; 3: heart; 4: stomach; 5: mantle; (b) 13C MR image after exposure to U-13C-glucose, which shows the possibility of using MR to study the distribution
1H anatomical image and a 13C CSI image acquired following
the infusion to U-13C-glucose confirming the distribution of 13C compounds among different organs inside the oyster.
There is a slight mismatch between Figures 1a and 1b MR 1H image since Figure 1a is a selected image among
12 slice images to display the anatomical detail of oyster and Figure 1b is an image overlay of projection 1H and 13C
image. Considering the distribution of 13C compound shown
in Figure 1b, three different organ blocks were analyzed further by 1H and 13C NMR spectroscopy as described
in Experimental section: 1: mantle and gills; 2: adductor muscle; 3: stomach. This can be used as an environmental stress challenge assay to determine the health of organisms selected from various environments.
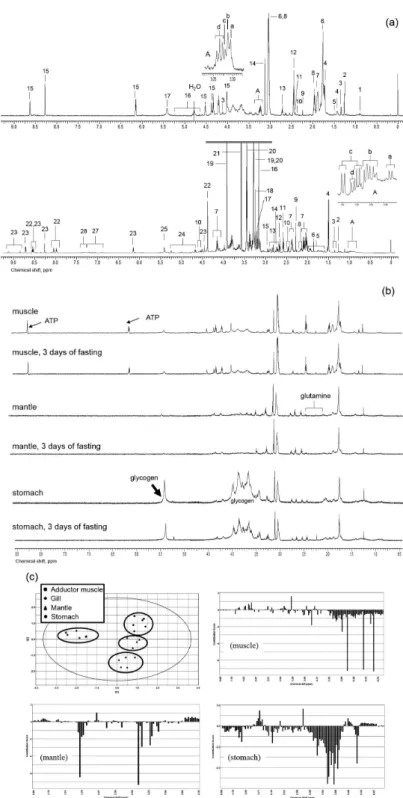
Figures 2a and 2b show the 1H NMR spectra from
an Eastern oyster and the Eastern Elliptio, respectively. Figure 2a shows spectra obtained from muscle tissue extracts. The top spectrum in Figure 2a is from the Eastern Elliptio and the bottom spectrum is from the Eastern oyster. As expected, the spectra show distinctive differences in metabolite concentrations between the two species. In Figure 2a, sections of the spectrum, noted as A, were expanded and identified for both Eastern Elliptio and Eastern oyster. Compared with the spectrum from the Eastern oyster, the freshwater bivalve shows a much simpler metabolic profile, at least under our sample extraction method. Most of the identification of peaks in Eastern oyster were detailed in the previous study and it can be also used as a reference for Eastern Elliptio.9 In addition
to the difference metabolite concentrations, there are many metabolites that are unique to the Eastern Elliptio, especially identified as putrescine (peak 6) and ornithine (peak 8), in Figure 2a.
Figure 2b shows the spectra of muscle, mantle and gill, and stomach from Eastern Elliptio and the spectra acquired after 3 days of fasting. The glycogen, polysaccharide of glucose and the main energy storage molecule, generate numerous overlapping and broad peaks, which co-resonate with other metabolite peaks between 3.25-5.40 ppm and could complicate spectral analysis around this region when the concentration is high as shown in the spectra from stomach in Figure 2b. Similar to the oyster, glycogen in the Elliptio is highly concentrated in the stomach as compared with either muscle or mantle tissue; however, the overall concentration of glycogen is much smaller when compared with oyster when referenced to the TPS.9 Also, adenosine triphosphate (ATP) is highly
concentrated in muscle, when compared with other tissue types. As with oyster 1H spectra, the number of peaks
observed in mantle and stomach are reduced compared with the one in muscle. There is a little variation in the signal to
noise ratios of the spectra reported in Figure 2b since the sample sizes were different, which was due to the quick sample preparation requirement to quench the metabolism that could change the metabolic profile. An accurate estimation of tissue-specific metabolic concentration requires accurate separation of organ blocks as rapidly as possible. Due to this limitation, the spectra were displayed scaled to the highest peak in Figure 2b. Figure 2c shows the score plot (PC1 vs. PC2) and confirms the differentiation between tissue types and the loading plot. The PCA score plot of the 1H spectra in Figure 2c reflects the metabolic
differences between tissue blocks especially the muscle compared with mantle, gills, and digestive gland/stomach. Also, there is a difference in metabolic profiles between gills and mantle in the PCA plot; however, it was not always possible to separate gills and mantle tissue cleanly because of the short sample preparation time needed in order to minimize possible metabolic change following the opening of the shell. Therefore we grouped together gills and mantle as one tissue block in the experiments and denoted as mantle in the report. More experience with the sample preparation could resolve this problem later. The loading plot shows the contributions of the measured metabolites to the separation of the spectra between fed and 3 day fasting state, which could identify the most important cumulative contributions of the loadings.20 The downward
bars denote the decrease of metabolites in the fasting state when compared with the normal fed state. From the loading plot in Figure 2c, in the muscle tissue the most prominent effect of the fasting for 3 days in the Eastern Elliptio is a decrease in the ATP, which could be identified as three downward bars at 6.13, 8.24 and 8.53 ppm.21 It should be
noted that the spectra are from different samples since the destructive nature of extraction sample preparation for NMR does not permit the longitudinal study using the same sample. In mantle tissue, there were significant decreases in putrescine and ornithine in the fasting state, potentially suggesting these metabolites participate in the maintenance of energy supply in this specific tissue.22 In
the stomach tissue block, there was a significant decrease in glycogen, confirmed by the downward bars between 3.25-5.40 ppm. It suggests the occurrence of glycogenolysis to meet the energy and metabolic requirement under fasting condition.23 Longer fasting period could show more subtle
difference.24
When comparing the spectra from the previous oyster result, the evolutionary effects caused by the primary differencein the aqueous environments (salinity and tidal cycle) was delineated by the major metabolites in the two organisms.9 In the salt water oyster, osmolytes dominated
Figure 2. Proton NMR spectra from Eastern oyster and Eastern Elliptio and PCA plot of tissue blocks. (a) Spectra from Eastern Elliptio (top) and Eastern oyster (bottom). List of peaks identified in the 1H NMR spectrum of muscle blocks of Eastern Elliptio (a, top): (1) isovalerate, (2) 3-hydroxyisovalerate,
(3) lactate, (4) cadaverine, (5) alanine, (6) putrescine, (7) arginine, (8) ornithine, (9) acetoacetate, (10) glutamate, (11) succinate, (12) oxoglutarate, (13) 4-aminobutanal, (14) malonate; region A: (a) choline, (b) phosphocholine, (c) glycerophosphocholine, (d) arginine; (15) ATP (coincident with ADP/AMP), (16) glucose, (17) glycogen. List of peaks identified in the 1H NMR spectrum of muscle blocks of Eastern oyster (a, bottom): region A:
(a) isovalerate, (b) leucine, (c) valine, (d) isoleucine; (2) 3-hydroxyisovalerate, (3) threonine, (4) alanine, (5) arginine, (6) 13C acetate used a reference
in 13C NMR spectroscopy, (7) proline, (8) glutamate, (9) acetoacetate, (10) carnitine, (11) β-alanine, (12) hypotaurine, (13) aspartate, (14) sarcosine,
(15) dimethylglycine, (16) malonate, (17) choline, (18) phosphocholine, (19) betaine and taurine, (20) taurine, (21) glycine, (22) homarine, (23) trigonelline, (24) glucose, (25) glycogen, (26) ATP (coincident with ADP/AMP), (27) tyrosine, (28) phenylalanine. The chemical shift values were reported in previous results and can also be found in the databases in the Human Metabolome Database (HMDB);6,11 (b) spectra of muscle, mantle, and stomach from Eastern
metabolites representing nitrogen metabolism were most elevated. Osmolytes, such as betaine, proline, taurine,
β-alanine, hypotaurine, and trigonelline, help maintain cell volume by making the osmolarity between extracellular and intracellular environments similar so that water does not rush out of the cells, imploding them.25 Nitrogenous
pollutants and organic material are far more common in freshwater than sea water, so nitrogenous storage compounds, such as the polyamine, putrescine, which is derived from ornithine, and its catabolite, aminobutanal, are most abundant.22 These coupled metabolites can readily
form the amino acid glutamate, depending on the energy use of the Krebs cycle intermediate alpha-ketoglutarate. Putrescine can be formed either directly from L-ornithine by ornithine decarboxylase (ODC) or indirectly from L-arginine by arginine decarboxylase (ADC).26 While
the ODC pathway was considered the only mammalian pathway for polyamine biosynthesis, recently the presence of the ADC pathway in mammals has been demonstrated. In higher plants the presence of both pathways has been known for some time. In bacteria, both pathways are common, and are often found side by side in the same organism.27 It
is unknown whether which metabolic pathway dominates in mollusks and whether this is produced by bacterial symbiosis. Future studies are undergoing to address this quandary and the preliminary result were recently reported.22 The polyamines (the most common of which
are putrescine, spermine, and spermidine) are a group of positively charged organic polycations that are involved in many biological processes, including binding to nucleic acids, stabilizing membranes, and stimulating several enzymes.27 While it is clear that polyamines are essential
for normal cell growth, we still do not fully understand their specific molecular functions in vivo. Putrescine and spermidine are found in all life forms, while spermine is found mostly in eukaryotes.28 Theoretically, during fed
state energy substrates increase and more glutamate is available for protein synthesis, while during starvation, protein breakdown will increase alpha-ketoglutarate for entry into the Krebs cycle. In addition, to higher levels of ammonia, freshwater can have higher ranges of pH and these molecule, putrescine and aminobutanal, act as metabolic buffers for ammonia and carbonic acid. The biochemical similarities between these two species are that adenosine triphosphate (ATP)/adenosine diphosphate (ADP)/adenosine monophosphate (AMP) and arginine are elevated in muscle tissue, and glycogen is a major storage molecule for glucose, a carbohydrate energy source.
Figure 3 shows the 13C spectra from an oyster exposed
to U-13C-glucose (b, d, and f) or 2-13C-glycine (a, c, and e).
The first pair from the top is from muscle, the second from mantle, and the third from stomach. Betaine and taurine are two most abundant osmolytes found in oysters and the peaks noted as betaine and taurine in Figure 3 are due to the natural abundance of 13C.9 Both glycine and glucose
are metabolized in all organ blocks in a similar manner, but glycogen is significantly 13C-labeled in the mantle
and digestive gland/stomach after treatments containing U-13C-glucose. As expected, osmolytes betaine and taurine
are primary metabolite and dominated the metabolome in all three organ blocks. The most distinctive feature between the spectra of the different tissue blocks is that glycogen, which is synthesized from glucose, is present in the mantle and gill and the digestive gland/stomach, but not in the
Figure 3. 13C spectra from oyster after exposure to 13C trace compounds: (a) muscle after glycine; (b) muscle after glucose; (c) mantle after glycine; (d)
muscle. The spectral result is consistent with the finding that the mantle and the digestive gland/stomach contain a large amount of glycogen. The study shows that mantle and stomach are a major glycogen storage depot. This structure is large and obvious in oysters taken directly from wild oyster beds where they are feeding naturally. Holding an oyster in aerated seawater without providing food results in dramatic rapid reduction of the size of this structure, and its complete disappearance to the unaided eye within 2 to 3 days of fasting. Glycine was metabolized by the glycine cleavage system forming serine 2-13C, 3-13C, and 2,3-13C
serine detected as triplets by 13C NMR.14
We can also observe peaks from U-13C-glucose derived
alanine, the end-product of anaerobic glycolysis, glycogen by glycogen synthesis and glutamate and aspartate through the Krebs cycle in oysters. Oxygen consumption of oysters is high when the valves are open, but may be reduced to near zero for prolonged periods, even several days, when the valves are closed. This may be possible because of rapid switching between aerobic and anaerobic glycolysis, with conversion of glucose into glycogen occurring during the aerobic phase. It has been shown that glycogen accumulates in specialized storage cells found at different locations in oysters, including the area around the labial palps and the gonadal region.11 When glycine is applied, it is metabolized
to serine. Although one of the metabolic pathways of betaine formation is trimethylation of glycine, we detect no increase in 13C labeling or occurrence of peak splitting of betaine
compared with data using U-13C-glucose, suggesting that at
least under these metabolic conditions, betaine formation is not active enough to change its concentration. Similar to betaine, taurine also did not show any discernable change either in peak height or splitting pattern expected if taurine is synthesized by U-13C-glucose and therefore taurine is
not formed using 13C compounds used in the experiments.
All of the alanine in the U-13C-glucose treatment is formed
from glucose via glycolysis, resulting in formation of U-13C-alanine, not by glycine as evidenced by the splitting
pattern of alanine at 18.9 and 53.4 ppm.14 And the absence
of lactate peaks at 22.8 and 71.2 ppm suggests that the primary glycolytic end product derived from either glucose is alanine.2
Conclusions
Bivalve mollusks are filter feeders contributing to the overall filtration capacity of the near shore marine and estuarine ecosystems in addition to being an economically important food species harvested wild and produced in mariculture. The investigation of physiology of marine bivalves, classically relies on destructive methods, because
a hermetic shell protects the animal. Similarly, assessment of body condition of oysters has routinely been a destructive assessment.29 Here we examine the possible applications
of the MR imaging and spectroscopic techniques to study the metabolism in oysters after infusing NMR traceable isotopes to evaluate the consumption, distribution and storage of the glucose, glycine and their metabolites. Our results could serve as the basal metabolic guideline of oysters and, therefore, even without using NMR isotopes, the analytical NMR method could be used to determine the metabolic effect of the physiological adaptation due to the anthropogenic factors.30 This study was focused on
using NMR techniques on dissected tissues to localized metabolic pathways. Further studies will monitor glycogen consumption, metabolism and distribution in the live, intact oysters under different oxygen and nutrition condition according to the seasonal change.31
Acknowledgments
This work is supported by 2013 Bisa Research Grant of Keimyung University. The author is particularly grateful to Andrey Tikunov for the sample preparation and data collection and Jeffrey M. Macdonald for the valuable comments and suggestions.
References
1. Zhou, B.; Xiao, J. F.; Tuli, L.; Ressom, H. W.; Mol. BioSyst.
2012, 8, 470.
2. Clendinen, C. S.; Stupp, G. S.; Wang, B.; Garrett, T. J.; Edison, A. S.; Curr. Metabolomics 2016, 4, 116.
3. Anthony, D. M.; Victor, S.; Caroline, D. R.; Curr. Metabolomics
2013, 1, 2.
4. Dudognon, T.; Soudant, P.; Seguineau, C.; Quéré, C.; Auffret, M.; Kraffe, E.; Aquat. Living Resour. 2013, 26, 249.
5. Deighton, N. In Molecular and Biochemical Toxicology; Smart, R. C.; Hodgson, E., eds.; John Wiley & Sons, Inc.: Hoboken, New Jersey, 2008, p. 67.
6. Ellis, R. P.; Spicer, J. I.; Byrne, J. J.; Sommer, U.; Viant, M. R.; White, D. A.; Widdicombe, S.; Environ. Sci. Technol. 2014, 48, 7044.
7. Ellinger, J. J.; Chylla, R. A.; Ulrich, E. L.; Markley, J. L.; Curr. Metabolomics 2013, 1, 2.
8. Lee, H.; Tikunov, A.; Stoskopf, M. K.; Macdonald, J. M.; Mar. Drugs 2010, 8, 2369.
9. Tikunov, A. P.; Johnson, C. B.; Lee, H.; Stoskopf, M. K.; Macdonald, J. M.; Mar. Drugs 2010, 8, 2578.
11. Eckelbarger, K. J.; Davis, C. V.; Mar. Biol. 1996, 127, 79. 12. Clendinen, C. S.; Stupp, G. S.; Ajredini, R.; Lee-McMullen,
B.; Beecher, C.; Edison, A. S.; Front. Plant Sci. 2015, 6, 611. 13. Lu, H.; Liu, X.; Huang, M.; Xia, J.; Chu, J.; Zhuang, Y.; Zhang,
S.; Noorman, H.; Microb. Cell Fact. 2015, 14, 1.
14. Johnson, C. B.; Tikunov, A. P.; Lee, H.; Wolak, J. E.; Pediaditakis, P.; Romney, D. A.; Holmuhamedov, E.; Gamcsik, M. P.; Macdonald, J. M.; Magn. Reson. Med. 2012, 68, 671. 15. Lee, H.; Holburn, G. E.; Price, R. R.; J. Magn. Reson. Imaging
2001, 13, 163.
16. Dewar, B. J.; Keshari, K.; Jeffries, R.; Dzeja, P.; Graves, L. M.; Macdonald, J. M.; Metabolomics 2010, 6, 439.
17. Fan, T. W. M.; Colmer, T. D.; Lane, A. N.; Higashi, R. M.; Anal. Biochem. 1993, 214, 260.
18. Wishart, D. S.; Jewison, T.; Guo, A. C.; Wilson, M.; Knox, C.; Liu, Y.; Djoumbou, Y.; Mandal, R.; Aziat, F.; Dong, E.; Bouatra, S.; Sinelnikov, I.; Arndt, D.; Xia, J.; Liu, P.; Yallou, F.; Bjorndahl, T.; Perez-Pineiro, R.; Eisner, R.; Allen, F.; Neveu, V.; Greiner, R.; Scalbert, A.; Nucleic Acids Res. 2013, 41, D801. 19. Sousa, S. A. A.; Magalhães, A.; Ferreira, M. M. C.; Chemom.
Intell. Lab. Syst. 2013, 122, 93.
20. van den Berg, R.; Hoefsloot, H. C. J.; Westerhuis, J. A.; Smilde, A. K.; van der Werf, M. J.; BMC Genomics 2006, 7, 1. 21. Lin, C. Y.; Wu, H.; Tjeerdema, R. S.; Viant, M. R.; Metabolomics
2007, 3, 55.
22. Hurley-Sanders, J. L.; Levine, J. F.; Nelson, S. A. C.; Law, J. M.; Showers, W. J.; Stoskopf, M. K.; Conserv. Physiol. 2015,
3. DOI: 10.1093/conphys/cov023.
23. Cappello, T.; Mauceri, A.; Corsaro, C.; Maisano, M.; Parrino, V.; Lo Paro, G.; Messina, G.; Fasulo, S.; Mar. Pollut. Bull. 2013,
77, 132.
24. Viant, M. R.; Rosenblum, E. S.; Tjeerdema, R. S.; Environ. Sci. Technol. 2003, 37, 4982.
25. Machado, A. R. T.; Lage, G. A.; Medeiros, F. S.; de Souza Filho, J. D.; Pimenta, L. P. S.; Nat. Prod. Bioprospect. 2013, 3, 158. 26. Matsumoto, M.; Kibe, R.; Ooga, T.; Aiba, Y.; Kurihara, S.;
Sawaki, E.; Koga, Y.; Benno, Y.; Sci. Rep. 2012, 2, 233. 27. Zhou, R.; Kang, X.; Tang, B.; Mohan, C.; Wu, T.; Peng, A.;
Liu, J.-Y.; Life Sci. 2016, 146, 73.
28. Mandal, S.; Mandal, A.; Johansson, H. E.; Orjalo, A. V.; Park, M. H.; Proc. Natl. Acad. Sci. U. S. A. 2013, 110, 2169. 29. Larive, C. K.; Barding, G. A.; Dinges, M. M.; Anal. Chem.
2015, 87, 133.
30. Tuffnail, W.; Mills, G. A.; Cary, P.; Greenwood, R.;
Metabolomics 2009, 5, 33.
31. Gika, H. G.; Theodoridis, G. A.; Plumb, R. S.; Wilson, I. D.;
J. Pharm. Biomed. Anal. 2014, 87, 12.