Article
Printed in Brazil - ©2016 Sociedade Brasileira de Química 0103 - 5053 $6.00+0.00
*e-mail: [email protected]
Compounds of
Anthostomella brabeji,
an Endophytic Fungus Isolated from
Paepalanthus planifolius
(Eriocaulaceae)
Marcelo R. de Amorim,a Andressa Somensi,a Angela R. Araujo,a Bruna V. Bonifácio,b Tais M. Bauabb and Lourdes C. dos Santos*,a
aDepartamento de Química Orgânica, Instituto de Química and bDepartamento de Ciências Biológicas, Escola de Ciências Farmacêuticas, Universidade Estadual Paulista (UNESP),
14800-900 Araraquara-SP, Brazil
In this study, fifteen endophytic fungi were isolated from Paepalanthus planifolius
(Eriocaulaceae). From the capitula, seven endophytes were screened and evaluated for their metabolomic profile and radical scavenging activity (2,2-diphenyl-1-picrylhydrazyl (DPPH) assay). Chemical investigation of ethyl acetate extract of the endophytic fungus Anthostomella brabeji
resulted in the isolation of one new compound, (+)-(6R*,7S*,8R *)-6,7,8-trihydroxy-2,2-dimethyl-5,6,7,8-tetrahydro-chroman-4-one, and three known compounds: 6-hydroxy-2,2-dimethyl-5,6,7,8-tetrahydro-7,8-epoxycroman-4-one, siccayne and eutypinol. All of the compound structures were elucidated using 1D and 2D nuclear magnetic resonance (NMR) and mass spectrometry (MS) analyses. The antimicrobial activity of the compounds and A. brabeji extract were assayed against the microorganisms Staphylococcus aureus, Escherichia coli, Salmonella setubal and
Candida albicans. Measured minimal inhibitory concentration (MIC) values ranged from 31.25 to 1000.0 µg mL-1.
Keywords:Anthostomella brabeji, endophytic fungus, antimicrobial activity, Paepalanthus planifolius
Introduction
Endophytic fungi are a diverse group of ascomycetes fungi defined by their asymptomatic occurrence within the plant tissue, and occur in all major lineages of land plants in natural and anthropogenic communities ranging from the arctic to the tropics.1 The endophytes colonize the inner
tissues of plants, the intercellular spaces such as xylem and phloem cells, but do not exert pathogenic apparent effects to their host.2,3 They have been cited for high
capacity production of bioactive metabolites, which can be grouped into several classes, including alkaloids, steroids, terpenes, isocoumarins, quinones, lignans, phenolic acids, cytochalasins, diketopiperazines, among others,4 making
them a target for research through the search for substances with potential for use in the pharmaceutical and agricultural industry.5
In our search for new bioactive substances from endophytic fungi, we isolated fifteen fungi from the capitula, scapes and leaves of Paepalanthus
planifolius (Eriocaulaceae). The genus Paepalanthus has approximately 357 species, 95% of which are endemic species restricted to Brazil.6 The Espinhaço Range is
the second largest mountain range in Brazil with its northern and southern extremities in the state of Bahia and Minas Gerais, respectively, and is known as a major center of plant diversity and endemism.7 The Espinhaço
Range in southeastern Brazil is the center of diversity of
Paepalanthus, and the genus is also quite diverse on the Guiana Shield and, to a lower degree, in central Brazil and within the Atlantic Forest domain.8
In the context of the need to preserve Eriocaulaceae due to many of these species being endangered and considering the absence of records or studies involving the endophytic fungi-Eriocaulaceae interactions,9 this work describes the
first chemical study of A. brabeji, an endophytic fungus found in the Xylariaceae family, with over 1300 species accommodated in more than 70 genera.10 The first fungus
identified from the leaves of Brabejum stellatifolium
belongs to the typical vegetation of South Africa called “fynbos”,11,12 but this fungus was isolated and identified
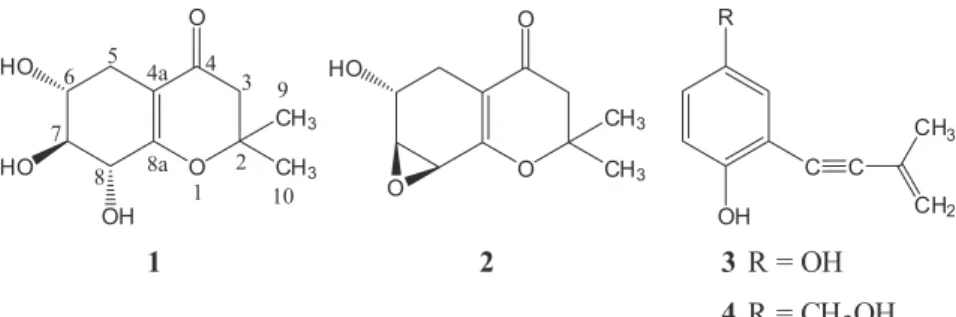
For the study of the capitula of P. planifolius, seven strains were isolated and evaluated for their metabolomic profile and radical scavenging activity (2,2-diphenyl-1-picrylhydrazyl (DPPH) assay). Our previous investigation on the endophytic fungus A. brabeji extract resulted in a new compound (+)-(6R*,7S*,8R *)-6,7,8-trihydroxy-2,2-dimethyl-5,6,7,8-tetrahydro-chroman-4-one (1) and three known compounds 6-hydroxy-2,2-dimethyl-5,6,7,8-tetrahydro-7,8-epoxychroman-4-one (2), siccayne (3) and eutypinol (4) (Figure 1). Furthermore, the antimicrobial activities of these compounds were evaluated.
Experimental
General experimental procedures
These compounds were structurally identified by high-resolution mass spectrometry (HRMS) and nuclear magnetic resonance (NMR) analyses. 1H NMR (600 MHz), 13C NMR (150 MHz), gradient heteronuclear multiple
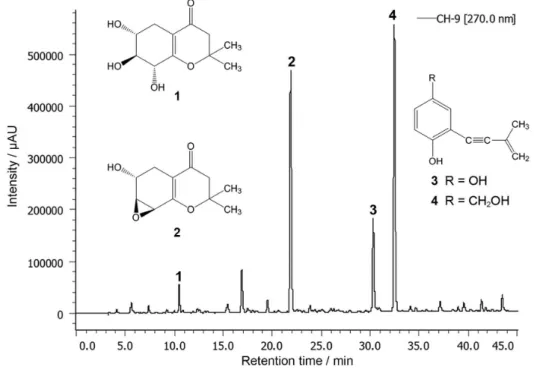
bond correlation (gHMBC), gradient heteronuclear multiple quantum correlation (gHMQC), gradient correlation spectroscopy (gCOSY), 1D total correlation spectroscopy (TOCSY) and homonuclear decoupling (HOMODEC) experiments were conducted on a Bruker Avance III 600 spectrometer using the non-deuterated residual solvent signal as a reference. Mass spectra were acquired on a AB SCiex 3200 QTRAP mass spectrometer for compounds 2, 3 and 4 and on a Q-TOF Bruker MaXis Impact mass spectrometer for compound 1, using water:methanol as the eluent. Optical rotation was measured on a PerkinElmer 341-LC polarimeter. Analytical high performance liquid chromatography (HPLC) was performed on a Jasco PU-2089 solvent delivery module and AS-2055 autosampler coupled with a Jasco MD-2018 photodiode array detector (DAD) system using an RP-18 column (Thermo Aquasil Gold aQ, 250.0 × 4.6 mm i.d., 5 µm) along with the protective guard column Phenomenex (4 × 3 mm). The analysis was performed using a gradient mode, eluted with a water:methanol gradient (5-75% methanol, 45 min) containing 0.1% of trifluoroacetic acid
monitored at 270 nm, flow rate 1.0 mL min-1 and injection
volume of 10 µL. Semipreparative HPLC-DAD was performed on a Jasco (PU-2086 Solvent Delivery Module), equipped with a DAD (MD-2010) system and injector with a loop (500 µL) using a RP-18 column (Thermo Aquasil Gold aQ, 250.0 × 20.0 mm i.d., 5 µm) along with the protective guard column Phenomenex (10 × 10 mm) and flow rate 13.0 mL min-1. The software ChromNav was used
to control the system, data collection, and processing. All solvents were purchased from Sigma-Aldrich and Tedia for HPLC analysis.
Plant material
Authenticated Paepalanthusplanifolius (Eriocaulaceae) was collected at Serra do Cipó, Minas Gerais, Brazil (19º13’21.64” S, 43º30’04.06” W), in October 2013 and identified by Prof Paulo Takeo Sano. A voucher specimen (Sano 4979) was deposited at the Institute of Biosciences, University of São Paulo (USP), Brazil.
Fungi isolation and identification
Endophytic fungi were isolated from the capitula, scapes and leaves of adult P. planifolius, which was subjected to surface sterilization. After that they were first washed with water and soap and then immersed in 1% aqueous sodium hypochlorite solution for 5 min and 70% aqueous ethanol (EtOH) for 2 min. Finally, in duplicate, the vegetal material was immersed in sterile H2O
for 5 min. The sterilized material was cut into 2 × 2 cm2
pieces and deposited on a Petri dish containing potato dextrose agar (PDA) and gentamicin sulfate (100 µg mL-1)
with approximately 3 to 4 pieces on each dish.13 Fifteen
single fungal strains were obtained following serial transfers on PDA plates and deposited in the Núcleo de Bioensaios, Biossíntese e Ecofisiologia de Produtos Naturais (NuBBE) fungi collection in Araraquara, Brazil (stored in sterile water at 25 ºC). From the fifteen isolated endophytic fungi, one was identified as Anthostomella brabeji by Genotyping Biotecnologia, Botucatu, São
O O
CH3 CH3
HO
OH HO
O O
CH3 CH3
O HO
OH R
C C
CH3
CH2
1 2 3
4
R = OH
R = CH 2OH 2
3 4 5
7 8 6
8a 4a
1 10 9
Paulo, Brazil, through automatic sequencing by capillary electrophoresis equipment ABI 3500 Genetic Analyzer (Applied Biosystems) and alignment of nucleotide sequences generated with reference sequences deposited in GenBank.
Fungal growth and extraction
Endophytic fungi isolated from the capitula of
P. planifolius were each inoculated into three Erlenmeyer flasks (500 mL), each containing potato dextrose broth (PDB) medium (300 mL), on the reduced scale. The medium was autoclaved at 121 ºC for 20 min. After cooling, the medium was inoculated with the endophytes and incubated at 25 ºC in static mode for 28 days. The flask-accumulated mycelial biomass was separated from the aqueous medium by filtration, and the filtrated was subjected to liquid-liquid partition with ethyl acetate (EtOAc). The EtOAc fraction was evaporated in vacuum resulting in a crude extract.13
Endophytic fungus A. brabeji was cultured on a larger scale, inoculated into fifteen Erlenmeyer flasks (500 mL), and the crude extract was obtained in the same method performed on reduced scale described above.
Isolation and identification of the metabolites
The EtOAc crude extract (732.3 mg) obtained from large scale culture was solubilized in methanol:water (7:3 v/v, 10.0 mL) using ultrasound for 10 min and then centrifuged for 15 min. Further fractionation and purification by semipreparative HPLC-DAD led to the isolation of four compounds, 2 (19.4 mg), 3 (9.7 mg), 4 (13.6 mg) and including one new natural product, compound 1 (6.1 mg).
DPPH-thin-layer chromatography (TLC) assay
On TLC plates (silica gel 60 F254, Whatman), 10 µg
of each fungi extract were applied and eluted with CHCl3:MeOH:H2O (43:37:20 v/v). TLC plates were
sprayed with DPPH solution (0.2%) in methanol. The plates were examined 30 min after spraying. Active compounds appeared as yellow spots against a purple background. Quercetin was used as reference compound.14
Microorganisms
The microorganism samples used in this study were
Escherichia coli American Type Culture Collection (ATCC) 25922, Staphylococcus aureus ATCC 25923,
Candida albicans ATCC 10231 and Salmonella setubal
ATCC19196 obtained from ATCC. The strains were stored in Mueller-Hinton broth (MHB, bacteria) or Sabouraud dextrose broth (SDB, yeast) plus 20% glycerol and frozen at –20 ºC. For use, they were subcultured in 2 mL of MHB (bacteria) or SDB (yeast) and incubated at 37 ºC for 24 and 48 h, respectively.
Growth conditions and standardization of microorganism suspensions
After growing in Mueller-Hinton agar (MHA), the bacterial strains were transfered to sterile MHB and the turbidity was adjusted to 0.5 McFarland scale (108 colony forming unit (CFU) mL-1). After confirming this
concentration using spectrophotometric reading at 620 nm and counting in Neubauer chamber, the suspensions were diluted 1:10 resulting in a suspension of 107 CFU mL-1,
which was used in the experiments.15 After growing in
Sabouraud dextrose agar (SDA), the yeast was transferred to sterile phospate buffer saline (PBS) and the turbidity was adjusted to 0.5 McFarland scale (106 CFU mL-1). After
confirming this concentration using spectrophotometric reading at 530 nm and counting in a Neubauer chamber, this suspension was diluted 1:2000 resulting in a suspension of 2.5 × 10³ CFU mL-1, which was used in the experiments.16
Determination of minimal inhibitory concentration (MIC)
MIC was determined using microdilution technique according to the standard reference method M7-A6 (bacteria) and M27-A3 (yeast) from Clinical and Laboratory Standards Institute (CLSI), with modifications.17,18
The samples were dissolved in 20% dimethyl sulfoxide (DMSO) and water to a initial concentration of extract of 2000 µg mL-1. Then, a two-fold serial dilution was made
in order to obtain concentrations ranging from 7.81 to 1000 µg mL-1. A volume of 100 µL of each concentration
was added to 96 well microplates containing 80 µL of MHB or Roswell Park Memorial Institute (RPMI) 1640 medium for bacteria and the yeast, respectively. The positive controls were ampicillin for bacteria and amphotericin B and fluconazole for yeast; 20% DMSO was used as negative control. The microplates were incubated at 37 ºC for 24 h for bacteria and 37 ºC for 48 h for the yeast. The tests were performed in triplicate.
inhibition. Yeast growth changes the colorless TTC to a red color. The MIC was defined as the lowest sample concentration that prevented this change and exhibited inhibition of microorganism growth.15,16
Results and Discussion
In a preliminary assay screening, the extract of A. brabeji
showed radical scavenging activity in a DPPH-TLC assay. The A. brabeji extract was subjected to preparative HPLC-DAD which resulted in the new (+)-(6R*,7S*,8R *)- 6,7,8-trihydroxy-2,2-dimethyl-5,6,7,8-tetrahydro-chroman-4-one (1), and three known compounds: 6-hydroxy-2,2-dimethyl-5,6,7,8-tetrahydro-7,8-epoxycroman-4-one (2), siccayne (3) and eutypinol (4) (Figure 2).
Compound 1 was isolated as an optically active ([α]20 D +50, c = 0.08, CH3OH), amorphous white powder. Electrospray
ionization quadrupole time-of-flight (ESI-Qq-TOF)-HRMS analysis exhibited an ion at m/z 229.1070 [M + H]+ and
251.0889 [M + Na]+, establishing the molecular formula as
C11H16O5 (calcd.: 229.1070). The second order fragmentation
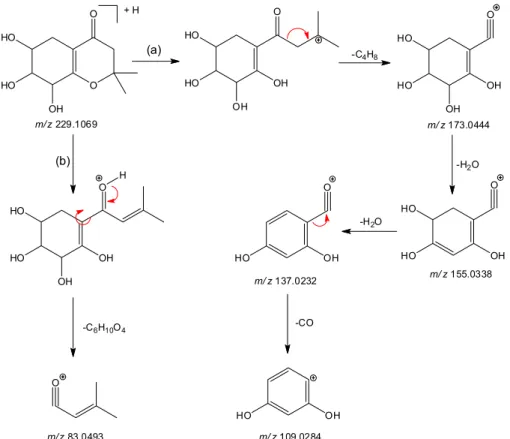
(HR-ESI-tandem mass spectrometry (MS/MS)) of the precursor ion at m/z 229.1070 (14), corresponding to the protonated molecule in the mass spectrum, showed base peak at m/z 83.0493 [M−C6H10O4 + H]+ (100). Another
signal observed at m/z 173.0444 [M−C4H8 + H]+ (33)
corresponds to the loss of 2-methyl-1-propene;
m/z 155.0338 [M−C4H8−H2O + H]+ (65) and 137.0232
[M−C4H8−H2O−H2O + H]+ (34) refer to the loss of water
and m/z 109.0232 [M−C4H8−H2O−H2O−CO + H]+ (46)
refers to the loss of carbon monoxide, successively. The fragmentation pathway proposal is described in Figure 3.
Analysis of the 1H NMR, COSY and 1D TOCSY spectra
revealed a sequence of five hydrogens at dH4.05 (dd, 1H, J 7.3, 1.8 Hz, H-8), 3.51 (dd, 1H, J 9.3, 7.3 Hz, H-7), 3.60 (ddd, 1H, J 9.5, 9.3, 5.5 Hz, H-6),2.02 (ddd, 1H, J 16.0, 9.5, 1.8 Hz, H-5ax) and 2.72 (dd, 1H, J 16.0, 5.5 Hz, H-5eq), which
belong to the same spin system (Figure 4). The 13C NMR
data of 1 revealed the presence of an α,β-unsaturated ketone group at dC 194.8 (C-4), 107.9 (C-4a) and 167.6 (C-8a)
(Table 1). The HMBC correlations from H-5 to C-4, C-4a and C-8a; H-8 to C-4a and C-8a revealed that C-5 (dC 28.1)
and C-8 were bridged through the 4a,8a-double bond via α,β-unsaturated ketone moiety. The signals at dH 1.42 (s,
3H, H-9) and 1.44 (s, 3H, H-10) were assigned to two methyl groups co-anchored on quaternary carbon at dC 82.0
(C-2) by HMBC correlations from H-9 and H-10 to C-2 and C-3 (dC 47.8). The signals at dH 2.52 (d, 1H, J 16.6 Hz,
H-3a) and 2.56 (d, 1H, J 16.6 Hz, H-3b) were assigned to a methylene group with magnetically different hydrogens, and correlations from H-3 to C-2, C-4, C-9 and C-10 in the HMBC spectrum indicated that it was positioned between C-4 and C-2. The relative configuration was based on coupling constant values from 1H NMR and HOMODEC
analysis as well as by analysis of 1D nuclear Overhauser effect spectroscopy (NOESY) spectrum. Irradiation at
d4.05 (H-8) resulted in modifications in the multiplicity of the protons H-7 as doublet (d3.51; d, J 9.5 Hz) and H-5 as double doublet (d2.02; dd, J 16.0, 9.3 Hz) revealing that H-5 (d2.02), H-6 (d3.60) and H-7 (d3.51) protons
were in axial positions. Furthemore, irradiation at d2.02 (H-5ax) showed pseudo-axial-axial coupling between H-7
and H-8 (d4.05; d, J 7.3 Hz). Nuclear Overhauser effect (NOE) correlations of H-6 to H-5eq and H-8 suggested
that these three protons were cofacial. Therefore, in the half-chair conformation the OH groups must be in pseudo-equatorial positions and the relative configuration of 1 was assigned as 6R*, 7S* and 8R*. Collectively, the structure of (+)-(6R*,7S*,8R *)-6,7,8-trihydroxy-2,2-dimethyl-5,6,7,8-tetrahydro-chroman-4-one (1) was determined. All spectra are provided in Supplementary Information.
The chromanone derivative (2) and phenolic acetylenic (3 and 4) were identified by comparison of their MS,
1H NMR, and 13C NMR data with literature values.
These compounds were also previously isolated from
Eutypa lata.19-23
Siccayne (3) was first isolated from the fungus
Helminthosporium siccans and marine fungus Halocyphina villosa, showing bioactive activity against strains of bacteria and fungi.24,25 This compound exhibits moderate OH O HO OH HO OH O HO OH HO OH O HO HO OH O HO OH HO O O HO OH HO + H
m/ z229.1069
-C4H8
-H2O
-CO
m/ z173.0444
m/ z109.0284
m/ z137.0232 m/ z155.0338 -H2O
OH O HO OH HO H O
m/ z83.0493 -C6H10O4
(a)
(b)
Figure 3. Proposed fragmentation pathways of 1 byHR-ESI-MS/MS.
Table 1.1H and 13C NMR data of compound 1 in CD
3OD [din ppm
(multiplicity, J in Hz)] at 600 and 150 MHz, respectively
Position 1
dH (multiplicity, J / Hz) dC
2 – 82.0
3a 2.52 (d, 16.6) 47.8
3b 2.56 (d, 16.6) 47.8
4 – 194.8
4a – 107.9
5ax 2.02 (ddd, 16.0, 9.5, 1.8) 28.1
5eq 2.72(dd, 16.0, 5.5) 28.1
6 3.60(ddd, 9.5, 9.3, 5.5) 69.6
7 3.51 (dd, 9.3, 7.3) 77.8
8 4.05(dd, 7.3, 1.8) 73.7
8a – 167.6
9 1.42 (s) 25.9
10 1.44 (s) 26.6
d: chemical shift; J: coupling constant.
O O CH3 CH3 HO OH HO HMBC 1 H-H COSY
Figure 4. Selected COSY and HMBC correlations of 1.
OH O HO OH HO OH O HO OH HO OH O HO HO OH O HO OH HO O O HO OH HO + H
m/ z229.1069
-C4H8
-H2O
-CO
m/ z173.0444
m/ z109.0284
m/ z137.0232 m/ z155.0338 -H2O
OH O HO OH HO H O
m/ z83.0493 -C6H10O4
antibiotic activity by inhibiting mitochondrial respiration of Saccharomyces cerevisiae and also cytotoxic activity against human cancer cell lines HeLa and HT29.26,27
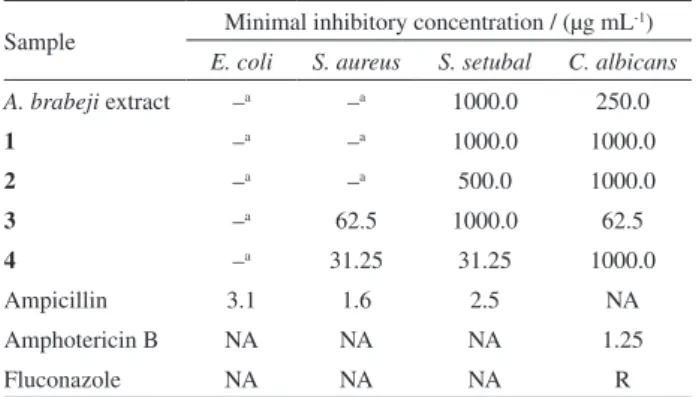
The results of the microdilution method (Table 2) showed no antibacterial activity against E. coli
(MIC > 1000 µg mL-1), while the samples 3 and 4
showed strong antibacterial activity against S. aureus, presenting MICs of 62.5 and 31.25 µg mL-1, respectively.
For S. setubal, the samples 2 (MIC 500 µg mL-1) and 4 (MIC 31.25 µg mL-1) showed the best antibacterial
activity, while the others presented MICs of 1000 µg mL-1.
All samples showed antifungal activity, especially 3, with a MIC of 62.5 µg mL-1. The literature does not provide a
consensus score related to MIC values obtained for natural products. Aligiannis et al.28 classified MIC values equal
to or less than 500 µg mL-1 as potent inhibitors; MICs
between 600 and 1500 µg mL-1 as moderate inhibitors and
above 1600 µg mL-1 as weak inhibitors. Webster et al.29
established as satisfactory MIC values equal to or less than 1000 µg mL-1. According to the last classification, all
samples could be classified as potent inhibitors, especially
3 for C. albicans and 4 for S. aureus and S. setubal.
Antimicrobial resistance is a concern factor, thus, the goal of new approaches that present antimicrobial activity against several types of bacteria and fungi is relevant.30 In
this sense, the antimicrobial screening of this study showed good results against S. aureus, S. setubal and C. albicans, since this fungus extract and isolated substances showed potential inhibition in concentrations ranging from 1000 to 31.25 µg mL-1.
Conclusions
The novel compound (1) and compounds with good antimicrobial activities (3 and 4) show the immense
potential of endophytic fungi to produce novel natural product as well as bioactive compounds. Therefore, these results suggest the need for chemical studies of this fungus varying the culture media as well as future prospects of the other fifteen endophytes isolated for the first time from associated Eriocaulaceae-endophytic fungi.
Supplementary Information
Supplementary i nformation (physical data and
1H NMR, 13C NMR and MS spectra for compounds 1-4)
is available free of charge at http://jbcs.sbq.org.br as PDF file.
Acknowledgments
The authors thank Paulo T. Sano for plant identification, Fundação de Amparo à Pesquisa do Estado de São Paulo (FAPESP) for financial support (grant 2015/04899-3) awarded to L. C. S., and M. R. A. thanks Coordenação de Aperfeiçoamento de Pessoal de Nível Superior (CAPES) for the scholarship granted.
References
1. Arnold, A. E.; Fungal Biol. Rev. 2007, 21, 51.
2. Hallman, J.; Quardt, H. A.; Mahafee, W. F.; Kloepper, J. W.;
Can. J. Microbiol. 1997, 43, 895.
3. Rekha; Jyoti, K.; Bala, M.; Arya, V.; BasicRes.J. Microbiol. 2013, 1, 1.
4. Zhang, H. W.; Song, Y. C.; Tan, R. X.; Nat. Prod. Rep. 2006,
23, 753.
5. Kharwar, R. N.; Mishra, A.; Gond, S. K.; Stierle, A.; Stierle, D.; Nat. Prod. Rep. 2011, 28, 1208.
6. Forzza, R. C.; Baumgratz, J. F. A.; Bicudo, C. E.; Carvalho Jr., A. A.; Costa, A.; Costa, D. P.; Hopkins, M.; Leitman, P. M.; Lohmann, L. G.; Maia, L. C.; Martinelli, G.; Menezes, M.; Morim, M. P.; Nadruz Coelho, M. A.; Peixoto, A. L.; Pirani, J. R.; Prado, J.; Queiroz, L. P.; Souza, V. C.; Stehmann, J. R.; Sylvestre, L. S.; Walter, B. M. T.; Zappi, D.; Catálogo de Plantas e Fungos do Brasil, vol. 1.; Andrea Jakobsson Estúdio:
Rio de Janeiro, 2010, pp. 86.
7. Giulietti, A. M.; Pirani, J. R.; Harley, R. M. In Centres of Plant Diversity: A Guide and Strategies for the Conservation, vol. 3.;
Davis, S. D.; Heywood, V. H.; Herrera-MacBryde, O.; Villa-Lobos, J.; Hamilton, A. C., eds.; WWF-IUCN: Cambridge, 1997, pp. 397.
8. Sano, P. T.; Costa, F. P.; Trovó, M.; Echternacht, L.; Rodriguesia
2015, 66, 299.
9. Costa, F. N.; Trovó, M.; Sano, P. T.; Megadiversidade2008, 4, 117.
Table 2. Minimal inhibitory concentrations of A. brabeji extract and substances 1-4
Sample Minimal inhibitory concentration / (µg mL
-1)
E. coli S. aureus S. setubal C. albicans
A. brabeji extract –a –a 1000.0 250.0
1 –a –a 1000.0 1000.0
2 –a –a 500.0 1000.0
3 –a 62.5 1000.0 62.5
4 –a 31.25 31.25 1000.0
Ampicillin 3.1 1.6 2.5 NA
Amphotericin B NA NA NA 1.25
Fluconazole NA NA NA R
aMinimal inhibitory concentration > 1000.0 µg mL-1. NA: not applicable;
10. Stadler, M.; Kuhnert, E.; Persoh, D.; Fournier, J.; Mycology
2013, 4, 5.
11. Cowling, R.; Richardson, D.; Fynbos: South Africa’s Unique Floral Kingdom; Fernwood Press: Vlaeberg, 1995.
12. Lee, S.; Crous, P. W.; Mycol. Res. 2003, 107, 360.
13. Chapla, V. M.; Zeraik, M.; Leptokarydis, I.; Silva, G.; Bolzani, V.; Young, M.; Pfenning, L.; Araújo, A.; Molecules
2014, 19, 19243.
14. Cuendet, M.; Hostettmann, K.; Potterat, O.; Dyatmyko, W.;
Helv. Chim. Acta1997, 80, 1144.
15. Araújo, M. G. F.; Hilário, F.; Nogueira, L. G.; Vilegas, W.; Santos, L. C.; Brunetti, I. L.; Sotomayor, C. H.; Bauab, T. M.;
Int. J. Mol. Sci.2012, 13, 9260.
16. Araújo, M. G. F.; Pacífico, M.; Vilegas, W.; Santos, L. C.; Icely, P. A.; Miró, M. S.; Scarpa, M. V. C.; Bauab, T. M.; Sotomayor, C. E.; Med. Mycol.2013, 51, 673.
17. Clinical and Laboratory Standards Institute (CLSI); Methods for Dilution Antimicrobial Susceptibility Tests for Bacteria that
Grow Aerobically, 6th ed., Document M7-A6; CLSI: Wayne,
2006.
18. Clinical and Laboratory Standards Institute (CLSI); Reference Method for Broth Dilution Antifungal Susceptibility Testing of
Yeasts, Document M27-A3; CLSI: Wayne, 2008.
19. Smith, L. R.; Mahoney, N.; Molyneux, R. J.; J. Nat. Prod. 2003,
66, 169.
20. Tsoupras, G.; De Angelis, P.; Zesiger, T.; Renoud, J. M.; Tabacchi, R.; Bioact. Mol. 1988, 7,93.
21. Renaud, J. M.; Tsoupras, G.; Tabacchi, R.;Helv. Chim. Acta
1989, 72, 929.
22. Renaud, J. M.; Tsoupras, G.; Stoecklievans, H.; Tabacchi, R.;
Helv. Chim. Acta 1989, 72, 1262.
23. Jiménez-Teja, D.; Hernández-Galán, R.; Collado, I. G.; Nat.
Prod. Rep. 2006, 23, 108.
24. Ishibashi, K.; Nose, K.; Shindo, T.; Aral, M.; Mishima, H.;
Sankyo Kenkyusho Nenpo1968,20, 76.
25. Kupka, J.; Anke, T.; Steglich, W.; Zechlin, L.; J. Antibiot. 1981,
34, 298.
26. Kim, J. H.; Mahoney, N.; Chan, K. L.; Molyneux, R. J.; Campbell, B. C.; Curr. Microbiol. 2004, 49, 282.
27. Liu, S.; Guo, L.; Che, Y.; Liu, L.; Fitoterapia2013, 85, 114. 28. Aligiannis, N.; Kalpotzakis, E.; Mitaku, S.; Chinou, I. B.;
J. Agric. Food Chem. 2001, 49, 4168.
29. Webster, D.; Taschereau, P.; Belland, R. J.; Sand, C.; Rennie, R. P.; J. Ethnopharmacol. 2008,115, 140.
30. Cragg, G. M.; Newman, D. J.; Biochim. Biophys. Acta2013,
1830, 3670.
Submitted: October 15, 2015
Published online: December 21, 2015