Article
J. Braz. Chem. Soc., Vol. 26, No. 10, 2069-2076, 2015. Printed in Brazil - ©2015 Sociedade Brasileira de Química 0103 - 5053 $6.00+0.00
A
*e-mail: [email protected]
Biomimetic Sensor for Detection of Hydrochlorothiazide Employing Amperometric
Detection and Chemometrics for Application in Doping in Sports
Mayara R. S. Ruy,* Eduardo C. Figueira and Maria D. P. T. Sotomayor
Departmento de Química Analítica, Instituto de Química, Universidade Estadual Paulista (UNESP), 14801-970 Araraquara-SP, Brazil
This work describes a simple and cost-effective method for quantitative determination of hydrochlorothiazide usingbiomimetic sensor based on a carbon paste modified with hemin (biomimetic catalyst of the P450 enzyme). The sensor was evaluated using cyclic voltammetry and amperometry for its electrochemical characterization and quantification, respectively. Amperometric analyses were carried out at 800 mV vs. Ag/AgCl (KClsat), using a 0.1 mol L
−1 phosphate buffer solution at pH 8.5 as the support electrolyte. Optimization of the experimental parameters was performed using a multivariate methodology. The proposed method was successfully applied to the analysis of hydrochlorothiazide in spiked urine and pharmaceutical formulations, demonstrating that it is a reliable, feasible and efficient alternative method for the detection of hydrochlorothiazide in doping and can also be used for the quality control method.
Keywords: hydrochlorothiazide, biomimetic sensor, P450 enzyme, hemin, doping
Introduction
Hydrochlorothiazide (HCTZ) is a diuretic drug belonging to the thiazide class. Diuretics are substances that increase urine flow and reduce the capacity of tubular absorption of sodium and water. Their use reduces blood volume, decreases blood return to the heart and consequently reduces cardiac output (lowers blood pressure). HCTZ has wide indications in the treatment of diseases such as renal edema, hypertension, hypercalcemia and nephrogenic diabetes insipidus.1 It is
absorbed from the gastrointestinal tract and it is mostly eliminated by renal excretion, with an average of 65-72% being excreted in urine.2,3
In sports, thiazide diuretics are used to flush out the prohibited substances previously taken with forced diuresis, and also where weight classes are involved to achieve acute and instantaneous weight loss.4 For this reason, all
diuretics are banned in sports by the World Anti-Doping Agency (WADA).5 Besides being an ethically condemned
practice considering a risk to the athletes’ health they are generally self-administered in a wrong manner; i.e., overdoses, interactions with other drugs or even the use of drugs of illicit origin.6-8 Evidently, a sensitive and reliable
analytical method to determine diuretics in urine and/or
plasma is an important prerequisite in sport activities. Classical analytical techniques such as gas chromatography (GC),9 high-performance liquid chromatography (HPLC),10-15
capillary electrophoresis16 and mass spectrometry,10
are very sensitive and standardized techniques for the determination of these substances which are prohibited in sport, have been commonly used. These techniques have some disadvantages such as complexity, extensive time consumption, high cost and also need for qualified and technical workers. For these reasons, the development of rapid, simple and alternative method for screening and quantitative detection of hydrochlorothiazide is still very important.
There are some reports which describe the determination of HCTZ using electrochemical techniques.17-22
Electrochemical methods have shown excellent procedures and advantages such as simplicity, rapid response, excellent reproducibility, good stability, low cost, low limit of detection for the sensitive determination of organic molecules, including drugs and related molecules in pharmaceutical sample and biological fluids.23-30
Coupled with all the characteristics of electrochemical techniques, chemically modified electrodes based on porphyrins and phthalocyanines complexes have been used as alternative method of analysis to obtain electrochemical sensors with high sensitivity, selectivity and stability.31-33
they can be used as artificial enzymes, mimicking the active site of the enzyme P450, iron protoporphyrin IX, which is responsible for the catalysis of a wide variety of chemical reactions in organisms, metabolizing a variety of compounds, including xenobiotics, such as drugs, pesticides and endocrine disruptors.34-36 The artificial
enzyme, which may be a biomimetic catalyst,37 carries out
the same processes performed by the biological catalyst, but it is not necessary to follow the same mechanism. The artificial enzymes on the electrode surfaces will provide the same function as the corresponding enzyme for the detection of its substrates,32-37 and are known as biomimetic
sensors.
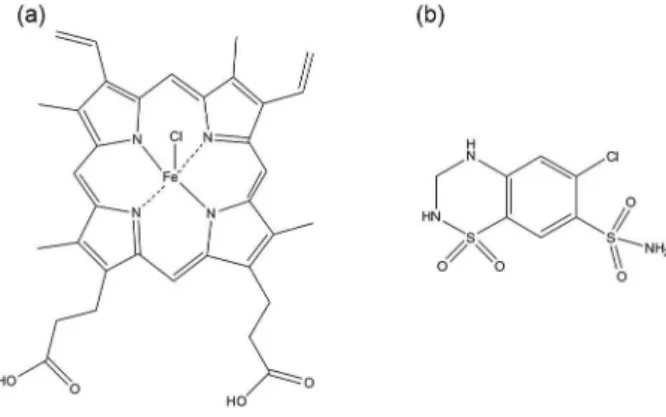
The aim of this work is to develop a sensitive and selective biomimetic sensor for the detection of HCTZ (Figure 1) based on the hemin complex using the amperometry technique. The modifier which was chosen for this work presents many advantages. The hemin is a well-known natural metalloporphyrin and it can be used as a redox biomimetic catalyst, increasing sensitivity of the electrochemical sensor.35 Experimental design
methodologies were used to optimize the measurement conditions and its validation was performed in urine samples and pharmaceutical formulations.
Experimental
Reagents and solutions
The materials used in this work were HCTZ, chloroprotoporphyrin IX iron(III) (hemin), mineral oil and graphite powder (99.99% purity, particle size < 45 µm) and were obtained from Sigma-Aldrich®
. KH2PO4, HCl and
ethanol were purchased from Synth®
, and methanol was provided by J. T. Baker®
. All buffer solutions were prepared with deionized water (Milli-Q Direct-0.3, Millipore®
). The stock solution of hydrochlorothiazide was dissolved in ethanol.
Electrochemical measurements
The electrochemical measurements were carried out using a potentiostat/galvanostat model Autolab PGSTAT30 (Autolab/Eco Chemie). The experimental conditions were controlled with General Purpose Electrochemical System (GPES) software, all measurements were conducted at 25 °C in a conventional electrochemical cell containing of 3 electrodes: a commercial reference electrode (Analion®
) of Ag/AgCl(KClsat), a platinum coil as the counter electrode
and the modified carbon paste as the working electrode. The electroanalytical techniques used in this work were cyclic voltammetry and amperometry. Cyclic voltammetry was firstly performed to investigate the electrochemical behavior of hydrochlorothiazide on the sensor surface. Then, in a next step for quantification of hydrochlorothiazide, the amperometric measurements were subsequently carried out at an adequate potential based on the results of the voltammetric experiments.
Biomimetic sensor construction
The modified carbon paste biomimetic sensor was prepared by mixing of 14 mg of hemin with 86 mg of graphite powder and 1.0 mL of 0.1 mol L-1 phosphate buffer solution
(pH 7.0). The material was carefully homogenized with a stainless steel spatula and left to dry at room temperature. Mineral oil (Nujol) was added to the dry material to obtain the carbon paste. For comparative purposes, carbon pastes were prepared in the presence and in the absence of hemin. The paste was placed into the cavity of a glass tube (4 mm internal diameter, 1 mm depth), and a platinum slide was inserted for electrical contact with the paste.
HPLC analyses
Chromatographic analyses were performed using a Shimadzu®
model 20A liquid chromatograph coupled with SPD-20A UV-Vis detector, a SIL-20A autosampler and a DGU-20A5 degasser. The chromatography system was controlled by a microcomputer. A C18 column (250 mm × 4.6 mm, Shimadzu Shim-Pack CLC-ODS) was used in all chromatographic experiments. The mobile phase was a mixture of methanol, 2.5 × 10⁻³ mol L-1
phosphate buffer at pH 8.0 and water. Gradient elution chromatography was carried out by using the following gradient steps of solvents A (water), B (phosphate buffer at pH 8.0) and C (methanol): 97:3:0 (A:B:C) for 8 min, then 20:80:0 for 8 min at a flow rate of 1.0 mL min-1 with
The absorbance of hydrochlorothiazide was measured at 220 nm.38
Study of selectivity/interference
The selectivity/interference of the sensor was investigated by means of amperometry response to 13 drugs of different pharmacological classes. 1.0 × 10⁻² mol L-1
stock solutions for all drugs were dissolved in the water/ ethanol (9:1 v/v) solution.
Sensor application using pharmaceutical formulations
The two pharmaceutical formulations were of the generic class, one was normal class and the other one of the similar class39 containing 25 mg of HCTZ from
different batches and trademarks were purchased in local drugstores in Araraquara City (Brazil) and were analyzed by the proposed method.
All tablets of each commercial trademark were weighed exactly and ground to a fine powder. A portion of this powder was accurately weighed and dissolved with 10.0 mL of ethanol (proposed method) or methanol (comparative method). These solutions were filtered and aliquot of 2.5 mL of each filtrate was transferred to a 10.0 mL volumetric flask and the volume was completed with water or methanol, respectively.
Sensor application using urine samples
Urine samples were collected from six volunteers. Samples A to F were from healthy people aged between 20 and 60 years. Sample F was collected from a volunteer who consumed two doses of diuretic amiloride daily for the control of arterial pressure. Each sample was enriched with hydrochlorothiazide. An aliquot of 10 mL of the sample was centrifuged for 10 min at 2000 rpm. The supernatant was diluted 2 times with water and the solution was transferred into the voltammetric cell for analysis without any further pretreatment. Standard addition method was used for the determination of HCTZ in real samples and the results were compared with a chromatographic method described in literature.38
Results and Discussion
Electrochemical characterization of HCTZ in the biomimetic sensor
The electrochemical characterization of hydrochloro-thiazide using the proposed biomimetic sensor based on
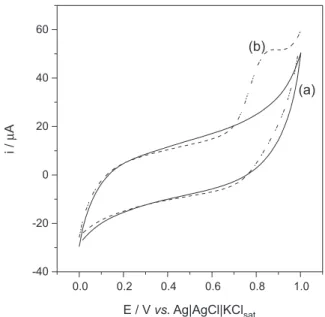
hemin was realized by cyclic voltammetry. Figure 2 shows the cyclic voltammogram in presence of HCTZ which exhibits a behavior related to the irreversible oxidation of the hydrochlorothiazide at a potential of 800 mV.
The oxidation of HCTZ was carried out through experiments varying the scan rate on the cyclic voltammetry to evaluate the electrochemical behavior of the analyte on the sensor surface. Analyzing the anodic peak current as a function of the square root of the scan rate it was possible to visualize a linear dependence (data not shown) in the range between 5 and 200 mV s-1, indicating that the mass transport
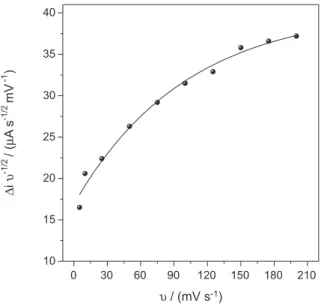
of HCTZ on the sensor surface is controlled by the diffusion. To investigate the possibility of an electrocatalytic process for the HCTZ oxidation on sensor surface a graph was plotted for the scan rate-normalized current (i υ-1/2) against the scan rate (υ) (Figure 3), whose profile suggests that the oxidation of the HCTZ is a chemical/ electrochemical (CE) catalytic process, characterized by two steps, a chemical reaction coupled with an electrochemical process,40 such as it occurs in other biomimetic sensors.41,42
With the results described above, it was possible to propose a mechanism for the sensor (Figure 4). Initially, the chemical reaction (chemical step) between hydrochlorothiazide and molecule of reduced hemin promotes the oxidation of hydrochlorothiazide and reduction of iron in the porphyrin. In the electrochemical step coupled with chemical one, the re-oxidation of metal ion (Fe2+ to Fe3+) in the complex occurs at the electrode
In the next step, in order to evaluate the sensor response for the HCTZ quantification, amperometric experiments were carried out to optimize the analytical parameters influencing its response. The values selected were based on the highest sensitivity from analytical curves obtained in the diverse conditions studied.
Optimization of variables
Factorial and central composite designs are widely used in screening experiments where many variables involved in the reaction are considered in order to identify those with the greatest effects.43 The optimization conditions of the
proposed method were performed by multivariate analysis employing central composite experimental design after prior application of fractional factorial design to select the variable values that maximized the analytical signal.
Initially, a 2(4) full factorial design was carried out,
which allowed simultaneously studying seven factors that
could have an important effect on the current obtained with proposed sensor. The factors of interest were the amount of modifier in the paste (%, m/m), pH, buffer and buffer concentration (mol L-1). All variables that make up the
system were studied at two levels, low (–1) and high (+1), requiring a total of 16 experiments, which were performed in triplicate and randomized to minimize any environmental effects. The highest and lowest values of each variable were defined based on our preliminary experiments.
As the result of the full factorial design, a Pareto chart was drawn in order to visualize the estimated effect of the main variables. It can be observed from Figure 5 that only one variable (pH) was considered be significant.
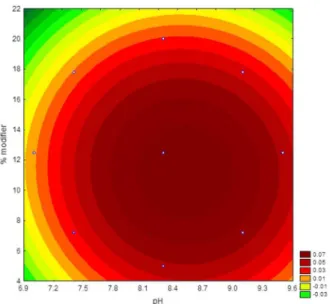
To perform the experiments the central composite design, there must have two variables, choose the variable percentage of modifier to influence the cost of analysis in the proposed sensor. These variables (pH and percentage modifier) were further studied by central composite design at five levels, including four central points for statistical validity within the range –1.41 to +1.41. Figure 6 shows the response surface estimated as a function of pH and percentage of modifier in the paste.
It can be observed from Figure 5 that the optimal region was found and that the maximum response was achieved when pH was 8.5 and the percentage of modifier was 14% m/m. The mathematical model that describes the surface of Figure 5 is the quadratic regression of equation 1:
z = –2.21894 + 0.51456x – 0.03001x2 + 0.01871y –
0.00072y2 – 0.00031xy (1)
where z is the response factor corresponding to the Figure 3. Plot of the scan rate-normalized current density (∆i υ-1/2) vs.
the scan rate (υ). [HCTZ] = 1.0 × 10⁻³ mol L-1 in 0.1 mol L-1 phosphate
buffer solution (pH 7.0).
Figure 4. Schematic representation of a plausible mechanism of response to the proposed biomimetic sensor.
sensitivity value, x is the pH, and y is the percentage of modifiers. In this model the R2 values were greater than
95% also implying that the equation was well fitted by the data at 95% confidence level for the sensitivity of the sensor.
Using the multivariate calibration it was possible to optimize the parameters of the proposed biomimetic sensor for hydrochlorothiazide quantification. Thus, for further experiments the modified paste was prepared with 14% (m/m) of hemin, and the measurements were carried out in 0.1 mol L-1 phosphate buffer at pH 8.5.
Validation
The proposed analytical method was validated in terms of the linear dynamic range, precision, accuracy, limit of detection (LOD), limit of quantification (LOQ), interferences and recovery values. These parameters were obtained using amperometry (Figure 7 inset). A typical calibration curve (Figure 7) showed a good linearity in the concentration range of 2.0 × 10⁻⁵ and 1.2 × 10⁻⁴ mol L-1.
The value of the coefficient of determination (R2) obtained
was 0.993 ± 0.001 whereas the slope obtained from the analytical curve was 85671 ± 2457.
The LOD and LOQ were calculated according to the Brazilian National Health Surveillance Agency (ANVISA) recommendations.44 The LOD and LOQ were 5.8 × 10⁻⁶
and 1.9 × 10⁻⁵ mol L-1. These values are comparable with
values reported by other research groups for electrocatalytic oxidation of HCTZ obtained by electrochemical methods (Table 1).
The precision of the proposed method was evaluated using three inter-days and three intra-days replicate (n = 5 for each experiment) for a 1.0 × 10⁻³ mol L-1 HCTZ standard
solution. The relative standard deviations for inter-day and intra-day measurements were 4.2 and 4.6%, respectively. These levels of precision were considered to be acceptable for the employed method.
Figure 6. Central composite design response surface obtained for sensitivity values as a function of pH and percentage of modifiers.
Figure 7. Analytical curve of the proposed sensor. Measurements performed under optimized conditions. Inset: a typical amperogram obtained for successive additions of hydrochlorothiazide. Applied potential of 0.8 mV.
Table 1. Comparison of the efficiency of some methods in the determination of HCTZ
Electrode Technique Linear range / (mol L-1) LOD / (mol L-1) Reference
Mercury electrode DPP 8.0 × 10⁻⁵-3.2 × 10⁻⁴ – 17
Carbon paste, modified with ferrocenedicarboxylic SWV 8.0 × 10⁻⁸-5.0 × 10⁻⁴ 3.7 × 10⁻⁸ 18 Carbon nanotubes/silicone rubber composite electrode DPV 5.0 × 10⁻⁶-7.0 × 10⁻⁵ 2.6 ×10⁻⁶ 19 Benzoylferrocene modified multi-walled carbon nanotube paste electrode SWV 6.0 × 10⁻⁷-3.0 × 10⁻⁴ 9.0 × 10⁻⁸ 20
Boron-doped diamond DPV 3.0 × 10⁻⁶-7.4 × 10⁻⁵ 1.2 × 10⁻⁶ 21
Study of the biomimetic characteristics of sensor
Since hemin is a recognized biomimetic catalyst of the oxide-reductase P450 enzyme,35 its biomimetic character
was investigated in the previously optimized conditions. A hyperbolic profile was obtained (Figure 8 inset) besides the linear range of concentrations, which is characteristic of enzymatic biosensors and biomimetic sensors that follow Michaelis-Menten kinetics.23 A Lineweaver-Burk graph
(Figure 8) was constructed in order to calculate the apparent Michaelis-Menten constant (KMM
app) for hydrochlorothiazide
on the proposed sensor. The value of 1.2 × 10⁻³ mol L-1
indicates a good affinity between the catalyst (hemin) and the analyte.
A useful biomimetic sensor must show a high level of selectivity. In order to evaluate the selectivity/ interference of the proposed sensor, its response was tested with the following drugs in the concentration of 1.0 × 10⁻² mol L-1: bumetanide, furosemide, methyldopa,
captopril, ketoprofen, ciprofloxacin, aminophylline, nifedipine, urea, uric acid, ascorbic acid and xanthine. Different pharmacological classes were studied because the general use of hydrochlorothiazide is associated with the other drug. The substances urea, uric acid, ascorbic acid and xanthine were assessed as possible interferences, because these are present in the urine. The results obtained showed that the sensor was highly selective for hydrochlorothiazide, and only bumetanide caused a small interference in the analysis, because it also belongs to the class of diuretics.
Application
The proposed sensor for HCTZ was applied using four samples of pharmaceutical formulations (Table 2) and six enriched samples of human urine (Table 3).
The results obtained for the two methodologies were very close, including the values obtained for the “similar” pharmaceutical formulation that showed a value only 70% of the expected, and showed the reliability of the proposed sensor.
The proposed method was compared statistically (using t-tests at 95% of confidence level) with the comparative method38 and showed good agreement
Table 2. Determination of hydrochlorothiazide in pharmaceutical formulations
Samplea
Amount of HCTZ per tabletb / mg
t-Testc Proposed
method
Comparative method
A (generic) 24.3 ± 0.6 24.994 ± 0.005 1.81
B (generic) 24.7 ± 0.7 25.700 ± 0.003 2.14
C (normal) 29.8 ± 0.9 30.800 ± 0.003 1.78
D (similar) 17.3 ± 0.8 19.000 ± 0.002 3.52
aDeclared value: 25 mg hydrochlorothiazide per tablet; bstandard deviation of three replicates; ccritical values of t at 95% confidence level, t
t = 4.303. Values obtained considering the value supplied by the comparative method as true.
Figure 8. Lineweaver-Burk plot for the HCTZ oxidation catalyzed by the hemin-based sensor. Inset: hyperbolic profile of the sensor.
Table 3. Recoveries of hydrochlorothiazide added to urine samples
Samplea Proposed method Comparative method t-Testc
Foundb/ (×10-3 mol L-1) Recovery / % Foundb/ (×10-3 mol L-1) Recovery / %
A 0.97 ± 0.03 96 1.0200 ± 0.0004 102 3.34
B 0.97 ± 0.03 96 1.0300 ± 0.0001 103 3.19
C 0.95 ± 0.05 95 1.010 ± 0.001 101 2.09
D 0.97 ± 0.02 96 1.0100 ± 0.0001 101 3.46
E 1.05 ± 0.03 105 1.0400 ± 0.0001 104 0.56
F 1.09 ± 0.04 109 1.0500 ± 0.0001 105 1.87
aAdded value: 1.0 × 10⁻³ mol L-1; bstandard deviation of three replicates; ccritical values of t at 95% confidence level, t
(Tables 1 and 2). The calculated t-values did not exceed the critical ones, indicating that there was no significant difference between the two methods in terms of precision and accuracy.
The results confirm the viability of this proposed sensor for reliable, simple and cheap method for HCTZ determination in quality control and in the combat against doping in sports.
Conclusions
The proposed sensor presents a viable alternative to the determination of hydrochlorothiazide in a simple, rapid, selective and sensitive way for the application in doping and quality control. It is also cost effective, safer and environmentally friendly compared with other methods reported in the literature. The technique is sufficiently precise and accurate to offer an attractive alternative in the control of sports doping.
Acknowledgements
The authors are thankful to National Council for Scientific and Technological Development (CNPq), Brazil, for the financial support for this research project (Process No. 400459/2012-4).
References
1. Hardman, J. G.; Limbird, L. E.; Gilman, A. G.; Goodman & Gilman’s The Pharmacological Basis of Therapeutics, 12th ed.;
McGraw-Hill: New York, 2010.
2. Niemeyer, C.; Hasenfuss, G.; Wais, U.; Knauf, H.; Schaferkorting, M.; Mutschler, E.; Eur. J. Clin. Pharmacol.
1983, 24, 661.
3. Beermann, B.; Groschinsky-Grind, M.; Eur. J. Clin. Pharmacol.
1977, 12, 297.
4. Delbeke, F. T.; Debackere, M.; Biopharm. Drug Dispos.1988,
9, 137.
5. https://wada-main-prod.s3.amazonaws.com/resources/files/ wada-2015-prohibited-list-en.pdf accessed in July 2015. 6. Segura, J.; Ther. Drug Monit. 1996, 18, 471.
7. Verroken, M.; Bailliere’s Best Pract. Res., Clin. Endocrinol. Metab. 2000, 14, 1.
8. Moreira, V.; Moreau, R. L. M.; J. Liq. Chromatogr. Relat. Technol. 2005, 28, 2753.
9. Morra, V.; Davit, P.; Capra, P.; Vincenti, M.; Di Stilo, A.; Botre, F.; J. Chromatogr. A2006, 1135, 219.
10. Ozkan, S. A.; J. Liq. Chromatogr. Relat. Technol. 2001, 24, 2337.
11. Khedr, A.; El-Sherief, H.; Biomed. Chromatogr. 1998, 12, 57.
12. Ouyang, J.; Baeyens, W. R. G.; Delanghe, J.; Vander-Weken, G.; De-Keukeleire, D.; Daele, W.; Garcia-Campana, A. M.; Calokerinos, A. C.; Biomed. Chromatogr.1998, 12, 160. 13. Ouyang, J.; Baeyens, W. R. G.; Delanghe, J.; Vander-Weken, G.;
De-Keukeleire, D.; Daele, W.; Garcia-Campana, A. M.; Calokerinos, A. C.; Biomed. Chromatogr.1998, 12, 162. 14. Carda-Broch, S.; Esteve-Romero, J. S.; Garcia-Alvarez-Coque,
M. C.; Analyst1998, 123, 301.
15. Macher, M.; Wintersteiger, R.; J. Chromatogr. A1995, 709, 257.
16. Siren, H.; Hussa, T.; Min, Y.; Analyst2000, 125, 1561. 17. Martin, M. E.; Hernandez, O. M.; Jimenez, A. I.; Arias, J. J.;
Jimenez. F.; Anal. Chim. Acta1999, 381, 247.
18. Karimi-Maleh, H.; Ensafi, A. A.; Ensafi, H. R.; J. Braz. Chem. Soc. 2009, 20, 880.
19. Dos Santos, S. X.; Cavalheiro, E. T. G.; Anal. Lett. 2012, 45, 1454.
20. Beitollahi, H.; Ghorbani, F.; Ionics2013, 19, 1673.
21. Santos, M. C. G.; Tarley, C. R. T.; Dall’Antonia, L. H.; Sartori, E. R.; Sens. Actuators, B2013, 188, 263.
22. Beitollahi, H.; Hamzavi, M.; Torkzadeh-Mahani, M.; Mater. Sci. Eng., C2015, 52, 297.
23. Tajik, S.; Tahe, M. A.; Beitollahi, H.; J. Electroanal. Chem.
2013, 704, 137.
24. Sartori, E. R.; Fatibello-Filho, O.; Electroanalysis2012, 24, 687.
25. Sartori, E. R.; Medeiros, R. A.; Rocha-Filho, R. C.; Fatibello-Filho, O.; Talanta2010, 81, 1418.
26. Beitollahi, H.; Sheikhshoaie, I.; J. Electroanal. Chem.2011,
661, 336.
27. Nasir, M. Z. M.; Pumera, M.; Electroanalysis 2014, 26, 1090. 28. Mohammadi, S. Z.; Beitollahi, H.; Jasemi, M.; Akbari, A.;
Electroanalysis, in press, DOI: 10.1002/elan.201500245. 29. Beitollahi, H.; Sheikhshoaie, I.; Anal. Methods2011, 3, 1810. 30. Molaakbari, E.; Mostafavi, A.; Beitollahi, H.; Alizadehd, R.;
Analyst2014, 139, 4356.
31. Chen, P.; Chen, Z.; Li, A.; Lou, X. C.; Wu, X. K.; Zhao, C. J.; Wang, S. L.; Liang, L. P.; Biomed. Environ. Sci. 2008, 21, 233. 32. Sotomayor, M. D. P. T.; Kubota, L. T.; Quim. Nova2002, 25,
123.
33. Liu, L.; Gou, L. P.; Bo, X. J.; Bai, J.; Cui, X. J.; Anal. Chim. Acta2010, 673, 88.
34. Sono, M.; Roach, M. P.; Pariza, E. D.; Dawson, J. H.; Chem. Rev.1996, 96, 2841.
35. Chorghade, M. S.; Lee, D. R. H. C.; Pariza, R. J.; Pure Appl. Chem. 1996, 68, 753.
36. Danielson, P. B.; Curr. Drug Metab. 2002, 3, 561.
38. Vetuschi, C.; Giannandrea, A.; Anal. Lett.2003, 36, 1051. 39. http://portal.anvisa.gov.br/wps/content/Anvisa+Portal/
Anvisa/Inicio/Medicamentos/Assunto+de+Interesse/ Medicamentos+similares accessed in July 2015.
40. Bard, A. J.; Faulkner, R. D.; Electrochemical Methods: Fundamentals and Applications, 2nd ed.; Wiley: New York,
2001.
41. Ruy, M. R. S.; Figueira, E. C.; Sotomayor, M. D. P. T.; Anal. Methods2014, 6, 5792.
42. Boni, A. C.; Sotomayor, M. D. P. T.; Lanza, M. R. V.; Tanaka, S. M. C. N.; Tanaka, A. A.; J. Braz. Chem. Soc. 2010, 21, 1377.
43. Silva, A. S.; Fernandes, F. C. B.; Tognolli, J. O.; Pezza, L.; Pezza, H. R.; Spectrochim. Acta, Part A2011, 79, 1881. 44. http://portal.anvisa.gov.br/wps/wcm/connect/4983b0004745
975da005f43fbc4c6735/RE_899_2003_Determina+a+public a%C3%A7%C3%A3o+do+Guia+para+valida%C3%A7%C3 %A3o+de+m%C3%A9todos+anal%C3%ADticos+e+bioanal %C3%ADticos.pdf?MOD=AJPERES, accessed in July 2015.
Submitted: June 6, 2015 Published online: July 31, 2015