Enantiomeric quantification of psychoactive
substances and beta blockers by gas
chromatography-mass spectrometry in
influents of wastewater treatment plants
Ricardo Daniel Teixeira Gonçalves
Dissertation of the 2nd Cycle of Studies Conducive to the Master’s Degree in Clinical and Forensic Analytical Toxicology, Faculty of Pharmacy, University of Porto
Work performed under the orientation of: Professor Doctor Maria Elizabeth Tiritan Professor Doctor Cláudia Maria Rosa Ribeiro
IT IS NOT PERMITED TO REPRODUCE ANY PART OF THIS DISSERTATION DE ACORDO COM A LEGISLAÇÃO EM VIGOR, NÃO É PERMITIDA A
i
Agradecimentos
Em primeiro lugar gostaria de agradecer às minhas orientadoras (ou mães da ciência), a Professora Doutora Maria Elizabeth Tiritan e a Professora Doutora Cláudia Ribeiro por me terem aceitado (adotado) para poder continuar este projeto. Obrigado por me ajudarem na iniciação de um projeto de raiz, que depois de quatro anos e muitas frustrações, vejo que não foi em vão. Por toda a ajuda, insistência, paciência, preocupação e compreensão que sempre tiveram, o maior obrigado!
À Dra. Sara Cravo do laboratório de química orgânica da FFUP, que me recebeu de braços abertos, batalhou comigo durante meses e me deixou usar e abusar do seu laboratório de cromatografia gasosa. Obrigado por toda a ajuda, paciência, explicações, disponibilidade e acima de tudo, por me compreender nos momentos mais desesperantes. Estou-lhe profundamente grato por me fazer sentir “em casa” e por sempre arranjar soluções! Ao Professor Doutor Carlos Afonso do laboratório de química orgânica da FFUP por me autorizar a invadir o laboratório de química orgânica e pela preocupação constante com o progresso do trabalho. À Doutora Sara Cunha e Professor Doutor José Oliveira Fernandes, por me aceitarem nesta reta final para poder concluir com sucesso esta dissertação. Obrigado!!
A todo o pessoal do laboratório de química da CESPU, que sempre me aturaram, trataram às mil maravilhas e estiveram sempre prontas a ajudar. Obrigado!
Aos meus pais, pois é a eles a quem devo estar nesta etapa da minha vida. Estou-vos profundamente grato por todo o apoio e esforço que sempre fizeram para que eu conseguisse chegar até aqui. Muito obrigado, do fundo do coração!
Gostaria também de agradecer às meninas que também se dizem estudantes de mestrado, Ariana Pereira e Cristiana Santos, por criarem um ambiente ótimo no laboratório. Graças a vocês o desespero foi muito menor!
À Maria Miguel Coelho (que aposto que já pensava que me ia esquecer dela), porque estivemos juntos nesta batalha e com o maior orgulho posso dizer que conseguimos!! Um obrigado muito, muito especial, pela pessoa que és e pelo companheirismo durante estes 2 anos. Espero, num futuro, poder trabalhar contigo novamente. Força, foco e fé!
Ao “desesperados” de toxicologia (por ordem alfabética) Eva Martins, João Alexandre, Rita Guedes e Vera Silva, por não me deixarem sofrer sozinho, pelos 10^36 cafés diários, pelo “apanhamento” de sol nos tempos mortos e principalmente, pelos incentivos à caça furtiva em ambiente académico, que me valeram umas gargalhadas valentes! Muito obrigado e que o “Erundino” nos una novamente!
Agradeço também aos meus “outros amigos” João Viana, Joaquin Pereira, Leonor Ferreira, Luis Pereira, Margarida Fernandes, Marlene Pinheiro, Marta Carvalho, Pedro Cruz, Tânia
ii
Amorim, Vanessa Barbosa e Tiago Azevedo por todos os excelentes momentos que passamos juntos, por me ajudarem a aliviar o stress e a não desanimar. Se os amigos são para as ocasiões, vocês merecem a medalha de ouro!!! Muito obrigado!
À CESPU, ao Instituto de Investigação e Formação Avançada em Ciências e Tecnologias da Saúde (Iinfacts) e ao grupo de investigação por terem cedido as instalações e todo o equipamento laboratorial.
iii This work was developed in Laboratório de Química Orgânica e Farmacêutica e Laboratório de Bromatologia e Hidrologia, Departamento de Ciências Químicas da Faculdade de Farmácia da Universidade do Porto and in Instituto de Investigação e Formação Avançada em Ciências e Tecnologias Saúde (IINFACTS)-IUCS-CESPU. This work was partially supported through national funds provided by FCT/MCTES - Foundation for Science and Technology from the Minister of Science, Technology and Higher Education (PIDDAC) and European Regional Development Fund (ERDF) through the COMPETE – Programa Operacional Factores de Competitividade (POFC) programme, under the Strategic Funding UID/Multi/04423/2013 and BIOENVIROM-CESPU-2018.
Thanks to Professor Doctor Félix Carvalho and the Toxicology Laboratory of the Faculty of Pharmacy for the kind donation of the MDMA used in this dissertation.
Special thanks to INFARMED for all the help and speed to the answers, as the data provided were essential for the development of this study.
v Some of the results presented in this dissertation were presented in the following scientific communications:
Poster communications
Ricardo Gonçalves, Cláudia Ribeiro, Maria Elizabeth Tiritan, Development of a gas chromatography-mass spectrometry method for quantification of chiral drugs in surface waters. 11th edition of the Youth Research Meeting of the University of Porto (IJUP18),
Porto, Portugal, February 7 – 9, 2018:
Ricardo Gonçalves, Ivan Langa, Cláudia Ribeiro, Maria Elizabeth Tiritan, Desenvolvimento de métodos analíticos por GC-MS para quantificação de drogas quirais. X Jornadas Científicas do Departamento de Ciências do Instituto Universitário de Ciências da Saúde / III Congresso da Associação Portuguesa de Ciências Forenses, Porto, Portugal, May 24 -25, 2018
Ricardo Gonçalves, Cláudia Ribeiro, Sara Cravo, Carlos Afonso, Maria Elizabeth Tiritan, GC-MS analytical method to quantify chiral drugs for waste-water based epidemiology studies. 11th International Symposium on Drug Analysis & 29th International Symposium on Pharmaceutical and Biomedical Analysis, Leuven, Belgium, September 9 - 12, 2018.
vii
Abstract
Currently, consumption of illicit and pharmaceuticals used as drugs of abuse has increased dramatically. After consumption, residues of these substances and their metabolites are excreted in the urine and feces being discarded into wastewater treatment plants (WWTPs), where they are ineffectively removed. In this sense, several studies have demonstrated the occurrence of residues of drugs and their metabolites in the aquatic ecosystems and particularly in high concentrations in the effluents from WWTPs. These biologically active substances are continuously released into the environment making them pseudo-persistent and potentially harmful to the health of all living organisms, including humans. Many of these drugs are chiral and can be commercially available as racemate or enantiomerically pure. In achiral environments, the enantiomers of a chiral substance behave similarly; however, in chiral environments, such as living organisms, they may exhibit different pharmacokinetic, pharmacodynamic, and toxicity activities.
Regarding the forensic area, discrimination of the enantiomers as well as determination of the enantiomeric profile is useful for: distinguishing between the consumption of legally prescribed drugs and illegally synthesized drugs; distinguishing between methods and possible synthesis sites; illegal discharge of sewage or WWTP and estimation of illicit drugs and pharmaceuticals consumption by a community (sewage epidemiology).
The objectives of this dissertation are the development and validation of an indirect method by gas chromatography–mass spectrometry (GC-MS) for the quantification of 11 chiral substances of forensic interest namely psychoactive drugs and β-blockers based on the formation of diastereomers using (R)-(−)-α-Methoxy-α-(trifluoromethyl)phenylacetyl chloride ((R)-MTPA-Cl) as chiral derivatization reagent; to verify the applicability of the method in influents of a WWTP and back-calculate to determine the consumption of the target chiral substances in a specific population. Validation of the method was performed for 11 substances. Linearity has showed a R2 > 0.99 for all substances. LOD was between 0.03 and 52.1 ng L-1. LOQ ranged from 0.15 and 125 ng L-1. Results showed the occurrence of amphetamine (AMP), methamphetamine (MAMP), 3,4-methylenedioxyamphetamine (MDMA), alprenolol (ALP), norfluoxetine (NFLX), fluoxetine (FLX), metoprolol (MET), propranolol (PHO) and sertraline (SER) at concentrations ranging from 19.1 ng L-1 (MAMP) to 4948.1 ng L-1 (FLX) in a influent from a WWTP. The enantiomeric fraction (EF) were determined and showed differences in the enantiomeric composition of these drugs. The presence of racemates of AMP (EF = 0.42), ALP (EF = 0.49), FLX (EF = 0.48) and PHO (EF = 0.45) and single enantiomers for MAMP (EF ≅1), MDMA (EF ≅1), NFLX (EF ≅0) and MET (EF ≅1) were observed and thus suggesting enantioseletive processes.
viii
Keywords: Chiral Derivatization Reagent, Chiral Drugs, Enantiomeric Profiling, GC-MS, Wastewater-based Epidemiology
ix
Resumo
Atualmente, o consumo de drogas ilícitas e de medicamentos legalmente prescritos usados como droga de abuso tem aumentado de forma acentuada. Após consumo, os resíduos destas substâncias e dos seus metabolitos são excretados na urina e fezes sendo descartados para os sistemas de tratamento de águas residuais (ETAR) onde não são ineficazmente eliminados. Neste sentido, vários estudos têm demonstrado a ocorrência de drogas ilícitas e de fármacos assim como dos seus metabolitos nos ecossistemas aquáticos e principalmente nos efluentes das ETAR. Estas substâncias biologicamente ativas são continuamente lançadas para o ambiente tornando-se pseudo-persistentes e potencialmente nefastas para a saúde de todos os organismos vivos incluindo o homem. Muitas destas substâncias são quirais podendo ser comercializadas como racemato ou na forma enantiomericamente pura. Em ambientes aquirais, os enantiómeros comportam-se de forma semelhante, no entanto, em ambientes quirais, como é o caso dos sistemas biológicos, estes podem apresentar atividades farmacocinéticas, farmacodinâmicas e toxicidades diferentes.
Na área forense, a discriminação dos enantiómeros assim como a determinação do perfil enantiomérico é útil para: distinção entre o consumo de medicamentos legalmente prescritos e de drogas ilegalmente sintetizadas; distinção entre métodos e possíveis locais de síntese; descargas ilegais de esgotos ou de ETAR, e estimativa do consumo de drogas/ fármacos por uma determinada comunidade (sewage epidemiology).
Os objetivos desta dissertação são o desenvolvimento e validação de um método indireto por cromatografia gasosa acoplada à espetrometria de massa (GC-MS) para a quantificação de 11 substâncias quirais de interesse forense, nomeadamente substâncias psicoativas e bloqueadores beta baseando-se na formação de diastereoisómeros usando cloreto de (R)-(−)-α-Metoxi-α-(trifluorometil)fenilacetilo ((R)-MTPA-Cl) como reagente de derivatização quiral; verificar a aplicabilidade do método em afluentes de ETAR e estimar o consumo das substâncias quirais alvo. O método foi validado para 11 compostos. A linearidade foi assegurada com R2 > 0.99 para todas as substâncias. Os limites de deteção variaram de 0,03 a 52,1 ng L-1 e os limites de quantificação entre 0,15 a 125 ng L-1. Os resultados demostraram a presença de anfetamina (AMP), metanfetamina (MAMP), 3,4-metilenodioximetanfetamina (MDMA), alprenolol (ALP), norfluoxetina (NFLX), fluoxetina (FLX), metoprolol (MET), propranolol (PHO) e sertralina (SER) em concentrações de 19,1 ng L-1 (MAMP) a 4948,1 ng L-1 (FLX). A fração enantiomérica (EF) foi determinada e mostrou diferenças na composição enantiomérica destas substâncias. A presença de racematos para a AMP (EF = 0.42), ALP (EF = 0.49), FLX (EF = 0.48) e PHO (EF = 0.45) e predominância de um dos enantiómero no caso da MAMP (EF ≅1), MDMA (EF ≅1),
x
NFLX (EF ≅0) e MET (EF ≅1) foi observada sugerindo diferentes processos enantiosseletivos.
Palavras-chave: Caracterização enantiomérica, Estimativa de consumo, GC-MS, Reagente de derivatização quiral, Substâncias quirais
xi
Index
Abstract ... vii
Resumo ... ix
Index of figures ... xiii
Index of tables ... xv
Index of Equations ... xvii
List of abbreviations ... xix
1. Introduction ... 1
1.1. Chiral psychoactive substances and β-blockers ... 1
1.2. Occurrence of chiral psychoactive substances and β-blockers in the environment 7 1.3. Wastewater-based epidemiology and enantiomeric profiling ... 9
2. Material and Methods ... 13
2.1. Chemicals, standards and materials ... 13
2.3. Derivatization procedure ... 17
2.4. GC-MS conditions ... 18
2.5. Sampling collection ... 18
2.6. Solid phase extraction ... 19
2.7. Method parameters and validation ... 19
3. Results and Discussion ... 21
3.1. Optimization of the derivatization procedure of target substances with enantiomerically pure reagent ... 21
3.2. Optimization of SPE procedure ... 24
3.3. Optimization of GC-MS conditions ... 25
3.4. Validation of the analytical method ... 41
3.5. Monitoring of influent of WWTP and consumption estimative ... 43
xiii
Index of figures
Figure 1 - Representation of two enantiomers connecting to a biological molecule
according to the four-location model. (adapted from (11)) ... 2
Figure 2 - Number of US Food and Drug Administration (FDA)-approved new molecular
entities (NMEs) regarding their chirality from 2002 to 2014. (adapted from (14, 15)). . 4
Figure 3 - Percentage of FDA-approved NMEs regarding their chirality from 2002 to 2014.
... 5
Figure 4 – Number of betablockers’ units sold by medical prescription at Portuguese
Health National Service and public subsystems, from January 1st 2015 to May 31st 2018. Hospital usage not included. Data from Centro de Conferência de Facturas, provided by INFARMED, I.P. ... 6
Figure 5 - Number of antidepressants’ units sold by medical prescription at Portuguese
Health National Service and public subsystems, from January 1st 2015 to May 31st 2018. Hospital usage not included. Data from Centro de Conferência de Facturas, provided by INFARMED, I.P. ... 6
Figure 6 - Wastewater-based epidemiology approach. (adapted from (25)). ... 9 Figure 7 - Reaction between MDMA and the chiral derivatization reagent
(R)-(+)-α-Methylbenzyl isocyanate. ... 22
Figure 8 - Reaction between MAMP and the chiral derivatization reagent
(R)-(−)-3-Methyl-2-butyl isocyanate. ... 23
Figure 9 - Reaction between FLX and the chiral derivatization reagent (R)-MTPA-Cl. .... 23 Figure 10 – Reaction of ALP derivative after reaction with (R)-MTPA-Cl, and the
derivatization reagent MSTFA. ... 23
Figure 11 – Optimization of SPE procedure, skipping the conditioning step. ... 24 Figure 12 - Best separation of the diastereomers of FLX (red), NFLX (green), AMP and
MAMP (orange) in GC-MS 1 system. ... 26
Figure 13 – Chromatograms of the diastereomers of AMP and MAMP with 0.7 (above),
1.0 (middle) and 0.8 (below) mL/min flows in GC-MS 1 system. ... 26
Figure 14 – Fragment 404 resulting from fragmentation of β-blockers. Trimethylsilyl group
in red circle (m/z = 73). ... 28
Figure 15 – Full chromatogram with temperature program 14 in SIM mode with a
standard mixture of target compounds in MeOH at 25 µg mL-1 concentration: AMP, MAMP, MDMA, NK,, ALP, NFLX, FLX, MET, PHO, BIS, SER, and PAR
diastereoisomers. ... 29
Figure 16 - Chromatogram of AMP diastereomers (above) and respective mass spectra
xiv
Figure 17 - Chromatogram of MAMP diastereomers (above) and respective mass spectra
(below) with molecular structure and possible of fragment pattern. ... 31
Figure 18 - Chromatogram of MDMA diastereomers (above) and respective mass spectra
(below) with molecular structure and possible fragmentation pattern. ... 32
Figure 19 - Chromatogram of NK diastereomers (above) and respective mass spectra
(below) with molecular structure and possible fragmentation pattern. ... 33
Figure 20 - Chromatogram of ALP diastereomers (above) and respective mass spectra
(below) with molecular structure and possible fragmentation pattern. ... 34
Figure 21 - Chromatogram of NFLX diastereomers (above) and respective mass spectra
(below) with molecular structure and possible fragmentation pattern. ... 35
Figure 22 - Chromatogram of FLX diastereomers (above) and respective mass spectra
(below) with molecular structure and possible fragmentation pattern. ... 36
Figure 23 - Chromatogram of MET diastereomers (above) and respective mass spectra
(below) with molecular structure and possible fragmentation pattern. ... 37
Figure 24 - Chromatogram of PHO diastereomers (above) and respective mass spectra
(below) with molecular structure and possible fragmentation pattern. ... 38
Figure 25 - Chromatogram of BIS diastereomers (above) and respective mass spectra
(below) with molecular structure and possible fragmentation pattern. ... 39
Figure 26 - Chromatogram of SER (above) and respective mass spectra (below) with
molecular structure and possible fragmentation pattern. ... 40
Figure 27 - Chromatogram of PAR (above) and respective mass spectra (below) with
xv
Index of tables
Table 1 - Examples of chiral psychoactive drugs and β-blockers and the biological effects
of their enantiomers. ... 2
Table 2 - Chiral drugs commercialized either as racemates or single enantiomers.
Adapted from (16). ... 5
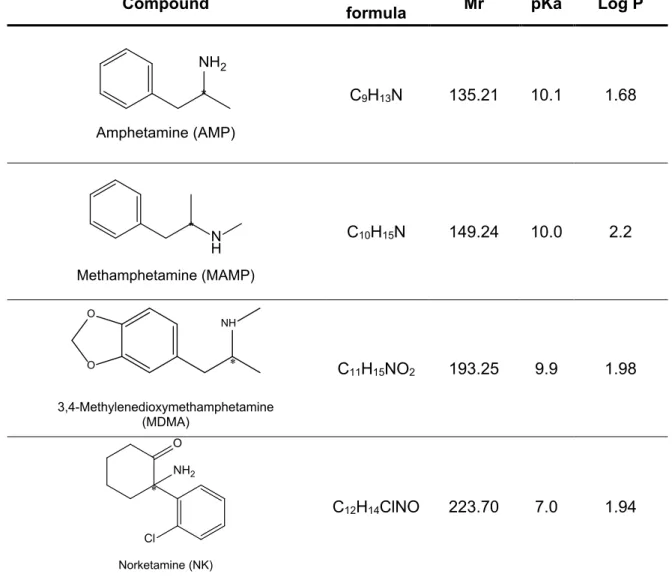
Table 3 - Target compounds selected for this work, molecular formula, relative molecular
mass (Mr), pKa and Log P. ... 13
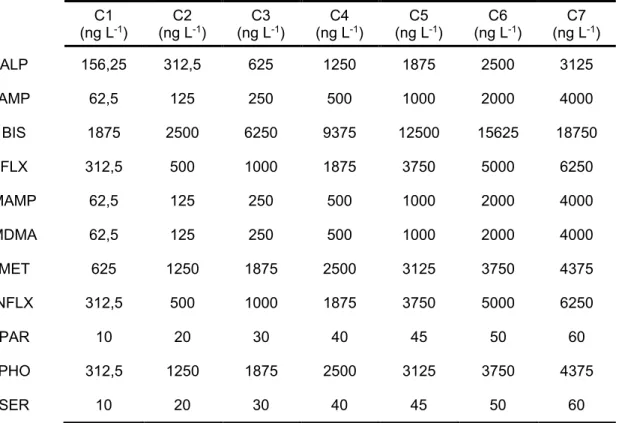
Table 4 - Concentrations (ng L-1) of each enantiomers of the target compound used for the calibration curve. ... 20
Table 5 - Target compounds, Rt of the diastereomers and fragmentation ions. * -
quantification ion ... 27
Table 6 - Linearity parameters and method detection (LOD) and quantification limits
(LOQ). ... 41
Table 7 – Concentration, drug loads and enantiomeric fraction (EF) of several compounds
xvii
Index of Equations
Equation 1 - Drug loads in mg 1000 inh.-1 d-1. Concentration of DTR, influent flow of WWTP and population served by the WWTP are considered to calculate drug loads. ... 10
Equation 2 - Consumption in mg 1000 inh.-1 d-1. In this equation are applied correction factor such as stability and excretion of DTR and molecular weight of the drug and DTR. ... 10
xix
List of abbreviations
(R)-MTPA-Cl (R)-(−)-α-Methoxy-α-(trifluoromethyl)phenylacetyl chloride
ACN Acetonitrile ALP Alprenolol AMP Amphetamine ATE Atenolol BIS Bisoprolol BUP Bupropion CAR Carvedilol
CDR Chiral derivatization reagent CNS Central nervous system
COC Cocaine
CSP Chiral stationary phase
D1 Diastereomer 1
D2 Diastereomer 2
DTR Drug target residues
DUL Duloxetine
EF Enantiomeric fraction
EI Electron impact
EM Extensive metabolizers EtAc Ethyl acetate
EtOH Ethanol
FDA US Food and Drug Administration
FLX Fluoxetine
GC Gas chromatography
GC-MS Gas chromatography coupled to mass spectrometry HPLC High Performance Liquid Chromatography
IS Internal-standard
K Ketamine
LC Liquid chromatography LOD Limit of detection LOQ Limit of quantification LSD Lysergic acid diethylamide
xx
MCX Mixed cation exchange
MDA 3,4-methylenedioxyamphetamine MDMA 3,4-methylenedioxymethamphetamine MeOH Methanol MET Metoprolol MIR Mirtazapine MSTFA N‐methyl‐N-trimethylsilyltrifluoroacetamide
Mr Relative molecular mass
NCOC Norcocaine
NEB Nebivolol
NFLX Norfluoxetine
NK Norketamine
NPS New psychoactive substances OD-VEN O-desmethylvenlafaxine PAR Paroxetine PHO Propranolol RT Room temperature RW Raw wastewater S/N Signal-noise ratio SAL Salbutamol SER Sertraline
SIM Single ion monitoring SPE Solid phase extraction
TEA Triethylamine
THF Tetrahydrofuran anhydrous TMCS Trimethylchlorosilane UPW Ultra-pure water
VNF Venlafaxine
WADA World Anti-Doping Agency WBE Wastewater-based epidemiology Δ9-THC Δ9-tetrahydrocannabinol
1
1. Introduction
1.1.
Chiral psychoactive substances and β-blockers
Currently, most of the drugs in the market are chiral compounds (1). Many chiral drugs are of toxicological and forensic interest. Among them, psychoactive drugs have gained special attention due to their increasing consumption levels (2, 3). Those drugs encompass legally prescribed pharmaceuticals and illicit substances designed to change human behavior. Some of these psychoactive drugs have the potential of misuse due to their psychotropic effects and are often referred as drugs of abuse. These include classic ones such as amphetamine (AMP), methamphetamine (MAMP), 3,4-methylenedioxymethamphetamine (MDMA, commonly known as ecstasy), 3,4-methylenedioxyamphetamine (MDA), ketamine (K), lysergic acid diethylamide (LSD), nicotine, cocaine (COC), heroin, morphine, Δ9 -tetrahydrocannabinol (Δ9-THC), among others. It is estimated that 13.5 million European adults aged from 15 to 64 have tried MDMA during their lives, and 2.2 million young adults (15–34) used MDMA in 2017, being individuals in this age range the highest consumers (2). Of particular note are the new psychoactive substances (NPS), the so-called “legal highs”, like derivatives of cathinones (e.g. mepherone, methylone), piperazines and synthetic cannabinoids synthesized to mimic the effects of controlled drugs but lacking legislation (4, 5). Nonetheless, other psychoactive drugs such as antidepressants are also of particular attention since they are considered non-addictive but many people abuse of these drugs (6).
Regarding other chiral drugs of forensic interest are the blockers also known as β-adrenergic blocking agents widely used in the management of hypertension, ischemic heart disease, treatment of tachyarrhythmias, congenital heart disease and anxiety states (7). These compounds are included in prohibited list according to the World Anti-Doping Agency (WADA) regulation because of the improvement of the psychomotor performance. Also, the reduction of the anxiety states could be a reason to the abusive consumption of β-blockers in the modern society. Propranolol (PHO), for example, has the ability to cross blood-brain barrier, resulting in central nervous system depression (7, 8).
In biological systems, it is well known that enantiomers of chiral drugs may exhibit different pharmacological and /or toxicological activities since most biological molecules are also chiral and usually present in only one chiral form. In fact, chiral molecules have different spatial rearrangement of atoms and thus, interact in a different manner with chiral biological molecules and, consequently, may produce different effects (9, 10). Recently, Mesecar and Koshland, suggested that sometimes, four interaction points are required for a chiral substance interaction with any chiral molecule in a biological system (11). A representation
2
of this model is present in Figure 1. Table 1 shows examples of different chiral psychoactive
drugs and β-blockers and the biological effects of their enantiomers.
Figure 1 - Representation of two enantiomers connecting to a biological molecule according to the
four-location model. (adapted from (11))
Table 1 - Examples of chiral psychoactive drugs and β-blockers and the biological effects of their
enantiomers.
Behavior Class Drug Effect Observations
One isomer is pharmacologic ally active, and
the other is inactive Antidepressant N H OH Oxaprotiline * Enantiomer R active. S inactive. Marketed as racemate Both have similar activity
and potency Antihistaminic
Promethazine * C H3 N C H3 C H N S C H3 Both isomers can be administrated. Neither as pharmacologic al advantage against the other
3
Table 1 – (cont.)
Behavior Class Drug Effect Observations
Enantiomers with similar activity but different potency β-blocker OH N H CH3 CH3 O Propranolol * S-form is more potent. R-form has more affinity to plasmatic proteins Marketed as racemate One stereoisomer antagonizes the side effect
of the other Anti-depressant N O N F Citalopram * S-form is a selective serotonin reuptake inhibitor. R-form is less potent One stereoisomer responsible for desired action and other isomer responsible for side effects β-blocker Dilevalol O NH2 H N OH OH (R,R)-isomer of labetalol. Higher risk of hepatotoxicity (12) Not approved by FDA The two enantiomers have similar activity, but one has side effects and the other does not
Anesthetic O NH H3C Cl Ketamine * Used as racemate. S (+) is 3-4 times more potent than
R (-). R (-) has more side effects. Each stereoisomer has different therapeutic effect Analgesic/ Antitussive O O N O O N Dextropropoxyphene Levopropoxyphene Dextropropoxyphe ne is used as a pain killer. Levopropoxyphen e is used as an antitussive.
Given the importance of chirality, considering the development of new chiral drugs, the pharmaceutical industry should commercialize the drug with the most benefit to the user. Thus, the molecule can be marketed as racemate or single enantiomer. On the other hand,
4
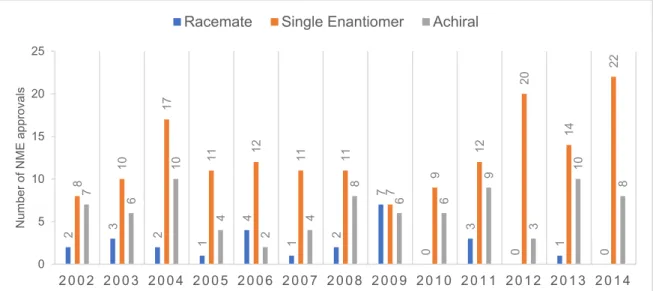
chiral switch has been a strategy used by the pharmaceutical industry to introduce either new or commercialized racemate molecules in the market. Chiral switch refers to the use of a single enantiomer from a chiral drug that has been approved and marketed previously as a racemate (13). Some of the advantages of chiral switching are: (i) an improved therapeutic index through increased potency and selectivity and decreased side-effects; (ii) a faster onset of action; (iii) a reduced propensity for drug-drug interactions, and (iv) the exposition of the patient to a lower dosage (1). Although US Food and Drug Administration (FDA) does not dictate development of single enantiomers as mandatory, single-enantiomer drugs have become the standard in pharmaceutical companies when working with compounds featuring stereogenic centers in their structure (1). In 2010, single-enantiomer pharmaceuticals were 70% of the new molecules introduced in the market (14), however, from 1994 to 2011, only five psychoactive drugs suffered the switch to one-enantiomer version: fenfluramine, citalopram, methylphenidate, zopiclone and modanafil (1). From 2002 to 2014, 273 new molecules were approved to the market, being 164 commercialized as single enantiomers (Figure 2) representing 60% of all molecules approved in that time
span (Figure 3) (14, 15). Table 2 shows chiral drugs used as racemates or single
enantiomers.
Figure 2 - Number of US Food and Drug Administration (FDA)-approved new molecular entities
(NMEs) regarding their chirality from 2002 to 2014. (adapted from (14, 15)).
2 3 2 1 4 1 2 7 0 3 0 1 0 8 10 17 11 12 11 11 7 9 12 20 14 22 7 6 10 4 2 4 8 6 6 9 3 10 8 0 5 10 15 20 25 2002 2003 2004 2005 2006 2007 2008 2009 2010 2011 2012 2013 2014 Num ber of NM E appr ov al s
5
Figure 3 - Percentage of FDA-approved NMEs regarding their chirality from 2002 to 2014.
Table 2 - Chiral drugs commercialized either as racemates or single enantiomers. Adapted from
(16).
Racemate Enantiopure drug Therapeutic class
Amphetamine (dextroamphetamine) (S)-amphetamine CNS stimulant Citalopram (S)-citalopram (escitalopram) Antidepressant Fenfluramine (dexfenfluramine) (S)-fenfluramine Serotonergic anorectic
Ketamine (S)-ketamine (esketamine) General anesthetic Methylphenidate (R,R)-methylphenidate (dexmethylphenidate) CNS stimulant
Modafinil (R)-modafinil (armodafinil) Wakefulness-promoting Zopiclone (S)-zopiclone (eszopiclone) Hypnotic
CNS: Central nervous system
The consumption of chiral psychoactive drugs regarding antidepressants and β-blockers in Portugal, data from INFARMED, I. P., shows an increase in almost all of these compounds from January 1st 2015 to May 31st 2018 (Figure 4 and 5).
10%
60% 30%
6
Figure 4 – Number of betablockers’ units sold by medical prescription at Portuguese Health National
Service and public subsystems, from January 1st 2015 to May 31st 2018. Hospital usage not included.
Data from Centro de Conferência de Facturas, provided by INFARMED, I.P.
Figure 5 - Number of antidepressants’ units sold by medical prescription at Portuguese Health
National Service and public subsystems, from January 1st 2015 to May 31st 2018. Hospital usage not included. Data from Centro de Conferência de Facturas, provided by INFARMED, I.P.
0 500 000 1 000 000 1 500 000 2 000 000 2 500 000
Bisoprolol Nebivolol Carvedilol Propranolol Atenolol Metoprolol Tertatolol nº units in
2015 nº units in2016 nº units in2017 nº units in(jan-mai) 2018
0 100 000 200 000 300 000 400 000 500 000 600 000 700 000 800 000 900 000 1 000 000 1 100 000 1 200 000 1 300 000 nº units in
7
1.2.
Occurrence of chiral psychoactive substances and
β-blockers in the environment
In the last years, pharmaceuticals and illicit drugs have emerged as environmental contaminants due to the increase consumption and continuous discharged into the environment. In fact, various studies have been shown the presence of different classes of these compounds in the aquatic environment (17-25). Nevertheless, most studies did not discriminate the enantiomers of those substances. Recently, the chiral analysis in environmental matrices has been applied to pharmaceutical and illicit drugs in order to distinguish between legal and illicit drugs consumption; estimate the consumption patterns at community level (sewage epidemiology); illegal discharge of sewage and manufacturing of illicit drugs and also information about enantiotoxicity (26). Illicit drugs like AMP, MAMP, MDMA, MDA were already detected in WWTP effluents, rivers and tap waters, in several countries such as Spain, United Kingdom, Norway, Switzerland, Belgium, Denmark, Australia, South Africa and China, (19-21, 23, 27-31). In other studies, pharmaceuticals such as atenolol (ATE), metoprolol (MET), PHO, fluoxetine (FLX) and its metabolite norfluoxetine (NFLX) were detected in WWTP influents and effluents, river, lake and bay waters in Canada, USA and some European countries, including Portugal (17, 18, 20, 22, 32-43).
Chromatographic methods have been the most common analytical techniques applied for the determination of these substances. Gas chromatography (GC) and liquid chromatography (LC) have been widely applied to discriminate enantiomers. Two approaches can be used: direct method and indirect method.
Direct method mainly relies in the use of chiral stationary phases (CSPs). Various works have been reporting the separation of chiral pharmaceuticals and illicit drugs (19-27) with the advantage of the availability of a large variety of commercially LC CSPs. However, there is no single CSP that can be considered universal, being the stereoresolution mechanism difficult to predict. This is the major disadvantage due the difficulty to choose the ideal CSP for enantiomeric separations of compounds that are not described yet. This approach has been widely used in LC applications for several compounds including AMP, MAMP, MDMA and MDA, in environmental matrices (27, 28, 44-47).
Indirect method uses an enantiomerically pure chiral derivatization reagent (CDR) to diastereoisomers formation which has different physical and chemical properties. This results in distinct retention times in conventional chromatographic methods. CDRs have the advantage of being commercially available in a wide variety and could be an alternative when direct method is not possible (48). This approach has been used in some published works in biological matrices like urine, plasma, blood and hair (49-58), however, for the best
8
of our knowledge, there is only two works in environmental matrices for the enantioseparation of β-blockers. In those works, PHO was detected in wastewaters and river waters using (R)-(−)-α-Methoxy-α-(trifluoromethyl)phenylacetyl chloride ((R)-MTPA-Cl) as CDR in gas chromatography – mass spectrometry (GC-MS) (37, 41).
Due to the occurrence of these substances in the environment namely wastewaters, a new approach was emerged with the possibility of back-calculate the consumption of pharmaceuticals and illicit drugs by the population. This approach is known as wastewater-based epidemiology.
9
1.3.
Wastewater-based epidemiology and enantiomeric profiling
Traditional drug monitoring approaches based mostly on population surveys are time consuming and may be inaccurate (59). To circumvent these issues, Daughton (60) in 2001 hypothesized an approach referred as sewage epidemiology. It is based on the assumption that wastewaters are regarded as a community urine and feces samples.
Originally, pharmaceuticals in WWTP and rivers were analyzed to investigate environmental contamination and to achieve information for further environmental evaluation risk. However, since detection of COC in wastewater (61) in 2005, this new epidemiological tool has been developed in untreated wastewater to analyze human metabolic residues of drugs of abuse, pharmaceuticals, and personal care products produced by a population to study the collective habits of use of these compounds (62-69). Thus, this concept allows estimating drug consumption by measuring drug or/ and drug target residues (DTR), as biomarkers of drug consumption, concentrations in raw wastewater (RW) and taking into consideration the population served, stability of drug residues, excretion rates, and wastewater volumes (60, 61, 70, 71). This aproach provides direct quantitative estimates, in a non-invasive manner and in almost real-time (59). More recently, the term “sewage epidemiology” has been replaced by “wastewater-based epidemiology” (WBE) but the concept is the same. An overview of the wastewater analysis to estimate drug consumption is represented in Figure 6.
Figure 6 - Wastewater-based epidemiology approach. (adapted from (25)).
Drug of abuse / drug target residue Metabolism
Excretion (urine / faeces) Sewage system Untreated Wastewater Sample collection Pretreatment of sample Analysis Drugs concentration
Mass loads of drugs
Drug consumption
Consumption per 1000 inh. Flow rate
Excretion rates
10
Currently, more studies have been done towards the determination of illicit drugs and drugs of abuse to estimate population consumption. Most studied compounds include AMP, COC, morphine, methadone, Δ9-THC, and LSD (31, 59, 72-83). While this approach represents an important improvement, it also has uncertainties and biases (23).
Regarding estimative of consumption, usually reported data in the literature use the term “loads” to refer mg or g/day of a substance consumption. Although this estimative has being acceptable, data from multiple community areas/ countries cannot be correlated because the population is not normalized. When population data is available, loads in mg/day/1000 inh. can be considered. The following equation represents how drug loads are calculated (84):
Drug loads � 1000 inh. · dmg � = Conc. of DTR � ngL � × Influent flow � L d � Population served 1000 × 1 106 � mg ng �
Equation 1 - Drug loads in mg 1000 inh.-1 d-1. Concentration of DTR, influent flow of WWTP and
population served by the WWTP are considered to calculate drug loads.
The load of a DTR can be further converted into drug consumption (Equation 2) (84), where
ExcretionDTR is the excretion rate of the DRT; StabilityDTR is the ratio of DTR concentration after in-sewer transformation and adsorption to initial concentration; MWDrug is the molecular weight of the drug of interest and the MWDTR is the molecular weight of the DTR.
Consumption � 1000 inh · d �mg =
= LoadDTR� 1000 inh · d �mg × Stability1 DTR ×
1
ExcretionDTR ×
MWDrug
MWDTR
Equation 2 - Consumption in mg 1000 inh.-1 d-1. In this equation are applied correction factor such
as stability and excretion of DTR and molecular weight of the drug and DTR.
With these equations and the proper data, it is possible to calculate estimation of the drug consumption for a specific population. These parameters are also important for the standardization of data between studies, being therefore possible to correlate patterns of consumption between cities, countries or even continents.
Moreover, most illicit drugs and pharmaceuticals are chiral and available either as racemates or single enantiomers. Consequently, distinction of the enantiomers (also known as enantiomeric profiling) of chiral drugs is extremely important for WBE because it can
11 provide more accurately information regarding: evidence of the existence of chiral pharmaceuticals and illicit drugs in the environment, estimation of pharmaceuticals and illicit drugs consumption in a specific area/community; monitorization patterns of drug consumption, distinction between licit and illicit use of drugs; differentiation between consumption and disposal of unused drugs (23, 42, 59, 89, 90). Recently, WBE approach has been updated and stereochemistry of the target drugs has been considered (17, 20, 30-32, 35, 37, 85).
Ratio variations between enantiomers are expressed as enantiomeric fraction (EF) (91). EF < 0.5 or > 0.5 represent a predominance of one enantiomer over the other and an EF equals 0.5 represents a racemate. EF can be calculated by the following generic equation (23):
EF= (E1+E2) E1
Equation 3 - General equation to calculate enantiomeric fraction.
where E1 is commonly used in the literature as the S enantiomer and E2 the R enantiomer. When enantiomers are unknown, usually E1 is the first enantiomer eluted in the chromatogram and E2 the second.
Regarding the consumption of illicit drugs, it is important to make the distinction between consumption (and if the drug was effectively consumed or if it is a byproduct of the metabolism of another licit/illicit drug) and direct disposal in to the sewage system. This estimation is only possible when WWTP flow, population served by the WWTP, concentration of analyte in influent, and metabolism factors (e.g. stereoselective pharmacokinetics and excretion rate for each enantiomer) are available (75).
With the increase of consumption of substances, the evidence of this increase and presence in environmental matrices as stated above, the possible consequences to life in these systems and to humans, it is imperative to develop methodologies that are capable to identify and quantify those substances in order to better direct future studies and social/ economical/ legal approaches. With this in mind, the objectives of this dissertation are elucidated below.
12
1.4.
Objectives
The objectives of this dissertation were:
i. To optimize and develop an indirect method by GC-MS for the separation and quantification of the diastereoisomers of 11 chiral drugs of forensic interest namely psychoactive substances, AMP, MAMP, MDMA, FLX, NFLX, sertraline (SER), paroxetine (PAR) and β-blockers alprenolol (ALP), MET, PHO and bisoprolol (BIS).
ii. To apply the method for the determination of the target chiral drugs in WWTP influent.
iii.
Back-calculate the consumption of the target psychoactive substances in a13
2. Material and Methods
2.1.
Chemicals, standards and materials
Standards
ALP, bisoprolol (BIS), FLX, MET, PHO and norketamine (NK) were purchased from Sigma-Aldrich (Steinhein, Germany). AMP and MAMP were acquired from Lipomed (Arlesheim, Switzerland). NFLX was purchased from Santa Cruz Biotechnology, Inc. (Heidelberg, Germany). PAR and SER were purchased from Santa Cruz Biotechnology (Dallas, USA). MDMA was synthetized in the Toxicology Laboratory of the Faculty of Pharmacy of the University of Porto (Porto, Portugal). Table 3 shows the target substances selected for this
work.
Table 3 -Target compounds selected for this work, molecular formula, relative molecular mass (Mr), pKa and Log P.
Compound Molecular formula Mr pKa Log P
NH2 Amphetamine (AMP) * C9H13N 135.21 10.1 1.68 N H Methamphetamine (MAMP) * C10H15N 149.24 10.0 2.2 NH O O 3,4-Methylenedioxymethamphetamine (MDMA) * C11H15NO2 193.25 9.9 1.98 NH2 Cl O Norketamine (NK) * C12H14ClNO 223.70 7.0 1.94
14
Table 3 – (cont.)
Compound Molecular formula Mr pKa Log P
OH H N O Alprenolol (ALP) * C15H23NO2 249.35 14.0 2.7 O H2N F F F Norfluoxetine (NFLX) * C16H16F3NO 295.31 9.8 3.75 F F F O N H Fluoxetine (FLX) * C17H18F3NO 309.33 9.8 4.27 O O OH H N Metoprolol (MET) * C15H25NO3 267.37 14.0 1.72 OH N H O Propranolol (PHO) * C16H21NO2 259.35 14.0 2.65 OH H N O O O Bisoprolol (BIS) * C18H31NO4 325.45 14.0 1.94
15
Table 3 – (cont.)
Compound Molecular formula Mr pKa Log P
HN Cl Cl Sertraline (SER) * * C 17H17Cl2N 306.23 9.6 5.03 H N O O F O Paroxetine (PAR) * * C19H20FNO3 329.37 9.4 3.46
The internal standards, D,L-AMP-D3 was purchased from Lipomed (Arlesheim, Switzerland), while PHO-D7, FLX-D5 were acquired from Sigma-Aldrich (St Louis, MO, USA).
Individual stock solutions of standards were prepared in methanol (MeOH) at concentration of 1 mg mL-1 and stored at -20 ºC in amber vials. Work solutions were prepared freshly by dilution of stock solutions in MeOH. Stock solutions of IS were prepared at 100 and 200 µg mL-1 concentration.
Solvents and reagents
All solvents were of HPLC grade. MeOH was purchased from Fisher Scientific (Loughborough, UK), ethanol (EtOH) from Chem-Lab NV (Zedelgem, Belgium) and n-hexane was purchased from VWR Chemicals (Fontenay-sous-Bois, France). Triethylamine (TEA) was purchased from Sigma-Aldrich (Basel, Switzerland), tetrahydrofuran anhydrous (THF), sulfuric acid (H2SO4) 95-97% were purchased from Sigma-Aldrich (Steinheim, Germany). Sodium hydroxide (NaOH), ammonia solution (NH4OH) 25% were purchased from Merck (Darmstadt, Germany) and formic acid 98-100% was purchased from Merck (Finland). Ultra-pure water (UPW) was obtained from a SG Ultra Clear UV plus equipment. The (R)-MTPA-Cl, (R)-(+)-α-Methylbenzyl isocyanate and (R)-(−)-3-Methyl-2-butyl isocyanate were purchased from Sigma‐Aldrich (Steinheim, Germany).
16
Ethyl acetate anhydrous (EtAc) was purchased from Merck (Darmstadt, Germany) and acetonitrile anhydrous (ACN) purchased from VWR Chemicals (Zedelgem, Belgium) and both of analytical grade. N‐methyl‐N-trimethylsilytrifluoroacetamide (MSTFA) with 1% trimethylchlorosilane (TMCS) was purchased from Fluka Analytical (Sigma‐Aldrich) (Basel, Switzerland). Helium C‐60 (99.99%) was obtained from Gasin (Perafita, Portugal).
Materials
Filter paper with particle retention 7-11 µm was purchased from ALBET (EEC). Glass microfibers filter with particle retention 0.7 µm was purchased from VWR (Leuven, Belgium). Visiprep™ SPE Vacuum Manifold was purchased from Supelco. Oasis MCX 150 mg (6cc) SPE cartages was purchased from Waters (Dublin, Ireland). 2 mL syringes were purchased from BD Emerald (Madrid, Spain). Syringe filters with particle retention 0.7 µm were purchased from Teknokroma (Barcelona, Spain).
2.2.
Equipments
2.2.1. Chromatographic systems
GC-MS 1: Varian CP-3800 gas chromatograph equipped with ion‐trap Varian Saturn 2200
mass detector. Chromatographic separation was achieved using a Zebron (5% phenyl, 95% dimethylpolysiloxane) capillary column (30 m × 0.25 mm ID × 0.25 μm film, from Phenomenex, USA).
GC-MS 2: Trace GC 2000 Series ThermoQuest gas chromatograph equipped with ion‐trap
GCQ Plus ThermoQuest Finnigan mass detector. Chromatographic separation was achieved using a capillary column (30 m × 0.25 mm × 0.25 μm, cross‐linked 5% diphenyl and 95% dimethyl polysiloxane) from Restek (Bellefonte, PA, USA). High‐purity helium C‐ 60 (99,999%) was used as carrier gas.
GC-MS 3: Agilent (Little Falls, DE, USA) gas chromatograph 6890 equipped with an
electronically controlled split/splitless injection port and an inert 5973 N mass selective detector (single-quadrupole) with electron impact (EI) ionization chamber. Chromatographic separation was achieved using a capillary column (30 m × 0.25 mm × 0.25 μm, cross‐linked 5% diphenyl and 95% dimethyl polysiloxane) from Restek (Bellefonte, PA, USA).
2.2.2. Other equipment
Centrifugal vacuum evaporator: Labconco CentriVap Concentrator, with cold trap (Kansas City, MO, USA).
17
2.3.
Derivatization procedure
Three different procedures were attempted to prepare the diastereoisomers of the target substances:
Procedure 1: 200 µL from each standard (25 µg mL-1) were evaporated to dryness under vacuum at room temperature (RT). Then, 250 µL of THF with 0.02% (v/v) TEA and 0.2% (v/v) (R)-MTPA-Cl was added to the residue, vortexed for 30” and heated at 40 ºC for 2h. Then, 100 µL of EtOH was added to the solution, vortex for 30” and heated at 40 ºC for 15 min. Solutions were evaporated to dryness and derivatized with 50 µL of MSTFA 1% TMCS at 70 ºC for 1h. Solution was further evaporated, reconstituted in 200 µL of EtAc anhydrous and then, analyzed by GC-MS.
Procedure 2: 200 µL from each standard (25 µg mL-1) were evaporated to dryness under vacuum at RT. Then, 100 µL of MSTFA 1% TMCS was added to the residue, heated at 80ºC for 30 minutes and then evaporated to dryness. 1.5 mL of 0.02% TEA in n-hexane was added to samples and vortexed for 10 minutes. 3 µL of (R)-MTPA-Cl was added to form the diastereoisomers. The solution was vortexed and heated at 80ºC for 2h. Then, 100 µL of EtOH was added and heated again at 70ºC for 15 minutes. Solution was further evaporated, reconstituted in 200 µL of ACN anhydrous and then, analyzed by GC-MS.
Procedure 3: 200 µL from each standard (25 µg mL-1), standard mixtures or aliquot of extracts from SPE were evaporated to dryness under vacuum at RT. Then, 200 µL of H2O and 200 µL of NaOH 1M were added to the residue and vortexed. Further, 1.5 mL of 0.02% TEA in n-hexane was added to the solution and vortexed for 10 minutes for the extraction of the compounds. Samples were then centrifuged at 13000 RPM for 10 minutes. The supernatant was separated and 10 µL of a 0.5% of (R)-MTPA-Cl in ACN anhydrous was added to form the diastereoisomers. Samples were vortexed and heated at 80ºC for 2h. Afterwards, 100 µL of EtOH was added to stop the reaction and heated again at 70ºC for 15 min. Then, samples were evaporated to dryness and residues derivatized by adding 100 µL of MSTFA 1% TMCS, vortexed and heated at 70ºC for 1h and then, analyzed by GC-MS.
18
2.4.
GC-MS conditions
Several conditions were investigated to optimize the separation of selected compounds. The optimization was performed in three distinct GS-MS systems:
GC-MS 1 system: separation of the target compounds were achieved using the following
program: start at 180ºC and increase to 210ºC at a rate of 2ºC/min, increase to 240ºC at 10ºC/min. and increase again to 260ºC at 1ºC/min with a final hold of 10 min. The total run time was 48 min. The injector temperature was set to 280 °C, transfer line to 280 ºC and the trap temperature to 200 ºC. High‐purity helium (99,999%) was used as carrier gas at constant flow of 1.0 mL/min. 1 μL of the derivatized samples was injected in the splitless mode and qualitative analyses were performed in the full scan mode in the range of m/z 40–650.
GC-MS 2 and GC-MS 3 systems: separation of target compounds were achieved with the
following conditions: an initial temperature of 140 °C maintained for 0.5 min followed and increase to 215 °C at 11 °C/min and 283 °C at 29 °C/min and held for 6 min, increased again to 300 ºC and held for 11 min giving a total run time of 28 min. The injector temperature was set to 280 °C, transfer line to 280 ºC and the trap temperature to 200 ºC. For both systems, high‐purity helium C‐60 (99,999%) was used as carrier gas at constant flow of 1.0 mL/min.
Qualitative analyses were performed in the full scan mode in the range of m/z 40–650. Quantitative analyses were performed in selected ion‐monitoring (SIM). 1 μL of the derivatized samples was injected in the splitless mode for qualitative and quantitative analyses.
2.5.
Sampling collection
Preliminary tests were performed with grab samples of influent and effluents wastewater collected from WWTP Ponte da Moreira, Maia, Porto. For validation of the GC-MS analytical method an equal part mixture of influent and effluents wastewater from WWTP Ponte da Moreira, Maia was used. Grab samples were used for test and validation. Grab samples for preliminary test and application of the method were obtained at June 27th, 2018. For validation, grab samples were obtained at July 24th, 2018. Wastewater samples were collected into 1 and 2.5 L amber glass bottles, which were previously rinsed in the laboratory with ultrapure water.
19 During the transport, all wastewater samples were kept refrigerated (± 4°C) in the dark. In the laboratory, all samples were immediately vacuum filtered through a 7-11 µm paper filter and then a 0.7 μm glass fiber filter and acidified to pH 3 with H2SO4 (95 – 97%). Water samples were maintained at ± 4°C in the dark until SPE procedure.
2.6.
Solid phase extraction
The SPE was performed without cartridge conditioning. For method validation, 500 mL of wastewater (mixture of influent and effluent) spiked with mixtures of the standards were loaded into the cartridge directly. Then, cartridges were washed with 4 mL of 2% formic acid in H2O. After washing, cartridges were dried under vacuum for 1h. The elution was performed with 4 mL of 5% NH4OH in EtOH. The eluates were then filtered, with a syringe filter (0.22 µm), after being rinsed with 1 mL of 5% NH4OH in EtOH. Eluates were then evaporated to dryness and then reconstituted in 250 µL of MeOH to obtain the initial concentration. For application of the method, SPE procedure was the same and 200 mL of influent was used.
2.7.
Method parameters and validation
The analytical method was validated in terms of selectivity, linearity and limits of detection (LOD) and quantification (LOQ) according to International Conference on Harmonisation (ICH) criteria (86). Selectivity was verified by comparing the chromatograms and MS spectra of the solvent standard mixtures, spiked extracted samples and blank extracts. Linearity was studied by spiking 500 mL of wastewater samples at seven calibration standards mixtures, each one in triplicate, containing internal-standards (IS). Final concentrations for each enantiomer of the target compounds are shown in Table 4. Each
enantiomer of D,L-AMP-D3 and FLX-D5 were used as IS at concentration of 1250 ng L-1 and 3750 ng L-1, respectively. D,L-AMP-D3 was selected as IS for AMP, MAMP and MDMA, FLX-D5 for FLX and NFLX.
The linearity range of each analyte was adjusted in accordance to the LOQ (Table 4).
Calibration curves were constructed using the calibration concentrations by linear regression analysis.
LOD and LOQ were determined evaluating the signal/noise (S/N) ratio – 3 for LOD and S/N 10 for LOQ.
20
Table 4 - Concentrations (ng L-1) of each enantiomers of the target compound used for the calibration
curve. C1 (ng L-1) (ng LC2 -1) (ng LC3 -1) (ng LC4 -1) (ng LC5 -1) (ng LC6 -1) (ng LC7 -1) ALP 156,25 312,5 625 1250 1875 2500 3125 AMP 62,5 125 250 500 1000 2000 4000 BIS 1875 2500 6250 9375 12500 15625 18750 FLX 312,5 500 1000 1875 3750 5000 6250 MAMP 62,5 125 250 500 1000 2000 4000 MDMA 62,5 125 250 500 1000 2000 4000 MET 625 1250 1875 2500 3125 3750 4375 NFLX 312,5 500 1000 1875 3750 5000 6250 PAR 10 20 30 40 45 50 60 PHO 312,5 1250 1875 2500 3125 3750 4375 SER 10 20 30 40 45 50 60
21
3. Results and Discussion
3.1.
Optimization of the derivatization procedure of target
substances with enantiomerically pure reagent
Regarding the formation of the diastereoisomers of target compounds, three different protocols were attempted to optimize de derivatization procedure (section 2.3). For that, in all protocols, aliquots of 200 µL from each racemic standard or mixture of standard at 25 µg mL-1 were evaporated to dryness under vacuum at RT. Procedure 1 was tried to simplify the extraction and derivatization time. THF was used as solvent and TEA as a base to regenerate amines to react with (R)-MTPA-Cl. The formation of diastereoisomers were not detected with this protocol for none of the compounds.
A second procedure adapted from (37) was used. In this procedure, an extraction step was performed, followed by the derivatization with MSTFA 1% TMCS. The last step was a chiral derivatization with (R)-MTPA-Cl. No results were obtained with this procedure too. A possible explanation is that MSTFA 1% TMCS reacts with -OH and amine groups. As all target substances have these amine groups, all possible reaction groups react with trimethylsilyl groups, therefore, formation of diastereoisomers is not possible afterwards. The third procedure was adapted from procedure 2. In this procedure the chiral derivatization preceded the derivatization with MSTFA 1% TMCS. The formation of the diastereoisomers of all the targeted substances was detected with this protocol. Using this protocol, in a first stage, after derivatization with MSTFA 1% TMCS samples were evaporated and reconstituted in 200 µL of ethyl acetate, however with the introduction of new substances, some residues were not soluble in this solvent. Anhydrous ACN was used as alternative as it was able to solubilize all diastereoisomers of target compounds and was compatible as solvent for GC-MS use. Further, in the development of the method, the reconstitution step with an adequate solvent after derivatization with MSTFA 1% TMCS had to be excluded due to loss of some diastereoisomers during evaporation step. Therefore, samples were injected in GC-MS system directly after derivatization.
For chiral derivatization, (R)-MTPA-Cl, (R)-(+)-α-Methylbenzyl isocyanate and (R)-(−)-3-Methyl-2-butyl isocyanate were evaluated to investigate the best reagent for chiral derivatization. (R)-(+)-α-Methylbenzyl isocyanate and (R)-(−)-3-Methyl-2-butyl isocyanate were tested, using procedure 3, in AMP, MAMP and MDMA, however, the diastereoisomers of these compounds were not detected in the chromatographic runs. The reactions of an isocyanate with an amine form an urea group. An example of the reaction of MDMA with (R)-(+)-α-Methylbenzyl isocyanate is showed in Figure 7. Figure 8 shows the reaction
22
between MAMP and (R)-(−)-3-Methyl-2-butyl isocyanate. (R)-MTPA-Cl derivatized all the target compounds. MTPA-Cl is a chloride of acid reagent that reacts easily with primary and secondary amine to form amide derivatives (87). An example of the reaction is shown in
Figure 9, with FLX.
Volumes of (R)-MTPA-Cl were also tested: 5 µL, 3 µL and 10 µL of a 0.5% (v/v) solution of (R)-MTPA-Cl in ACN anhydrous. 3 µL and 5 µL of pure reagent do not improve the signal response, so the 0.5% solution was used.
MSTFA 1% TMCS was used for derivatization (Figure 10) of compounds with compatible
groups (-OH), as ALP, BIS, MET and PHO. The best results were obtained with 50 µL of MSTFA 1% TMCS and 30 minutes at 70ºC. With the addition of more compounds and for validation in WWTP waters, the heat time was increased to 1h to guarantee that the reaction was complete for all target compounds.
During extraction, 1.5 mL of n-hexane was used. The volume of organic phase recovered after extraction was 1.1 mL.
EtOH was used after chiral derivatization to stop the chiral reaction and inactivate the excess of CDR present in samples. In this step, lower time and temperature (15 min, 70ºC) was used to avoid dissociation of the amide formed between the (R)-MTPA-Cl and the analyte.
All evaporation steps were performed in a Labconco CentriVap Concentrator, with a cold trap. H N O O H N O O
+
C N O O O N O H N O O N O H NFigure 7 - Reaction between MDMA and the chiral derivatization reagent (R)-(+)-α-Methylbenzyl
isocyanate. (S)-MDMA
(R)-MDMA
(R)-(+)-α-Methylbenzyl isocyanate
23 N NH O N C O N H + N H N NH O
Figure 8 - Reaction between MAMP and the chiral derivatization reagent (R)-(−)-3-Methyl-2-butyl
isocyanate. F F F O N H F F F O N H (R)-Fluoxetine (S)-Fluoxetine + O Cl O F F F (R)-MTPA-Cl O O F F F O O F F F F F F O N F F F O N
Figure 9 - Reaction between FLX and the chiral derivatization reagent (R)-MTPA-Cl.
O N Si F F F + Alprenolol MSTFA * OH O N O O F F F O O N O O F F F Si *
Figure 10 – Reaction of ALP derivative after reaction with (R)-MTPA-Cl, and the derivatization
reagent MSTFA.
(R)-(−)-3-Methyl-2-butyl isocyanate (R)-MAMP
24
3.2.
Optimization of SPE procedure
Regarding SPE, from previous work from our group, it was established that conditioning of the cartridge was not a necessary step, therefore simplifying the procedure and saving time.
Figure 11 shows the typical steps to perform a SPE procedure and the step skipped. Also,
different solvents were investigated. EtOH showed similar results to others solvents tested (data not shown), and thus, it was chosen with the advantage of being a “green” solvent. Centrifugation and syringe filtration were steps used to clean further WWTP samples before the derivatization step.
Figure 11 – Optimization of SPE procedure, skipping the conditioning step.
Conditioning Sample loading Washing Elution
Analyte
25
3.3.
Optimization of GC-MS conditions
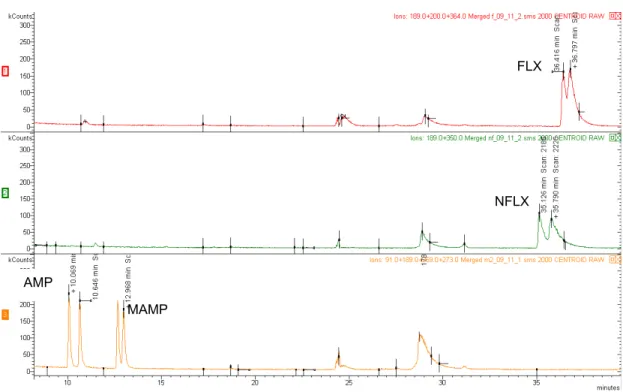
Several GC conditions were tested in order to obtain the best condition for the separation of the derivatives of all target compounds. The first attempts to separate and determine the fragmentation pattern of each derivatized compound was performed in GC-MS 1. In this system, the best results were achieved using the conditions described in section 2.4. Figure 12 shows the separation of the diastereomers of AMP, MAMP, NFLX and FLX using the
best conditions with this system. Additional conditions were tested trying to separate more compounds, having the longest setup a total of 72 minutes from 180ºC to 290ºC, nonetheless not all substances were detected. After optimization for the four substances above, different flows were tested. Flows of 0.7, 0.8 and 1.0 mL/min were evaluated with GC-MS 1. Results for different flows are showed for AMP and MAMP in Figure 13.
Decrease in flow did not improve chromatographic resolution but delay retention times (Rt), as expected. Thus, 1.0 mL/min flow was used for determination of more substances, method validation and application. Further discussion regarding Rt and fragmentation patterns for this system will not be addressed for this system as GC-MS 2 was used for optimization of all target substances.
After optimization in GC-MS 1, the same conditions were attempted in GC-MS 2, however they were not reproducible. Conditions adapted from (88) were tried and further optimization conducted. The best conditions are described in section 2.4. With it was possible to detect 12 substances (total of 22 diastereoisomers, not were not successfully separated in the respective diastereomers) in less than 27 minutes.
26
Figure 13 – Chromatograms of the diastereomers of AMP and MAMP with 0.7 (above), 1.0
(middle) and 0.8 (below) mL/min flows in GC-MS 1 system.
FLX
NFLX
AMP
MAMP
Figure 12 - Best separation of the diastereomers of FLX (red), NFLX (green), AMP and MAMP
27 Concerning diastereomers separation and optimization, 1 µL of individual standards derivatized samples were injected at the following nominal racemate concentrations: 5 µg mL-1 for AMP, MAMP, FLX and NFLX and 25 µg mL-1 for ALP, BIS, MDMA, MET, NK, PAR, PHO, SER. All compounds were in racemic form and chromatograms acquired in full-scan to establish Rt and fragmentation patterns. Figure 15 shows a chromatogram of all the 12
target substances, resulting in 22 out of 24 diastereoisomers expected. Figures 15 to 26
shows the chromatograms and mass spectra of the following standards: ALP, AMP, BIS, FLX, MAMP, MDMA, MET, NFLX, NK, PAR, PHO, SER. Some compounds, namely, CAR, NEB, SAL, BUP, DUL, MIR, VEN, O-DVEN, NCOC and K were also tested with the same conditions as the other compounds, however, none of them were detected using the optimized chromatographic conditions.
The order of elution was AMP, MAMP, MDMA, NK, ALP, NFLX, FLX, MET, PHO, BIS, SER, PAR. Table 5 shows the target substances, the Rt of the diastereomers and fragmentation
ions (m/z).
Regarding Rt, small changes were observed from solvent to WWTP samples and in the different GC-MS systems. Nonetheless, all compounds are correctly identified by considering the Rt and MS spectra.
Table 5 - Target compounds, Rt of the diastereomers and fragmentation ions. * - quantification ion
Compound Rt (min) m/z AMP D1: 9.9; D2: 10.1 260*, 234, 351 MAMP D1: 10.5; D2:10.6 274*, 200, 365 MDMA D1: 12.7; D2:12.8 162*, 248, 409 NK D1: 13.2; D2:13.5 206*, 250 ALP D1: 14.1; D2: 14.2 404*, 300, 537 NFLX D1: 14.6; D2:14.7 214*, 350, 511 FLX D1: 15.0; D2:15.1 200*, 364, 525 MET D1: 16.6; D2:16.8 404*, 270, 555 PHO D1: 18.2; D2: 18.3 404*, 362, 547 BIS D1: 20.5; D2: 20.7 404*, 248, 613 SER 21.7 275*, 303, 317, 521 PAR 23.7 408*, 151, 545
28
Concerning the diastereomers resolution, all the substances except SER and PAR were separated in the chromatographic run (Figure 15).
Concerning fragmentation patterns, from Figure 16 to Figure 27 are represented the
molecular structure for all 12 target drugs and possible fragmentation pattern, supporting MS data. For all the substances were selected at least two ions for identification and the most abundant ion was used for quantification (Table 5). For SER and PAR, which only
shows one chromatographic peak, was questioned the possibility of non-reaction with CDR, but identification ions 317 for SER (Figure 26) and 408 for PAR (Figure 27), are bigger
than the molecular ion of SER ([M+] = 305) and PAR ([M+] = 329) without the reaction with CDR. It is possible to conclude that reaction occurs but separation using the optimized chromatographic conditions is not possible. For β-blockers (ALP, MET, PHO, BIS), m/z 404 is the most intense ion, probably due to the similarity of β-blockers molecular structure resulting in the same fragmentation pattern (Figure 14). The derivatization of β-blockers
with MSTFA 1% TMCS allows a better volatilization of this class of compounds, resulting in the presence of the fragment m/z = 73 (Figure 14), characteristic of the trimethylsilyl group
that reacts with -OH groups.
For none of the β-blockers compounds was possible to find the molecular ion of the derivatized compound. O O N O F F F Si
Figure 14 – Fragment 404 resulting from fragmentation of β-blockers. Trimethylsilyl group in red
29
Figure 15 – Full chromatogram with temperature program 14 in SIM mode with a standard mixture of target compounds in MeOH at 25 µg mL-1 concentration:
30
m/z = 351 [M+]
m/z = 260 [M+ - 91] m/z = 234 [M+ - 119] m/z = 162 [M+ - 189]
Figure 16 - Chromatogram of AMP diastereomers (above) and respective mass spectra (below) with
molecular structure and possible of fragment pattern.
NH O CH3 O F F F m/z = 189 m/z = 91 m/z = 119
31 m/z = 365 [M+] m/z = 274 [M+ - 91] m/z = 248 [M+ - 119] m/z = 176 [M+ - 189] m/z = 200 [M+ - 119 - 31 - 15]
Figure 17 -Chromatogram of MAMP diastereomers (above) and respective mass spectra (below) with molecular structure and possible of fragment pattern.
N O CH3 O F F F m/z = 189 m/z = 91 m/z = 119 m/z = 31 m/z = 15
32
m/z = 409 [M+]
m/z = 117 [M+ - 163 - 46]
Figure 18 - Chromatogram of MDMA diastereomers (above) and respective mass spectra (below)
33
m/z = 439 [M+]
Figure 19 -Chromatogram of NK diastereomers (above) and respective mass spectra (below) with molecular structure and possible fragmentation pattern.
34 m/z = 537 [M●+] m/z = 215 [404 – 189] m/z = 142 [215 – 73] m/z = 172 [215 – 43] m/z = 259 [M●+ – 89 - 189] m/z = 300 [390 - 89]
Figure 20 - Chromatogram of ALP diastereomers (above) and respective mass spectra (below)
35
m/z = 511 [M●+]
m/z = 350 [M●+ - 161]
m/z = 246 [M●+ - 265]
Figure 21 - Chromatogram of NFLX diastereomers (above) and respective mass spectra (below) with molecular structure and possible fragmentation pattern.
F F F O HN O CF3 H3CO m/z = 161 m/z = 265 m/z = 232
36
m/z = 525 [M●+]
m/z = 227 [M●+ - 265 - 38]
Figure 22 -Chromatogram of FLX diastereomers (above) and respective mass spectra (below) with molecular structure and possible fragmentation pattern.
F F F O N O CF3 H3CO m/z = 364 [M+-161] m/z = 260 [M+ -265] m/z = 265 m/z = 38
37
m/z = 555 [M●+]
m/z = 301 [M●+- 89 - 165]
m/z = 102 [M●+- 288 - 165]
Figure 23 - Chromatogram of MET diastereomers (above) and respective mass spectra (below)
38
m/z = 547 [M●+]
m/z = 257 [M●+- 217 – 73]
m/z = 362 [M●+- 127 – 43 – 15]
Figure 24 - Chromatogram of PHO diastereomers (above) and respective mass spectra (below) with molecular structure and possible fragmentation pattern.
39
m/z = 613 [M●+]
m/z = 248 [M●+- 59 – 89 - 217]
m/z = 282 [M●+- 288 – 43]
Figure 25 - Chromatogram of BIS diastereomers (above) and respective mass spectra (below) with molecular structure and possible fragmentation pattern.