GID
5, 447–493, 2015Soil moisture sensor calibration for organic soil surface
layers
S. Bircher et al.
Title Page
Abstract Introduction
Conclusions References
Tables Figures
◭ ◮
◭ ◮
Back Close
Full Screen / Esc
Printer-friendly Version Interactive Discussion
Discussion
P
a
per
|
Discussion
P
a
per
|
Discussion
P
a
per
|
Discussion
P
a
per
|
Geosci. Instrum. Method. Data Syst. Discuss., 5, 447–493, 2015 www.geosci-instrum-method-data-syst-discuss.net/5/447/2015/ doi:10.5194/gid-5-447-2015
© Author(s) 2015. CC Attribution 3.0 License.
This discussion paper is/has been under review for the journal Geoscientific Instrumentation, Methods and Data Systems (GI). Please refer to the corresponding final paper in GI if available.
Soil moisture sensor calibration for
organic soil surface layers
S. Bircher1, M. Andreasen2, J. Vuollet3, J. Vehviläinen3, K. Rautiainen3, F. Jonard4,5, L. Weihermüller4, E. Zakharova6, J.-P. Wigneron7, and Y. H. Kerr1
1
Centre d’Etudes Spatiales de la Biosphère, Toulouse, France
2
Department of Geosciences and Natural Resource Management, University of Copenhagen, Copenhagen, Denmark
3
Finnish Meteorological Institute, Arctic Research, Helsinki, Finland
4
Agrosphere (IBG-3), Institute of Bio- and Geosciences, Forschungszentrum Jülich GmbH, Jülich, Germany
5
Earth and Life Institute, Université catholique de Louvain, Louvain-la-Neuve, Belgium
6
Laboratoire d’Etudes en Géophysique et Océanographie Spatiales, Toulouse, France
7
Division Ecologie fonctionelle et Physique de l’Environnement, Institut National de la Recherche Agronomique, Bordeaux-Aquitaine, France
Received: 30 November 2015 – Accepted: 2 December 2015 – Published: 11 December 2015
Correspondence to: S. Bircher ([email protected])
GID
5, 447–493, 2015Soil moisture sensor calibration for organic soil surface
layers
S. Bircher et al.
Title Page
Abstract Introduction
Conclusions References
Tables Figures
◭ ◮
◭ ◮
Back Close
Full Screen / Esc
Printer-friendly Version Interactive Discussion
Discussion
P
a
per
|
Discussion
P
a
per
|
Discussion
P
a
per
|
Discussion
P
a
per
|
Abstract
This paper’s objective is to present generic calibration functions for organic sur-face layers derived for the soil moisture sensors Decagon ECH2O 5TE and Delta-T ThetaProbe ML2x, using material from northern regions, mainly from the Finish Me-teorological Institute’s Arctic Research Center in Sodankylä and the study area of the
5
Danish Center for Hydrology HOBE. For the Decagon 5TE sensor such a function is currently not reported in literature. Data were compared with measurements from underlying mineral soils including laboratory and field measurements. Shrinkage and charring during drying were considered. For both sensors all field and lab data showed consistent trends. For mineral layers with low soil organic matter (SOM) content the
10
validity of the manufacturer’s calibrations was demonstrated. Deviating sensor outputs in organic and mineral horizons were identified: for the Decagon 5TE apparent relative permittivities at a given moisture content decreased for increased SOM content, which was attributed to an increase of bound water in organic materials with large surface areas compared to the studied mineral soils. ThetaProbe measurements from organic
15
horizons showed stronger non-linearity in the sensor response and signal saturation in the high level data. The derived calibration fit functions between sensor response and volumetric water content hold for samples spanning a wide range of humus types with differing SOM characteristics. This strengthens confidence in their validity under various conditions, rendering them highly suitable for large-scale applications in remote
20
sensing and land surface modeling studies. Agreement between independent Decagon 5TE and ThetaProbe time series from an organic surface layer at the Sodankylä site was significantly improved when the here proposed fit functions were used. Decagon 5TE data also well-reflected precipitation events. Thus, Decagon 5TE network data from organic surface layers at the Sodankylä and HOBE sites are based on the here
25
GID
5, 447–493, 2015Soil moisture sensor calibration for organic soil surface
layers
S. Bircher et al.
Title Page
Abstract Introduction
Conclusions References
Tables Figures
◭ ◮
◭ ◮
Back Close
Full Screen / Esc
Printer-friendly Version Interactive Discussion
Discussion
P
a
per
|
Discussion
P
a
per
|
Discussion
P
a
per
|
Discussion
P
a
per
|
1 Introduction
The circumpolar northern colder climate zone (boreal forest and tundra) contributes with a substantial fraction to the total global landmass. Because of slower decompo-sition rates in these regions pronounced organic layers have been accumulating on top of the mineral soils. Particularly when frozen, organic-rich soils store a significant
5
amount of carbon acting as important sinks. However, the higher Northern latitudes are especially sensitive to climate change (IPCC, 2007) due to above-average rising tem-peratures (e.g. Hansen et al., 2006). Thus, a considerable positive feedback on global warming is likely once additional carbon is respired from thawing grounds (Stokstad, 2004). The prediction of the overall response of these ecosystems to global warming
10
is currently highly uncertain. In this context, hydrological processes play a key role and soil moisture is one of the main factors to be assessed to understand and quantify the processes and feedback mechanisms controlling water, energy, and carbon fluxes at the land surface–atmosphere interface.
Given the particular hostility and remoteness of high latitude environments,
space-15
borne remote sensing techniques together with land surface modeling constitute es-sential tools for soil moisture observations at high temporal resolution and with com-plete spatial coverage (e.g. Reichle et al., 2007; Albergel et al., 2012). Nevertheless, spatially distributed in situ soil moisture measurements are indispensable for the Cal-ibration/Validation (Cal/Val) activities of these global soil moisture products as well as
20
in order to increase process-understanding at local scale.
Electromagnetic based sensors belong to the most popular in situ soil moisture mea-suring techniques, as they can be used for automated continuous measurements at high temporal resolution in most soil types and plant growth substrates, including shal-low recordings close to the surface. Different sensor types have been developed using
25
GID
5, 447–493, 2015Soil moisture sensor calibration for organic soil surface
layers
S. Bircher et al.
Title Page
Abstract Introduction
Conclusions References
Tables Figures
◭ ◮
◭ ◮
Back Close
Full Screen / Esc
Printer-friendly Version Interactive Discussion
Discussion
P
a
per
|
Discussion
P
a
per
|
Discussion
P
a
per
|
Discussion
P
a
per
|
(Robinson et al., 2008). Nevertheless, they all take advantage of the large difference between the relative permittivity (ε; relative to free space, also referred to as dielectric
constant) of dry soil and water in order to estimate the volumetric fraction of the latter (e.g. Topp, 2003; Robinson et al., 2003). ε is a complex number whose real part ε′
expresses energy storage based on the ability of a particle to align with the electric
5
field. The imaginary partε′′ describes energy losses due to absorption and electrical
conductivity. In the frequency range where most electromagnetic sensors operate the measured relative permittivities mainly correspond toε′. However, as ε′′ contributes
to a certain degree to the signal and because the observed relative permittivity is the bulk value of compound solid, gaseous, and liquid constituents, it is usually termed
10
apparent relative permittivityεa(e.g. Blonquist et al., 2005).
In case of all electromagnetic sensors the measured raw signal of a substrate is closely related toεa, from which the soil moisture can be derived using either dielectric
mixing models or empirical calibration equations (e.g. Jones et al., 2002; Nagare et al., 2011). These relations are affected by the sensor design, and thus, are sensor type
15
specific. Manufacturers generally provide default calibrations, often including both, raw signal to soil moisture as well asεa to soil moisture relationships. Though calibrated
and validated over a wide range of soil types there is general consensus that these functions cannot hold for all conditions, and therefore, soil- and site-specific calibra-tion is often required to improve the measurement accuracy (e.g. Walker et al., 2004;
20
Czarnomski et al., 2005; Blonquist et al., 2005; Evett et al., 2006; Dorigo et al., 2011; Mittelbach et al., 2012; Vaz et al., 2013).
Currently available impedance and capacitance sensors operate at frequencies be-tween 20–300 MHz, while TDR/FDR and TDT/FDT mainly function in the GHz range (Vaz et al., 2013). The latter are generally considered more accurate with less signal
25
contribution of ε′′ and hence, reduced sensitivity to salinity (electrical conductivity),
GID
5, 447–493, 2015Soil moisture sensor calibration for organic soil surface
layers
S. Bircher et al.
Title Page
Abstract Introduction
Conclusions References
Tables Figures
◭ ◮
◭ ◮
Back Close
Full Screen / Esc
Printer-friendly Version Interactive Discussion
Discussion
P
a
per
|
Discussion
P
a
per
|
Discussion
P
a
per
|
Discussion
P
a
per
|
(e.g. Western et al., 2002; Famiglietti et al., 2008), there is broad agreement concern-ing the benefit of increasconcern-ing soil moisture network density usconcern-ing cheaper sensors at the cost of accuracy, in order to better represent large-scale satellite footprints and model grid cells (e.g. Czarnomski et al., 2005; Bogena et al., 2007; Kizito et al., 2008; Dorigo et al., 2011; Mittelbach et al., 2012).
5
Generally, many authors found manufacturer’s default calibrations sufficiently accu-rate for various mineral soil types of differing texture (apart from very clayey soils), while many studies concluded that specific calibrations are crucial concerning organic-rich soils and humus horizons (e.g. Topp et al., 1980; Herkelrath et al., 1991; Roth et al., 1992; Paquet et al., 1993; Jones et al., 2002; Pumpanen and Ilvesniemi, 2005; Kizito
10
et al., 2008; Sakaki et al., 2011; Vaz et al., 2013). Organic material differs from min-eral by it’s complex structures and small bulk densities. The resulting high porosities and large surface areas result in two effects: (1) substantial water holding capacities up to 0.8–0.9 cm3cm−3
compared to around 0.4–0.6 cm3cm−3
in case of mineral soils (e.g. Kellner and Lundin, 2001; Li et al., 2004), and (2) a higher amount of bound
wa-15
ter altering εa (Jones et al., 2002). Water molecules in the vicinity of solid surfaces
are subjected to interfacial forces hindering their rotation. Consequently, their ability to align with the applied electric field, and thus,ε, are reduced. Therefore, the water
layer closest to the solid particles exhibits a relative permittivity similar to water fixed in ice structures withε′
≈3 (Wang and Schmugge, 1980), while in subsequent layers the 20
value gradually approaches the one of free liquid water. Hence, the use of a calibration function for mineral soil leads to a significant underestimation of the actual moisture content in large surface area organic substrates with increased bound water fraction (e.g. Topp et al., 1980; Roth et al., 1992; Paquet et al., 1993). The relative permittivity of the dry solid particles are reported to range between 2 and 5 without a clear diff
er-25
ence between organic and mineral substrates (e.g. Topp et al., 1980; Roth et al., 1990; Malicki et al., 1996). This lead to the assumption thatεsolid has only little effect onεa
GID
5, 447–493, 2015Soil moisture sensor calibration for organic soil surface
layers
S. Bircher et al.
Title Page
Abstract Introduction
Conclusions References
Tables Figures
◭ ◮
◭ ◮
Back Close
Full Screen / Esc
Printer-friendly Version Interactive Discussion
Discussion
P
a
per
|
Discussion
P
a
per
|
Discussion
P
a
per
|
Discussion
P
a
per
|
The influence of organic matter on the TDR response has been studied by many authors (e.g. Topp et al., 1980; Roth et al., 1990, 1992; Herkelrath et al., 1991; Pepin et al., 1992; Paquet et al., 1993; Malicki et al., 1996; Börner et al., 1996; Myllys and Simojoki, 1996; Schaap et al., 1996; Kellner and Lundin, 2001; Jones et al., 2002; Pumpanen and Ilvesniemi, 2005; Shibchurn et al., 2005; Nagare et al., 2011; Vasquez,
5
2013). However, for other electromagnetic sensors such analysis are more scarce in literature. Recently, Vaz et al. (2013) evaluated standard calibrations for eight electro-magnetic sensors. They pointed to the rarity and thus necessity of further investigations on the capacitance and impedance sensor response in substrates of varying organic matter content.
10
At the Finnish Meteorological Institute’s Arctic Research Center (FMI-ARC) in So-dankylä, Northern Finland, the exploration of hydrological processes is one of the multidisciplinary key research topics. On this site there are several projects dealing with the characterization of moisture content in organic-rich soil surfaces as well as freeze–thaw characteristics using different remote sensing techniques as well as land
15
surface modeling (e.g. Rautiainen et al., 2012 and 2014; European Space Agency: ESA SMOS+ Innovation Permafrost, ESA CCI Soil Moisture, ESA SMOSHiLat; Na-tional Aeronautics and Space Administration: NASA SMAP Cal/Val). To support these activities an in situ soil moisture network (Ikonen et al., 2015) was installed. It was designed in a similar fashion as the network in the Skjern River Catchment, Denmark
20
(Bircher et al., 2012a), maintained by the Danish Center for Hydrology HOBE, and with related actions ongoing. Therefore, a joined effort aimed at calibrating the used soil moisture sensors, namely, the capacitance Decagon ECH2O 5TE sensor (Decagon 5TE)1 and the impedance Delta-T ThetaProbe ML2X (ThetaProbe)1, for organic sub-strate. At both sites, the Decagon 5TE sensors are installed at the permanent network
25
stations providing data to the International Soil Moisture Network (ISMN, Dorigo et al., 2011) – a global in-situ soil moisture database to support validation and improvement
1
GID
5, 447–493, 2015Soil moisture sensor calibration for organic soil surface
layers
S. Bircher et al.
Title Page
Abstract Introduction
Conclusions References
Tables Figures
◭ ◮
◭ ◮
Back Close
Full Screen / Esc
Printer-friendly Version Interactive Discussion
Discussion
P
a
per
|
Discussion
P
a
per
|
Discussion
P
a
per
|
Discussion
P
a
per
|
of satellite observations and land surface models. Meanwhile, ThetaProbes are used for hand-held measurement campaigns (e.g. Bircher et al., 2012b), a current method for spatial variation studies of soil water content at different scales (e.g. Baggaley et al., 2009; Lopez-Vicente et al., 2009) and thus, frequently applied in the scope of satellite validation (e.g. Cosh et al., 2005; Kurum et al., 2012).
5
With the purpose of serving coarse resolution satellite remote sensing and land sur-face modeling studies, the objective was to provide generic calibration functions holding for different types of organic material as encountered within the large areas under con-sideration. Necessarily these functions hold a decreased degree of detail and might lack high accuracy, but will clearly outperform default calibration functions provided by
10
the manufacturers. Additionally, they should be applicable without requiring auxiliary information for the large area of interest, such as bulk density/porosity or specific sur-face area/bound water fraction, as integrated in more sophisticated calibration methods (e.g. Malicki et al., 1996; Dirksen and Dasberg, 1993).
This article presents the Decagon 5TE and ThetaProbe sensor calibrations for
or-15
ganic soil surface layers, derived from field and laboratory measurements using soils from different locations in northern regions, mainly including the Sodankylä and HOBE network areas. While some ThetaProbe calibration efforts are present in literature for organic material from natural soils (see Sect. 3.2), to the knowledge of the authors so far no equivalent studies have been reported in case of the Decagon 5TE sensors. It
20
seems that only Vaz et al. (2013) had looked into the issue for this sensor type, how-ever, using artificial organic material in a limited water content range. Thus, the goal here was to extend the range of validity of the 5TE calibration function for a variety of natural organic substrates and create something more widely applicable.
To avoid inconsistencies, the same measurement and calibration protocol was
fol-25
Measure-GID
5, 447–493, 2015Soil moisture sensor calibration for organic soil surface
layers
S. Bircher et al.
Title Page
Abstract Introduction
Conclusions References
Tables Figures
◭ ◮
◭ ◮
Back Close
Full Screen / Esc
Printer-friendly Version Interactive Discussion
Discussion
P
a
per
|
Discussion
P
a
per
|
Discussion
P
a
per
|
Discussion
P
a
per
|
ments from the underlying mineral soil layers with variable soil organic matter content were also considered in order to demonstrate the validity of the manufacturer calibra-tions within those layers.
2 Description of study sites and data
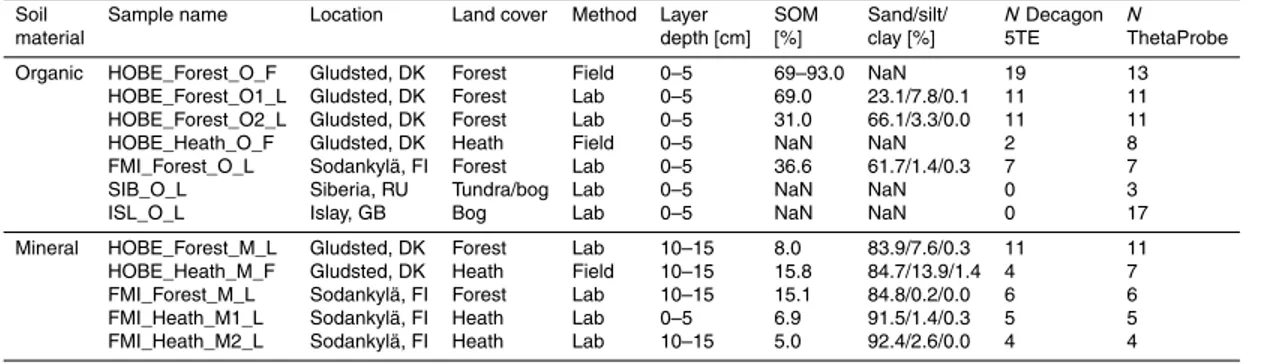
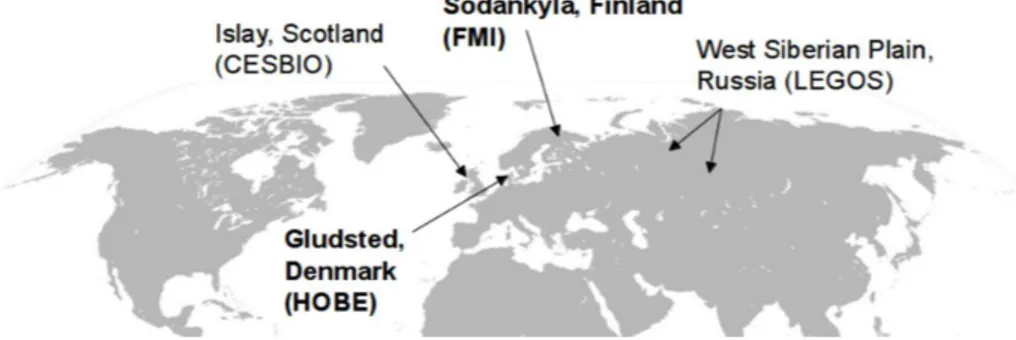
Figure 1 gives an overview of the soil sample locations used in this study. At the two
5
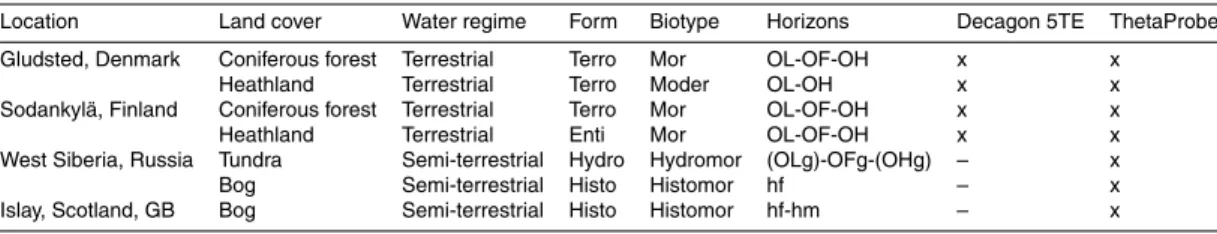
main sites in Finland and Denmark, the Decagon 5TE and ThetaProbe responses were studied in detail. Additionally, some samples used for ThetaProbe analysis were col-lected in Scotland and Siberia. The soil samples used for calibration and their char-acteristics are listed in Table 1. According to humus form classifications (Broll et al., 2006; Zanella et al., 2011), a layer is considered organic if the soil organic matter
10
(SOM) content is greater than∼30–35 %. Classification of the organic samples was undertaken according to the European Humus Forms Reference Base (Zanella et al., 2011) applying a simplified three-level scheme (water regime, form, and biotype). An overview of the classified samples is shown in Table 2, which indicates that the sub-strates used cover a wide range of different humus types typically encountered in the
15
higher northern latitudes.
Soil dry bulk densities range from 0.05–0.4 and 1.0–1.5 g cm−3 for the organic and mineral samples, respectively, and sand is the largest textural fraction (exceeding 80 %) in the studied mineral soils. Decagon 5TE electrical conductivity measurements of all sites remain low with values in the range between 0.00 and 0.13 dS m−1.
20
GID
5, 447–493, 2015Soil moisture sensor calibration for organic soil surface
layers
S. Bircher et al.
Title Page
Abstract Introduction
Conclusions References
Tables Figures
◭ ◮
◭ ◮
Back Close
Full Screen / Esc
Printer-friendly Version Interactive Discussion
Discussion
P
a
per
|
Discussion
P
a
per
|
Discussion
P
a
per
|
Discussion
P
a
per
|
2.1 Arctic Research Center, Sodankylä, Finland (FMI)
The Finnish Meteorological Institute’s Arctic Research Centre (FMI-ARC) is situated in Sodankylä (67.368◦N, 26.633◦E) in the boreal forest of Northern Finland intermixed with heathland, bogs, and open water (e.g. Rautiainen et al., 2012; Ikonen et al., 2015). Towards the north the forest gives way to tundra where the three latter surface types
5
dominate. The prevailing soil type in aereated zones is podsol of mainly very sandy texture and overlying organic surface layers. A soil moisture and soil temperature net-work (Ikonen et al., 2015) is distributed in different land cover and soil types around the Sodankylä Research Center. At the 6 stations installed in 2011/12, Decagon 5TE Sensors were placed at 5, 10, 20, 40, and 80 cm depths, whereby the top layers (5 and
10
10 cm depth) hold three sensors each. Recently, two new stations were added using another soil moisture sensor type, whose calibration is planned for the near future.
2.1.1 Laboratory calibration samples
In the vicinity of two contrasting network stations samples were collected for labora-tory calibration (Sect. 4.1): at station “UG Forest 1” one sample was taken from the
15
organic surface layer (“FMI_Forest_O_L”, 0–5 cm depth) along with one sample from the underlying sandy A-horizon at 10–15 cm depth (“FMI_Forest_M_L”). At station “HA Open 1”, situated on heathland within a forest clearing, a pronounced organic surface layer is missing. There, samples were excavated from the sandy A-horizon at 0–5 cm (“FMI_Heath_M1_L”) and 10–15 cm depth (“FMI_Heath_M2_L”), respectively.
20
2.1.2 Validation data
During summer 2012, a ThetaProbe measurement campaign took place around the same two network stations in order to assess soil moisture spatial variability. On 20 days hand-held measurements were taken from the surface in 1 m×1 m grid cells inside a 30 m×30 m area. While a certain number of grid cells was randomly chosen on each
GID
5, 447–493, 2015Soil moisture sensor calibration for organic soil surface
layers
S. Bircher et al.
Title Page
Abstract Introduction
Conclusions References
Tables Figures
◭ ◮
◭ ◮
Back Close
Full Screen / Esc
Printer-friendly Version Interactive Discussion
Discussion
P
a
per
|
Discussion
P
a
per
|
Discussion
P
a
per
|
Discussion
P
a
per
|
campaign day, the three grid cells closest to the three Decagon 5TE sensors at 0–5 cm depth were always sampled, with 5 repetitions per cell. This dataset did not take part in the calibration process and thus was used for the validation of the derived calibration fit functions (Sects. 4.3 and 5.4).
2.2 Gludsted Plantation, Denmark (HOBE) 5
The Danish site is situated in the Skjern River Catchment in Western Denmark and has been intensely investigated in the framework of the Danish Center for Hydrology HOBE (Jensen and Illangasekare, 2011). Soil samples were collected within the Glud-sted spruce plantation (56.074◦N, 9.334◦E) in forested parts as well as heathland. The
naturally occurring soil type is a podsol of coarse sandy texture with pronounced
or-10
ganic surface layers. A soil moisture and soil temperature measurement station, part of a spatially distributed network (Bircher et al., 2012a) spanning a subcatchment (∼40 km×40 km), is installed in the forest with Decagon 5TE sensors at 5, 25, and 55 cm depths of the mineral soil as well as in the organic surface layer. Recently, fur-ther stations using the same set-up were dispersed within the plantation covering the
15
footprint of a Cosmic-ray neutron detector (∼600 m×600 m, Andreasen et al., 2015).
2.2.1 Laboratory calibration samples
For laboratory calibration (Sect. 4.1), two samples, “HOBE_Forest_O1_L” and “HOBE_Forest_O2_L”, were taken from organic surface layers (0–5 cm depth) in the vicinity of two forest network stations. Additionally, at the location
20
where “HOBE_Forest_O1_L” was extracted, a mineral sample was collected (“HOBE_Forest_M_L”, 10–15 cm depth).
2.2.2 Field calibration data
At the location where the sample “HOBE_Forest_O1_L” was taken, a field calibration experiment (Sect. 4.2) took place. The resulting data series “HOBE_Forest_O_F”
GID
5, 447–493, 2015Soil moisture sensor calibration for organic soil surface
layers
S. Bircher et al.
Title Page
Abstract Introduction
Conclusions References
Tables Figures
◭ ◮
◭ ◮
Back Close
Full Screen / Esc
Printer-friendly Version Interactive Discussion
Discussion
P
a
per
|
Discussion
P
a
per
|
Discussion
P
a
per
|
Discussion
P
a
per
|
clude some additional Decagon 5TE-ThetaProbe-gravimetric sample couples available from the organic surface layers around other Decagon forest stations within the Danish Gludsted Plantation, taken in the scope of the Cosmic-ray neutron detector calibration. In order to further increase the number of field calibration points some measure-ments acquired during an L-band radiometer and off-ground multi-frequency GPR
cam-5
paign in 2013 (Jonard et al., 2014) were added to the database. A large soil patch from a heathland within the Gludsted Plantation was transported to the Research Center Jülich, Germany, and reinstalled below the radiometer tower using a con-trolled setup. The here considered soil moisture data originate from the organic surface layer (“HOBE_Heath_O_F”, 0–5 cm depth) as well as the underlying sandy A-horizon
10
(“HOBE_Heath_M_F”, 10–15 cm depth) measured during this campaign by means of Decagon 5TE sensors, ThetaProbes, and gravimetric samples.
2.3 Additional organic samples
In Fall 2013, the Centre d’Etudes Spatiales de la Biosphère (CESBIO), Toulouse, col-lected two peat samples in neighboring bogs (“ISL_O_L”) on the Island Islay in Western
15
Scotland (55.743◦N, 6.178◦W). Additionally, the Laboratoire d’Etudes en Géophysique
et Océanographie Spatiales (LEGOS), Toulouse, provided organic samples taken on the West Siberian Plain during their field campaigns from a tundra area in Summer 2012 (65.910◦N, 74.659◦E) and a bog in Summer 2013 (56.941◦N 82.607◦E), labelled
“SIB_O_L”.
20
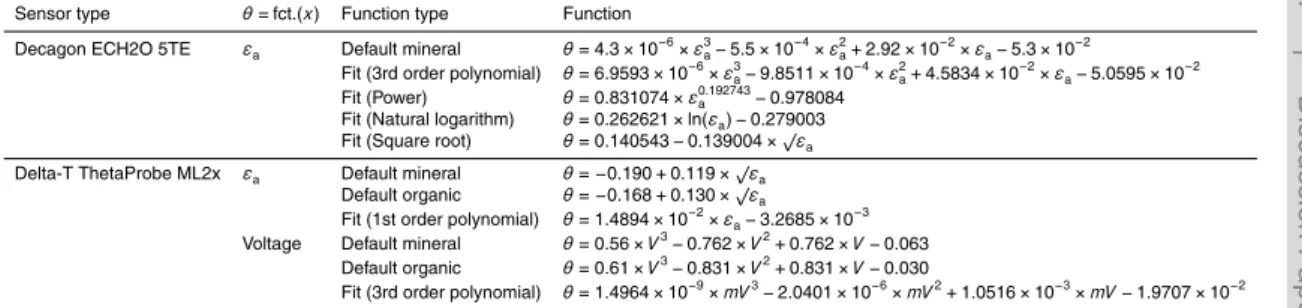
3 Soil moisture sensors
3.1 Decagon ECH2O 5TE
The Decagon ECH2O 5TE sensor is based on the capacitance method to measure the medium around three 5.2 cm long prongs at 70 MHz frequency (Decagon Devices Inc., 2014). The plastic-coated sensor head is sensitive to the surrounding permittivity
GID
5, 447–493, 2015Soil moisture sensor calibration for organic soil surface
layers
S. Bircher et al.
Title Page
Abstract Introduction
Conclusions References
Tables Figures
◭ ◮
◭ ◮
Back Close
Full Screen / Esc
Printer-friendly Version Interactive Discussion
Discussion
P
a
per
|
Discussion
P
a
per
|
Discussion
P
a
per
|
Discussion
P
a
per
|
and thus, should be completely covered by the medium. When using a Decagon Em50 digital/analog data logger εa can be estimated dividing the raw sensor output by 50.
By default, the Topp equation for mineral soils (Topp et al., 1980) is used to calculate soil moisture. Besides, the probe also provides temperature and electrical conductivity measurements. The Decagon 5TE sensor as well as its predecessor TE have been
5
tested in several studies (e.g. Kizito et al., 2008; Saito et al., 2009; Assouline et al., 2010; Rosenbaum et al., 2010 and 2011; Sakaki et al., 2011; Varble and Chavez, 2011; Ganjegunte et al., 2012; Vaz et al., 2013). To our knowledge only one calibration curve for organic material has previously been reported. However, this function by Vaz et al. (2013) is based on a sample from an artificial organic plant potting mix and was
10
never tested in organic material from a natural soil horizon. It was only calibrated up to a water content of∼0.35 m3m−3
and without burying the sensor head in the material. Some of the probe’s characteristics are listed in Table 3 including information from the manufacturer manual as well as findings by Vaz et al. (2013). Soil moisture accu-racy in mineral soils is around 0.03–0.04 cm3cm−3 (applying the Topp equation), and
15
the diameter of the probe’s sensitivity lies in the range of approximately 4–8 cm. In the framework of HOBE, the Decagon 5TE sensor has been previously evaluated for near-surface sandy soil layers in the Skjern River Catchment. Using Topp’s equation, both, Vasquez and Thomsen (2010) and Bircher et al. (2012a) independently found the sensor to be accurate within±0.02–0.03 cm3cm−3under coniferous forest, heathland,
20
as well as in agricultural fields.
3.2 Delta-T ThetaProbe ML2x
The Delta-T ThetaProbe ML2x is a soil moisture sensor with four 6 cm long steel rods building an array whose impedance varies with the moisture content of the measured medium (Delta-T Devices Ltd., 1999). The corresponding voltage outputV at 100 MHz 25
can be converted into the soil’s apparent relative permittivity, using√εa=1.07+6.4V−
6.4V2+4.7V3 (Gaskin and Miller, 1996). εa can then be related to moisture content
GID
5, 447–493, 2015Soil moisture sensor calibration for organic soil surface
layers
S. Bircher et al.
Title Page
Abstract Introduction
Conclusions References
Tables Figures
◭ ◮
◭ ◮
Back Close
Full Screen / Esc
Printer-friendly Version Interactive Discussion
Discussion
P
a
per
|
Discussion
P
a
per
|
Discussion
P
a
per
|
Discussion
P
a
per
|
has been evaluated in different studies and calibration functions are already reported for a range of natural organic substrates (e.g. Kurum et al., 2012; Overduin et al., 2005; Yoshikawa et al., 2004), and artificial potting/compost substrates (e.g. Nemali et al., 2007; Kargas and Kerkides, 2008; Kang et al., 2010; Vaz et al., 2013). Major probe characteristics are listed in Table 3. Soil moisture accuracy in mineral soils is
5
around 0.03–0.05 cm3cm−3 (applying factory-supplied calibration), and the diameter of the probe’s sensitivity lies in the range of approximately 2–4 cm.
4 Method
4.1 Laboratory calibration measurements
Laboratory sensor calibrations for the organic and mineral substrates collected in
Fin-10
land and Denmark (specified in Sects. 2.1.1 and 2.2.1) were carried out at the re-spective institutions, following the same protocol. As organic material can be strongly affected by shrinkage during drying (e.g. Schaap et al., 1996; Pumpanen and Ilves-niemi, 2005), a significant error might occur when assuming a constant bulk density over the entire water content range. To avoid this issue the material was initially
satu-15
rated and was then allowed to undergo a dry down to account for the changing volume. The saturated bulk densities of the respective soils were previously estimated from field samples and the collected saturated material was packed accordingly into large buck-ets. In the center of each bucket one Decagon 5TE sensor was installed permanently at the surface and in a horizontal fashion with the blade in vertical direction, in order
20
to avoid ponding of water on the sensor. Distances to the bucket borders were clearly larger than the maximum diameter of the probe’s sensitivity (Table 3). The Decagon 5TE readings were logged continuously, while ThetaProbe measurements and gravi-metric samples were taken from the surface at defined times. The ThetaProbe was pushed firmly into the substrate in order to assure good contact and avoid air gaps.
25
GID
5, 447–493, 2015Soil moisture sensor calibration for organic soil surface
layers
S. Bircher et al.
Title Page
Abstract Introduction
Conclusions References
Tables Figures
◭ ◮
◭ ◮
Back Close
Full Screen / Esc
Printer-friendly Version Interactive Discussion
Discussion
P
a
per
|
Discussion
P
a
per
|
Discussion
P
a
per
|
Discussion
P
a
per
|
extracted using steel rings of known volume. As buckets were of large sizes enough material for all the gravimetric samples was available without disturbing the sensor measurements and no backfilling of material was necessary. The samples were oven-dried at 105◦C during 24 h for the mineral soils and at 85◦C during 48 h for the organic material as practiced by Nagare et al. (2011). O’Kelly (2004) had found that around this
5
temperature mass loss due to charring balanced the effects of residual water caused by the strong water binding capacities of organic matter. Subsequently, the estimated gravimetric moisture contents were converted into volumetric moisture contents by the knowledge of the bulk density. Soil texture and organic carbon were determined us-ing standard procedures (sievus-ing as well as Malvern Mastersizer 2000 and loss on
10
ignition).
The samples from organic surface horizons in Siberia and Scotland (Sect. 2.3) were handled at CESBIO, France. They were not large enough to place Decagon 5TE sen-sors. Thus, only ThetaProbe readings (in triplicates) and respective gravimetric sam-ples were taken.
15
4.2 Field calibration measurements
During the field calibration experiment in the vicinity of one Danish forest network sta-tion (see Sect. 2.2.2), a Decagon 5TE sensor was installed in the organic horizon and logged continuously. After the first measurements of extremely dry conditions in sum-mer 2013, the soil was saturated. During the dry down three ThetaProbe readings and
20
gravimetric samples were acquired and averaged for each measurement in time. In case of these data and all additional field observations used in this study (Decagon 5TE – ThetaProbe – Gravimetric sample couples described in Sect. 2.2.2), sensor installation, measurement and drying protocols were identical to the ones described above for the laboratory calibration.
GID
5, 447–493, 2015Soil moisture sensor calibration for organic soil surface
layers
S. Bircher et al.
Title Page
Abstract Introduction
Conclusions References
Tables Figures
◭ ◮
◭ ◮
Back Close
Full Screen / Esc
Printer-friendly Version Interactive Discussion
Discussion
P
a
per
|
Discussion
P
a
per
|
Discussion
P
a
per
|
Discussion
P
a
per
|
4.3 Fitting of calibration functions and validation
All field and laboratory data were gathered and sensor output was plotted against volu-metric moisture content for Decagon 5TE/ThetaProbe and organic/mineral samples, respectively. In case of continuously logged Decagon 5TE data, the two measure-ments closest to each ThetaProbe/sample timestamp were extracted and averaged.
5
The number of available points per site and sensor type is indicated in Table 1. Sensor calibrations based on our measurements were carried out for the ensemble of data measured in the organic horizons of all studied sites, while for the data from underlying mineral soil layers the validity of the manufacturer calibrations was tested. Calibration curves were fitted through the data using mathematical descriptions already reported
10
in literature on soil moisture sensor calibration. For Decagon 5TE data pairs of ap-parent relative permittivity readings vs. volumetric moisture contents this included 3rd order polynomial, power, natural logarithm, and square root functions. With respect to the ThetaProbe, fit functions were derived for both, output voltage-volumetric moisture and apparent relative permittivity-volumetric moisture pairs, (3rd and 1st order
polyno-15
mial, respectively) as they are equally used in many studies. The fitted functions were compared with corresponding manufacturer calibration curves as well as calibrations reported in literature (specified in Sect. 5.3).
To further validate the proposed fit functions, Decagon 5TE and ThetaProbe soil moisture time series from two Sodankylä network stations recorded during summer
20
2012 and not used in the calibration process (see Sect. 2.1.2) were compared to test whether the soil moisture from the two sensor types agreed. At both, the “UG Forest 1” and “HA Open 1” sites, one of the three Decagon 5TE sensors at 5 cm depth was cho-sen for the exercise together with the immediately adjacent ThetaProbe surface data, whose 5 readings per day were averaged. In case of the Decagon 5TE data the mean
25
GID
5, 447–493, 2015Soil moisture sensor calibration for organic soil surface
layers
S. Bircher et al.
Title Page
Abstract Introduction
Conclusions References
Tables Figures
◭ ◮
◭ ◮
Back Close
Full Screen / Esc
Printer-friendly Version Interactive Discussion
Discussion
P
a
per
|
Discussion
P
a
per
|
Discussion
P
a
per
|
Discussion
P
a
per
|
manufacturer default calibrations as well as newly derived fit functions were compared. Thereby, the ThetaProbe “organic” default function was chosen, while for the Decagon 5TE sensor the only available Topp et al. (1980) equation for mineral soils was applied. For the low organic mineral surface soil at the “HA Open 1” site default functions for mineral soils provided by the manufacturers were considered. To get a better insight
5
into the temporal evolution of the soil moisture pattern over time, hourly rainfall intensi-ties (R_1H) measured at Tähtelä at the center of the Sodankylä research area (∼0.5 and 2.5 km distance from the “HA Open 1” and “UG Forest 1” network stations) were plotted along.
For the statistical analysis throughout our study the Pearson’s correlation coeffi
-10
cient (R), bias (mean difference between excepted and measured values), and bias-corrected Root Mean Square Deviation (RMSD) were computed.
5 Results and discussion
5.1 Sensor output – volumetric moisture content response
Figure 2 depicts the Decagon 5TE and ThetaProbe output (εa and voltage, respec-15
tively) separately plotted against the volumetric moisture content for the studied organic (>30 % SOM) and mineral soil horizons (<30 % SOM). The corresponding
manufac-turer calibration curves are depicted as well. Additionally, points were color coded to distinguish between SOM contents (see Table 1 for SOM contents of the respective samples), while data obtained from laboratory and field measurements are
discrimi-20
nated by different symbol types.
Despite the scatter in the data measured in organic layers a clear trend is detectable irrespectively of the sample location or humus type. Furthermore, for both sensor types, the field measurements under less disturbed conditions are also in good agreement with the laboratory data.
GID
5, 447–493, 2015Soil moisture sensor calibration for organic soil surface
layers
S. Bircher et al.
Title Page
Abstract Introduction
Conclusions References
Tables Figures
◭ ◮
◭ ◮
Back Close
Full Screen / Esc
Printer-friendly Version Interactive Discussion
Discussion
P
a
per
|
Discussion
P
a
per
|
Discussion
P
a
per
|
Discussion
P
a
per
|
For the mineral soils with a SOM content below 10 % both Decagon 5TE and ThetaProbe data scatter around the respective manufacturer calibration curves, and thus, demonstrate the validity of the latter. In case of the Decagon 5TE sensor this un-derlines earlier results by Vasquez and Thomsen (2010) and Bircher et al. (2012a) who also found the sensor to be accurate within±0.02–0.03 cm3cm−3in sandy A-horizons
5
with low organic matter contents using default Topp’s equation.
In contrast, for the mineral samples with a SOM exceeding 10 % the trends in the data differ for both sensor types. While for the ThetaProbe the data of increased SOM content show a behavior comparable to the measurements in mineral soils with SOM<10 %, in the respective Decagon 5TE data a clear tendency towards a decrease 10
in apparent relative permittivities at given moisture contents can be observed. For the measurements in the organic horizons (>30 % SOM), this trend of decreasingεa for
a given moisture content with increasing SOM content is even more distinct. Especially at higher moisture contents a more or less constant offset is detectable, while below
∼0.4 cm3cm−3an increase in curvature is observable, indicating only a small change 15
inεafor a relatively large change in soil moisture. This behavior is in good agreement
with observations from TDR readings (e.g. Topp et al., 1980; Roth et al., 1992; Paquet et al., 1993; Kellner and Lundin, 2001; Jones et al., 2002), and can be explained by the substantial fraction of bound water on the large surface area of the organic material. Considerable amounts of rotationally hindered water molecules result in the recording
20
of lower apparent relative permittivities for organic-rich materials compared to mineral soils for the same water content. Adsorption forces decrease exponentially with in-creasing distance to the solid surface. At low water contents where first layers affected by binding forces closest to solid surfaces are filled, an increase in moisture content barely increasesεa. Once these layers are filled, a further increase in moisture level 25
results in a more rapid rise ofεa. Hence, the offset compared to the sensor response
GID
5, 447–493, 2015Soil moisture sensor calibration for organic soil surface
layers
S. Bircher et al.
Title Page
Abstract Introduction
Conclusions References
Tables Figures
◭ ◮
◭ ◮
Back Close
Full Screen / Esc
Printer-friendly Version Interactive Discussion
Discussion
P
a
per
|
Discussion
P
a
per
|
Discussion
P
a
per
|
Discussion
P
a
per
|
data suggest that if more such Decagon 5TE readings were collected in the future, an attempt could be made to derive a calibration law for mineral horizons as function of SOM content. In purely organic horizons bound water effects are most pronounced, whereby, above 30 % SOM content the dependency of the magnitude of bound water effects on the SOM content seems to level off, meaning that no further decrease ofεa 5
with augmenting soil organic matter is clearly detectable.
In contrast, the ThetaProbe data for the organic soil layers show a closer match between our soil moisture measurements and soil moisture computed based on the default calibrations for mineral and organic substrates. It is worthwhile noting that there is only a small difference in the soil moisture estimation between the two default
calibra-10
tion curves whilst their shape remains consistent. Nevertheless, in the medium to high range of the sensor outputs (600–1000 mV) for the organic samples the default curves are not able to reproduce our measurements due to more pronounced curvature in our data. This results in (1) a tendency towards increased sensor output at a given mois-ture content compared to both default curves in the middle range, and (2) saturation in
15
the sensor’s response around 1000 mV.
In conclusion, one can state that for both sensor types deviating sensor outputs in case of measurements conducted in organic horizons compared to mineral layers with low SOM content are clearly demonstrated. The scatter in the data from organic horizons is in comparable range as reported for similar calibration studies using TDR
20
sensors (e.g. Schaap et al., 1996; Kellner and Lundin, 2001; Pumpanen and Ilvesniemi, 2005; Nagare et al., 2011). Thereby, the spread is always higher for organic substrates compared to mineral soils due to the complex nature of the former. However, no distinct differences in measurements’ behavior from samples ranging a variety of humus types and acquired by different users are noticeable. Based on this first analysis it can be
25
hypothesized that for each sensor type one calibration function should hold for reliable estimates of the moisture content in organic surface horizons (>30 % SOM) of different
GID
5, 447–493, 2015Soil moisture sensor calibration for organic soil surface
layers
S. Bircher et al.
Title Page
Abstract Introduction
Conclusions References
Tables Figures
◭ ◮
◭ ◮
Back Close
Full Screen / Esc
Printer-friendly Version Interactive Discussion
Discussion
P
a
per
|
Discussion
P
a
per
|
Discussion
P
a
per
|
Discussion
P
a
per
|
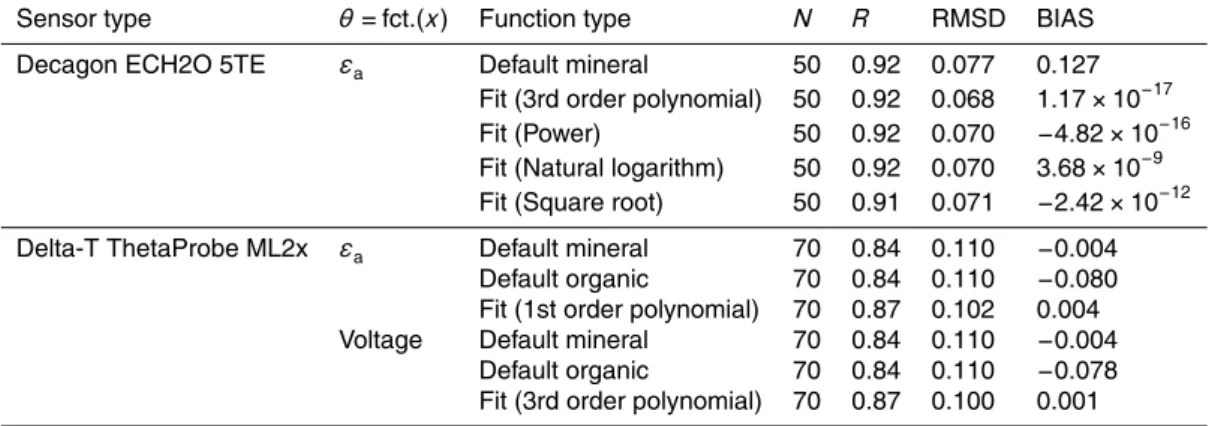
5.2 Curve fits for organic material
Figure 3 illustrates the calibration curves fitted through the data measured in the dif-ferent organic soil layers. For the Decagon 5TE sensor different functions (3rd order polynomial, power, natural logarithm and square root functions) were tested. In case of the ThetaProbe, fit functions were derived based on 1st and 3rd order polynomial
5
functions for εa and output voltage to volumetric moisture content, respectively. For
comparison, manufacturer calibration curves are als included in the plots. All functions shown in Fig. 3 are listed in Table 4 and the corresponding fitting statistics are pre-sented in Table 5.
For the Decagon 5TE sensor, the statistics show no clear difference between the
10
different tested fit functions. Compared to the manufacturer calibration all of them result in a significantly decreased bias and an improved RMSD whileR remains unchanged.
Based on a visual inspection the natural logarithmic fit seems to most closely follow the measured data with a more pronounced curvature at low moisture contents up to about 0.2 cm3cm−3, and a similar curvature as the mineral default function for higher
15
moisture contents.
For the ThetaProbe the 3rd order polynomial fit between the sensors millivolt (mV) output and the measured soil moisture shows a similar curve shape as the default functions for mineral and organic substrates, but with the aforementioned increased curvature. Meanwhile, a steeper slope compared to the quasi linear default curves
be-20
comes apparent in case of the 1st order polynomial fit through theεa-moisture content
couples. For both new functions (mV-moisture content and εa-moisture content), the R and RMSD improved slightly, whereas the bias stayed in the order of the default
function for mineral soils, which is clearly lower than for the default function for organic materials.
GID
5, 447–493, 2015Soil moisture sensor calibration for organic soil surface
layers
S. Bircher et al.
Title Page
Abstract Introduction
Conclusions References
Tables Figures
◭ ◮
◭ ◮
Back Close
Full Screen / Esc
Printer-friendly Version Interactive Discussion
Discussion
P
a
per
|
Discussion
P
a
per
|
Discussion
P
a
per
|
Discussion
P
a
per
|
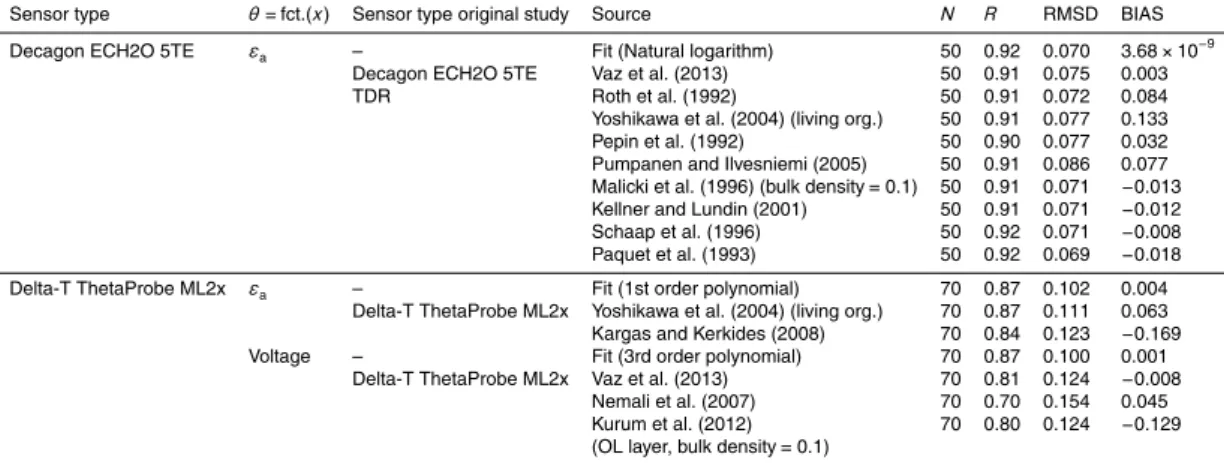
5.3 Comparison of fitted vs. literature calibrations for organic materials
Figure 4 displays the functions fitted to our organic samples (only the selected logarith-mic function for Decagon 5TE) together with petrophysical or empirical relationships for organic samples taken from literature. In case of the Decagon 5TE sensor this includes the calibration for an organic plant potting mix reported by Vaz et al. (2013) for the same
5
sensor type as well as the following calibration laws for organic samples obtained from TDR measurements: Pepin et al. (1992), Roth et al. (1992), Paquet et al. (1993), Mal-icki et al. (1996) using a bulk density of 0.1 g cm−3, Schaap et al. (1996), Kellner and Lundin (2001), Yoshikawa et al. (2004) for living sphagnum, and Pumpanen and Ilves-niemi (2005). Concerning the ThetaProbe, only functions derived for organic soil layers
10
with the same sensor type were selected, namely those of Nemali et al. (2007), Kurum et al. (2012) for an OL layer using a bulk density of 0.1 g cm−3, and Vaz et al. (2013) for the relationship between mV output and moisture content (plotted in the upper right panel), and Yoshikawa et al. (2004, living sphagnum) as well as Kargas and Kerkides (2008) for the relationship betweenεa and moisture content (plotted in the lower right 15
panel), respectively. Corresponding statistics are listed in Table 6.
The natural log fit and the calibration proposed by Vaz et al. (2013) applied to our data exhibit a similarR value, while both RMSD and bias increased for the latter. The
two curves follow each other closely within the calibration range of Vaz et al. (2013), while they deviate beyond a water content of∼0.5 cm3cm−3due to a more pronounced
20
curvature of our natural log fit. Good agreement within the calibrated range of two curves derived from different natural organic horizons and a plant potting mix further strengthens confidence that the type and structure of organic material does not dras-tically affect the measurements themselves. And the same seems to account for the application with or without burying the sensor head in the materials, as practiced in this
25
GID
5, 447–493, 2015Soil moisture sensor calibration for organic soil surface
layers
S. Bircher et al.
Title Page
Abstract Introduction
Conclusions References
Tables Figures
◭ ◮
◭ ◮
Back Close
Full Screen / Esc
Printer-friendly Version Interactive Discussion
Discussion
P
a
per
|
Discussion
P
a
per
|
Discussion
P
a
per
|
Discussion
P
a
per
|
For the functions derived from TDR measurements in organic soil layers R values
also stayed in the same order as for our fitted functions. Compared to our best suited function (natural log fit) the ones proposed by Paquet et al. (1993), Schaap et al. (1996), Kellner and Lundin (2001), and Malicki et al. (1996) using a bulk density of 0.1 cm3cm−3 (curves in blue colors), lie in the same range with very similar RMSD, and small (though
5
some order of magnitudes larger) bias of around ±0.01 cm3cm−3. Furthermore, the curvatures of these functions are slightly less pronounced either in the dry or wet range. Other functions (curves in green colors) are clearly offset with mostly larger RMSD, sig-nificantly larger bias (above 0.03 cm3cm−3) and less curvature (Pepin et al., 1992; Roth et al., 1992; Yoshikawa et al., 2004; Pumpanen and Ilvesniemi, 2005). While the
ab-10
solute match between the calibration curves for organic material of the Decagon 5TE sensor and the TDR based ones is not always good, it is still worthwhile noting that they all show the same general curve shape. The discrepancies between these diff er-ent calibration laws presumably arise from the different sensor designs, measurement principles, and measurement frequencies used as also pointed out by Vaz et al. (2013).
15
For the ThetaProbe mV vs. moisture content relationship all considered calibrations show very similar behavior as the default calibrations up to∼0.2 cm3cm−3
. However, at higher moisture contents the curves start deviating significantly without a clear pat-tern. Like our 3rd order polynomial fit the function reported by Vaz et al. (2013) exhibits the same type of shape as the default functions though with weaker curvature.
Mean-20
while, the Nemali et al. (2007) and Kurum et al. (2012) functions show differing char-acteristics. In any case, the statistics in terms of all measures clearly deteriorate when applying other calibration laws to our data. The Nemali et al. (2007) curve and our fit function were calibrated even for high moisture contents (0.8–0.9 cm3cm−3), while the Vaz et al. (2013) and Kurum et al. (2012) fits were derived only for low to moderate
25
moisture contents up to 0.3–0.35 cm3cm−3.
In case of the ThetaProbeεavs. moisture content calibration, all included calibration
laws perform similarly well in terms ofR, while those of Kargas and Kerkides (2008)
GID
5, 447–493, 2015Soil moisture sensor calibration for organic soil surface
layers
S. Bircher et al.
Title Page
Abstract Introduction
Conclusions References
Tables Figures
◭ ◮
◭ ◮
Back Close
Full Screen / Esc
Printer-friendly Version Interactive Discussion
Discussion
P
a
per
|
Discussion
P
a
per
|
Discussion
P
a
per
|
Discussion
P
a
per
|
for the two specified functions). The Kargas and Kerkides (2008) curve (calibrated up to 0.75 cm3cm−3) exhibit a shape similar to the default curves though with lower εa
at a given moisture content. Yoshikawa et al. (2004) show a more analog trend to our data with larger εa for a given moisture content compared to the mineral default
curve and deviation starts above 0.3 cm3cm−3when leaving the Yoshikawa et al. (2004)
5
calibration range.
The presented results indicate that for the ThetaProbe data a clear consistency be-tween measurements, fitted functions, theory and literature calibrations is lacking. As practiced in our experimental setup, Nemali et al. (2007), Kurum et al. (2012), and Vaz et al. (2013) also removed and re-inserted the ThetaProbe after each measurement,
10
while in the studies by Yoshikawa et al. (2004) and Kargas and Kerkidis (2008) probes remained installed throughout the entire experiments. Certainly, a hand-held applica-tion with slightly changed sampling locaapplica-tion each time results in increased data vari-ability compared to permanently installed probes, the effect being more pronounced in organic substrate of complex structure compared to more homogeneously distributed
15
mineral soils. However, irrespectively of the two approaches used, no clear difference is detectable in the functions’ curve shapes. Another plausible explanation for the nonuni-form behavior could be the ThetaProbe’s rod configuration that significantly concen-trates the electromagnetic field around the central electrode, resulting in a small sam-pling volume (Table 3). This drawback was already raised by Robinson et al. (1999)
20
and Vaz et al. (2013) who stated that this possibly renders the measurements more sensitive to compaction during the insertion of the instrument as the effect is most dis-tinct around the probe’s center. Additionally, this problem becomes more important as moisture content increases. This would clarify why the agreement between different calibration curves is best at very small water contents and deteriorates more and more
25
GID
5, 447–493, 2015Soil moisture sensor calibration for organic soil surface
layers
S. Bircher et al.
Title Page
Abstract Introduction
Conclusions References
Tables Figures
◭ ◮
◭ ◮
Back Close
Full Screen / Esc
Printer-friendly Version Interactive Discussion
Discussion
P
a
per
|
Discussion
P
a
per
|
Discussion
P
a
per
|
Discussion
P
a
per
|
5.4 Comparison of soil moisture time series at two Sodankylä network sites
Figure 5 shows the comparison of average Theta Probe and Decagon 5TE soil mois-ture estimates collected in Sodankylä during summer 2012. Time series and scatter plots of soil moisture measured in 0–5 cm depth from the “HA Open 1” network station with low organic mineral soil as well as at the “UG Forest 1” network station with a
pro-5
nounced organic surface layer are depicted. For the ThetaProbe average of 5 readings respective standard deviations are displayed in form of errorbars. Hourly rainfall inten-sities (R_1H) are also plotted along. Details on the applied calibration functions as well as corresponding statistics are given in Table 7.
The measurements of the two sensor types at the “HA Open 1” site are in very good
10
agreement using the default calibrations for mineral soils. In contrast, applying the most appropriate default calibrations available for the two sensors at the “UG Forest 1” site, a pronounced difference in soil moisture content is detectable. Thereby the ThetaProbe soil moisture estimates are much wetter and their range much larger compared to the Decagon 5TE sensor. When using our fit functions derived for organic material
15
(3rd order polynomial for ThetaProbe and natural logarithm for Decagon 5TE), the agreement becomes much better with significantly decreased RMSD and bias. Also, it now nicely stands out that the mean soil moisture level of the sandy mineral soil is lower but with larger temporal dynamics compared to the organic surface layer. This behavior is expected due to low and high water retention capacities of the two materials,
20
respectively.
Only the correlation between the two sensors remains still low in case of the organic layer, especially caused by the observed scatter in the ThetaProbe data obtained by a hand-held application with constantly changed sensor locations. This scatter is in sim-ilar range with the data variability presented by Kurum et al. (2012), and significantly
25
GID
5, 447–493, 2015Soil moisture sensor calibration for organic soil surface
layers
S. Bircher et al.
Title Page
Abstract Introduction
Conclusions References
Tables Figures
◭ ◮
◭ ◮
Back Close
Full Screen / Esc
Printer-friendly Version Interactive Discussion
Discussion
P
a
per
|
Discussion
P
a
per
|
Discussion
P
a
per
|
Discussion
P
a
per
|
are a consequence of more complex structure compared to the more homogeneously distributed sandy soil encountered at the “HA Open 1” site, possibly intensified by compaction effects originating from the suceptible sensor. However, irrespectively the cause, the newly derived fit functions clearly outperform the default calibration functions at the “UG Forest 1” site.
5
We suggest that these new ThetaProbe calibrations for organic substrates should only be used for the probe application method they were derived from, i.e. hand-held. In that case, even if soil moisture data acquired using the ThetaProbe in organic-rich soils should be interpreted carefully, the sensor used together with the here proposed calibration functions proofs robust and of value for the acquisition of quick and
instanta-10
neous information about the moisture content for large areas, as for example practiced in airborne campaigns for satellite Cal/Val purposes (e.g. Cosh et al., 2005, Bircher et al., 2012b). There, averaging over larger sets of readings will further balance out differing compaction and heterogeneity effects in individual readings – compared to our example where the mean of only 5 ThetaProbe readings was taken for comparison
15
with point station data.
Finally, comparison with hourly rainfall intensities shows that the Decagon 5TE soil moisture time series estimated using the newly developed calibration function also well reflect the precipitation pattern, demonstrating the sensor’s ability to yield reliable soil moisture time series in both mineral and organic substrates. Based on the very
20
satisfying overall performance of the derived natural log fit function, it was applied in the calculation of the Decagon 5TE network soil moisture from organic surface layers at the Sodankylä and HOBE study sites to improve the quality in the so far gathered data.
6 Summary and conclusions 25
GID
5, 447–493, 2015Soil moisture sensor calibration for organic soil surface
layers
S. Bircher et al.
Title Page
Abstract Introduction
Conclusions References
Tables Figures
◭ ◮
◭ ◮
Back Close
Full Screen / Esc
Printer-friendly Version Interactive Discussion
Discussion
P
a
per
|
Discussion
P
a
per
|
Discussion
P
a
per
|
Discussion
P
a
per
|
is a key research topic. With the purpose of serving coarse resolution satellite remote sensing and land surface modeling studies, Decagon 5TE sensors are applied in per-manent soil moisture networks while ThetaProbes are used for hand-held soil moisture measurement campaigns. Because both locations are characterized by organic-rich soils, a joined effort aimed at calibrating these two electromagnetic sensor types for
5
organic surface layers with SOM contents above 30 %. While some ThetaProbe cali-bration efforts for organic soil horizons are present in literature, for the Decagon 5TE sensor such a calibration function has only been reported for an artificial organic mate-rial measured throughout a limited water content range (Vaz et al., 2013). The objective of the here presented study was to provide generic and widely applicable calibrations
10
for both studied sensor types holding for a variety of natural organic substrates as en-countered within the large areas under consideration. Necessarily these functions hold a decreased degree of detail and might lack high accuracy, but will clearly outperform standard calibration functions reported by the manufacturers. The used soil samples originated from different locations in northern regions, mainly including the Sodankylä
15
and HOBE network areas, spanning a wide range of different humus types. We believe that a reliable calibration approach has been worked out with (1) the same measure-ment and calibration protocol followed at all sites, (2) comparison of data from organic and mineral horizons including laboratory and field measurements, and (3) considera-tion of material-specific characteristics such as shrinkage and charring during drying.
20
For both, the Decagon 5TE sensor and the ThetaProbe, the variety of organic sam-ples showed a consistent sensor output-moisture content response. Likewise, this was the case when the laboratory experiment was repeated in the field under less dis-turbed conditions, demonstrating independence of the acquired data from the chosen experimental setup. Deviating sensor outputs for measurements conducted in organic
25
horizons (>30 % SOM) compared to mineral layers were clearly identified (see Table 1
con-GID
5, 447–493, 2015Soil moisture sensor calibration for organic soil surface
layers
S. Bircher et al.
Title Page
Abstract Introduction
Conclusions References
Tables Figures
◭ ◮
◭ ◮
Back Close
Full Screen / Esc
Printer-friendly Version Interactive Discussion
Discussion
P
a
per
|
Discussion
P
a
per
|
Discussion
P
a
per
|
Discussion
P
a
per
|
tent exceeding 10 % the ThetaProbe data showed a behavior comparable to the mea-surements in mineral soils with SOM fraction<10 %, while in the respective Decagon
5TE data a clear tendency towards decreased εa at a given moisture content could
be observed. This effect became even more pronounced for the measurements in the organic horizons though it seemed to level off, meaning that beyond a SOM content of
5
30 % no further εa decrease with augmenting soil organic matter was clearly visible.
This behavior is in accordance with previous TDR studies (e.g. Topp et al., 1980; Roth et al., 1992; Paquet et al., 1993; Kellner and Lundin, 2001; Jones et al., 2002), and explicable by an increased bound water fraction in porous organic matter with a high surface area fraction compared to the underlying sandy mineral soils. In contrast, the
10
ThetaProbe data acquired from the organic soil layers showed a closer match with the manufacturer’s mineral and organic functions, though with more pronounced curvature. Based on the above results, for all data measured in the organic horizons one cal-ibration function was derived per sensor type. A natural logarithm and 1st order poly-nomial were fitted through theεaand soil moisture couples for the Decagon 5TE and 15
ThetaProbe sensors, respectively. In case of the ThetaProbe, a 3rd order polynomial was selected for the corresponding pairs of voltage and soil moisture.
The fact that there was no clear difference in the data obtained from the different sam-pling sites spanning a variety of humus types and acquired by different users strength-ens confidence that the derived calibration functions are not only site specific but can
20
be applied over a wide range of locations and organic materials of differing charac-teristics and SOM contents. This renders them highly suitable to support large-scale remote sensing and land surface modeling studies.
In case of the Decagon 5TE sensor the reliability of the proposed calibration function is further underlined by the fact that it obeys the theory of increased bound water
25

![Figure 2. Decagon 5TE apparent relative permittivity ε a (left) and ThetaProbe voltage [mV]](https://thumb-eu.123doks.com/thumbv2/123dok_br/17290605.247999/44.918.130.577.44.463/figure-decagon-apparent-relative-permittivity-left-thetaprobe-voltage.webp)
![Figure 3. Fitting functions for the Decagon 5TE apparent relative permittivity ε a (left column), and ThetaProbe voltage [mV] (upper right column) as well as ε a (lower right column) against volumetric moisture content θ including manufacturer’s default ca](https://thumb-eu.123doks.com/thumbv2/123dok_br/17290605.247999/45.918.104.610.135.435/functions-apparent-relative-permittivity-thetaprobe-volumetric-including-manufacturer.webp)
