February, 2016
Teresa Silva Serradas Duarte
Bachelor of Sciences in Biomedical Engineering
Detailing Myocardial B
0across the Cardiac Cycle at
UHF:
B
0Assessment and Implications for Susceptibility-based
CMR Techniques
Thesis to obtain a Master Degree in Biomedical Engineering
Supervisor: Thoralf Niendorf, Ph.D.
Berlin Ultrahigh Field Facility (B.U.F.F)
Max Delbrück Center for Molecular Medicine in the Helmholtz Association Berlin, Germany
Committee:
President: Doutora Carla Maria Quintão Pereira
Referee: Doutor Ricardo Nuno Pereira Verga e Afonso Vigário Other: Doutor Thoralf Niendorf
𝛍 ⃗⃗ 𝛚𝟎
𝛄 2.675 × 10⁸ 𝛟
𝐵⃗ 0 𝜇 𝜇 = 𝛾𝐽 𝐽 𝛾 𝛾 = 2.675 × 10⁸ 𝛾/2𝜋 = 42.58 𝐵⃗ 0
𝜔0 𝜔0= 𝛾𝐵0 𝜇 𝐵⃗ 0 𝑀⃗⃗ 0> 0 𝑀0> 0 𝑆 = ℏ𝑚𝑠 𝑚𝑠 – 𝑠 +𝑠 𝑠 =1 2 (𝑚𝑠= ± 1 2) ∆𝐸 = ℏ𝜔0 ℏ 𝜇 𝐵⃗ 0 𝑀0
~1.054 × 10⁻³⁴ ∙ ∆𝐸 𝑁↑ 𝑁↓= 𝑒 ( ∆𝐸𝑘 𝐵𝑇) 𝑘𝐵 = 1.39 × 10⁻²³ 𝑁↓ 𝑁↑> 1 𝑀0≠ 0 𝑀⃗⃗ 0 𝐵⃗ 0 𝐵⃗ 0 𝐵⃗ 1 𝑀⃗⃗ 0
𝑀𝑧(𝑡) = 𝑀𝑧(0)𝑒− 𝑡𝑇1+ 𝑀0(1 − 𝑒− 𝑡𝑇1)
1 𝑇2∗= 1 𝑇2+ 1 𝑇2′ 1 𝑇2∗= 1 𝑇2+ 𝛾|∆𝐵| |∆𝐵|
𝐹𝐸 𝑣𝑜𝑥𝑒𝑙 𝑠𝑖𝑧𝑒 = 𝐹𝐸 𝐹𝑜𝑉 𝐹𝐸 𝑚𝑎𝑡𝑟𝑖𝑥
𝑃𝐸 𝑣𝑜𝑥𝑒𝑙 𝑠𝑖𝑧𝑒 = 𝑃𝐸 𝐹𝑜𝑉
𝑃𝐸 𝑚𝑎𝑡𝑟𝑖𝑥 𝑆𝑙𝑖𝑐𝑒 𝑣𝑜𝑥𝑒𝑙 𝑠𝑖𝑧𝑒 = 𝑠𝑙𝑖𝑐𝑒 𝑡ℎ𝑖𝑐𝑘𝑛𝑒𝑠𝑠
χ 𝐵⃗ 0 χ χ≈ χ 𝐵⃗ 0 χ 𝐵⃗ 0 𝐵⃗ 0 χ≈
𝜌̂(𝑡) ∝ 𝜌0∙ 𝑒− 𝑡𝑇2∗
𝜌̂(𝑡) 𝜌0
𝑡 ≈ 0
𝜙 𝜌(𝑟 , 𝑡) = 𝜌̂(𝑡) ∙ 𝑒−𝑖𝜙(𝑟 ,𝑡) 𝜙 𝜙 𝜙(𝑟 , 𝑇𝐸) = 𝜙0− 𝛾 Δ𝐵(𝑟 ) 𝑇𝐸 𝜙0 𝜙0 Δ𝐵(𝑟 ) Δ𝐵(𝑟 ) =𝜙(𝑟 , 𝑇𝐸2) − 𝜙(𝑟 , 𝑇𝐸1) 𝛾 (𝑇𝐸2− 𝑇𝐸1) Δ𝐵(𝑟 ) Δ𝐵(𝑟 ) 2𝜋(𝑇⁄ 𝐸2− 𝑇𝐸1)
[−𝜋, +𝜋]
𝑡 = 𝑇𝐸
ln 𝜌̂(𝑇𝐸) = ln 𝜌0− 𝑇𝐸 𝑇2∗
∇𝐹 = 𝜕𝐹 𝜕𝑥𝑖̂ + 𝜕𝐹 𝜕𝑦𝑗̂ + 𝜕𝐹 𝜕𝑧𝑘̂ 𝜕𝐵0 𝜕𝑥 𝑖̂ 𝜕𝐵0 𝜕𝑦 𝑗̂ 𝐺𝑥𝑦= √𝐺𝑥2+ 𝐺𝑦2 𝐺𝑥𝑦> 25 𝐻𝑧/𝑣𝑜𝑥𝑒𝑙
𝐺𝑧 = 𝐺𝑥𝑦× 𝑠𝑙𝑖𝑐𝑒 𝑡ℎ𝑖𝑐𝑘𝑛𝑒𝑠𝑠
𝐺𝑥𝑦𝑧 = √𝐺𝑥2+ 𝐺𝑦2+ 𝐺𝑧2
∆𝑇2∗= 𝑇
2∗− 𝑇1 2∗ 2
∆ 1 𝑇2∗= 1 𝑇2∗ 2 − 1 𝑇2∗ 1 = ( 1 𝑇2 2 − 1 𝑇2 1 ) + 𝛾( |∆𝐵|2 − |∆𝐵|1 ) ∆ (1 T⁄ ) = 02 𝑇2∗ 1 = 𝑇 2∗− ∆ 𝑇2∗ 2 ∆𝑇2∗= 𝑇 2∗∙ (1 − 1 1 − 𝑇2 2∗∙ 𝛾( |∆𝐵|2 − |∆𝐵|1 )) 2 ( |∆𝐵|2 − |∆𝐵|1 ) ( |∆𝐵|2 − |∆𝐵|1 ) 𝑝 < 0.05
𝑇2∗ 1 = 1 1 𝑇2∗ 2 − 𝛾( |∆𝐵|2 − |∆𝐵|1 ) 𝛾( |∆𝐵|2 − |∆𝐵|1 )
≈ ≈
≈ ≈
≈ ≈
≈ ≈
≈
≈
≈
≈ ≈
Assessment of myocardial B0 over the cardiac cycle at 7.0 T and its implications for susceptibility-based CMR techniques
Teresa Serradas Duarte1, Till Huelnhagen1 and Thoralf Niendorf1,2
1
Berlin Ultrahigh Field Facility (B.U.F.F.), Max-Delbrueck Center for Molecular Medicine (MDC), Berlin, Germany
2Experimental and Clinical Research Center, a joint cooperation between the Charite Medical Faculty and the
Max-Delbrueck Center, Berlin, Germany
Purpose: Susceptibility-based methods are an emerging technique in cardiovascular magnetic resonance (CMR) for myocardial tissue
characterization [1, 2]. The linear relationship between magnetic field strength and microscopic susceptibility effects [3], renders susceptibility weighted MRI at ultrahigh magnetic fields (B0 ≥ 7.0 T) (UHF) conceptually appealing. These methods are highly dependent on the main field
homo-geneities which makes B0 assessment crucial for interpretation of results [4]. Cardiac and respiratory motion together with blood flow effects
ren-ders the estimation of B0 across the cardiac cycle challenging. Shah et al. [5] reported temporal variation of the main field to benegligible across
the cardiac cycle at 1.5 T, but B0 inhomogeneities are increased at UHF [5]. For this reason, this pioneering study investigates B0 variation in the
myocardium over the cardiac cycle at 7.0 T and its implications for susceptibility-based CMR methods.
Methods: Volunteer experiments were performed using a 7.0 T whole body MR system (Siemens Healthcare, Erlangen, Germany). A 16
channel transceiver array tailored for CMR at 7.0 T was used for signal excitation and reception [7]. 2D CINE FLASH imaging was performed as ana-tomical reference. Volume selective B0 shimming adjusted to the heart (based on a cardiac triggered field map) was applied before the maps
acqui-sition. For CINE B0 mapping a segmented, 2D, cardiac gated, breath-held, double echo GRE technique (TE1 = 3.06 ms, TE2 = 7.14 ms) with spatial
resolution = (2.8x2.8x4.0) mm3 was employed. Mid-ventricular short axis and four chambers views were acquired. An MR stethoscope (MRI.TOOLS GmbH, Berlin, Germany) was applied for cardiac gating. Field maps were calculated offline in MATLAB (The Mathworks, Natick, MA) using a phase difference method [8]. The B0 maps were filtered using a Gaussian low-pass to reduce high frequency noise contributions while maintaining
macro-scopic B0 variations. Intravoxel field gradients for mid-ventricular short axis views were calculated based on in-plane field variations together with
through-plane gradients estimated from the B0 profile in the septum of the four chamber view. Mean intravoxel gradients in the left ventricular
(LV) myocardium were analyzed for all cardiac phases and expected T2* variations were estimated using an analytic approach.
Results: Figure 1A illustrates B0 field and intravoxel gradient maps for five phases distributed along the cardiac cycle. The field maps show
a mean B0 variation of approximately 56 Hz in the LV myocardium across the cardiac phases. Susceptibility contrast is determined by intravoxel
field gradients, hence it is essential to investigate the change of the intravoxel gradients rather than the overall changes in B0. The through-plane
gradients estimated from four chamber views (ranging from -0.97 Hz to 2.70 Hz) included in the gradient maps were small compared to in-plane myocardial gradients (from 7.91 Hz to 12.07 Hz). Intravoxel gradients were comparable for all cardiac segments with exception of the antero- and inferolateral segments which showed slightly higher values (compare figure 1A). The mean intravoxel gradient in the LV myocardium was found to range from 7.99 Hz to 12.12 Hz throughout the cardiac cycle as illustrated in Figure 1B. Over all phases, the mean intravoxel gradient was calculat-ed to be (9.92 ± 1.30) Hz. Assuming a mean myocardial T2* of 15.0 ms, the observed maximum intravoxel B0 gradient difference of 4.13 Hz
trans-lates into a decrease in T2* of 0.9 ms, which is lower than the average myocardial T2* standard deviation reported at 7.0 T [10] and can thus be
con-sidered negligible.
Conclusion: This study investigated B0 variation in the myocardium over the cardiac cycle at 7.0 T and its effects on myocardial T2*
map-ping. Results show that even though B0 is changing over the cardiac cycle, variations of intravoxel B0 gradients in the myocardium (mainly
influenc-ing T2*) can be considered to be minor regarding their effect on T2*. This provides encouragement for temporally resolved susceptibility sensitized
Assessment of Myocardial B
0over the Cardiac Cycle at 7.0T: Implications for
Suscepti-bility-based Cardiac MR Techniques
Teresa Serradas Duarte1, Till Huelnhagen1 and Thoralf Niendorf1,2
1
Berlin Ultrahigh Field Facility (B.U.F.F.), Max Delbrück Center for Molecular Medicine in the Helmholtz Association, Berlin, Germany
2
Experimental and Clinical Research Center, a joint cooperation between the Charité Medical Faculty and the Max Delbrück Center in the Helmholtz Association, Berlin, Germany
Synopsis
Magnetic susceptibility-based methods are an emerging technique in CMR for myocardial tissue characterization. Making use of UHF MRI, temporally resolved myocardial T2* mapping was recently demonstrated. Since susceptibility
weighted MRI is highly dependent on main magnetic field homogeneity, B0 assessment is crucial for interpretation of
re-sults. This pioneering study investigates B0 variation in the heart over the cardiac cycle at 7.0T and its implications for
myo-cardial T2* mapping in a cohort of healthy volunteers. Results show that septal macroscopic field inhomogeneities are minor
regarding their effects on T2*. This provides encouragement for temporally resolved susceptibility-based CMR at UHF.
Purpose
Magnetic susceptibility-based methods are emerging cardiovascular MR (CMR) techniques for myocardial tissue char-acterization [1, 2]. The linear relationship between magnetic field strength and microscopic susceptibility effects [3], renders susceptibility weighted MRI at ultrahigh magnetic fields (B0 ≥≥ 7.0T) (UHF) conceptually appealing to pursue high spatial
reso-lution temporally resolved T2* mapping. Since T2* is highly dependent on main magnetic field (B0) homogeneity [4], meaningful
interpretation of these results requires temporally resolved B0 assessment. Shah et al. [5] reported temporal variation of the
main field to benegligible across the cardiac cycle at 1.5T, but B0 inhomogeneities are increased at UHF [3, 6]. For this reason,
this pioneering study investigates B0 variation in the myocardium over the cardiac cycle at 7.0T and elucidates its implications
for myocardial T2* mapping in healthy volunteers.
Methods
Three healthy volunteers were scanned using a 7.0T whole body MR system (Siemens Healthcare, Erlangen, Germa-ny). A 16 channel transceiver array tailored for CMR at 7.0T was used for signal excitation/reception [7]. Volume selective B0
shimming adjusted to the heart was applied prior to T2* weighted acquisitions. CINE T2* and B0 mapping was carried out in
mid-ventricular short axis (SAX) views employing a segmented, cardiac gated, breath-held, multi-shot multi-echo gradient echo technique (spatial resolution=(1.4x1.4x4.0)mm3, TE=2.04-10.20ms, ΔTE=1.02ms) [1]. CINE four chamber views were ac-quired similarly to measure the through-plane B0 variation (TEs=3.06, 7.14ms, spatial resolution=(2.8x2.8x4.0)mm3). An MR
stethoscope (MRI.TOOLS GmbH, Berlin, Germany) was used for cardiac triggering. Field maps were calculated offline in MATLAB (The Mathworks, Natick, MA) using a phase difference method [8]. The B0 maps were filtered using a Gaussian
low-pass to reduce high frequency noise contributions while maintaining macroscopic B0 variations. Since susceptibility contrast is
determined by intravoxel field gradients rather than by overall changes in B0, it is essential to investigate the change of these
gradients. Intravoxel field gradients for mid-ventricular short axis views were calculated based on in-plane field variations to-gether with through-plane gradients estimated from B0 profiles in the septum of the CINE four chamber views. Septal
seg-ments (8 and 9, [9]) are less prone to susceptibility artifacts than other myocardial segseg-ments [3] and hence commonly as-sessed in clinical routine. Therefore mean septal intravoxel gradients were analyzed for all cardiac phases. Finally, the ex-pected T2* variations caused by macroscopic field gradients were estimated using an analytic approach. The post-processed
data was averaged for all volunteers, while interpolation based on R-R interval duration was used to match cardiac phases of different volunteers.
Results
Figure 1 illustrates B0 field in-plane and through-plane maps of one volunteer for 6 out of 19 phases distributed along
the cardiac cycle. Through-plane B0 gradients (mean=0.4±0.1Hz/mm; mean temporal range (max-min)=0.9±0.2Hz/mm)
esti-mated from septal profiles in four chamber views (Figure 1 bottom) were small compared to in-plane septal gradients (mean=2.3±0.5Hz/mm; mean range=0.6±0.1Hz/mm). Intravoxel gradient maps are shown in Figure 2. Intravoxel gradients were comparable for all cardiac segments with exception of the antero- and inferolateral segments which showed higher val-ues (compare Figure 2 center). End-systolic and end-diastolic intravoxel gradients, T2* and estimated gradient-induced ΔT2*
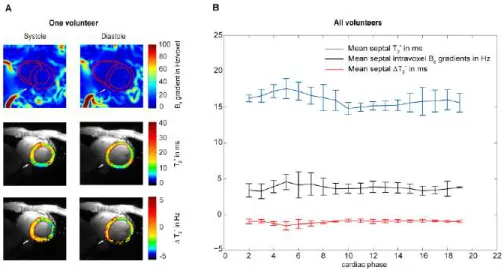
maps of one volunteer are shown in Figure 3A. Figure 3B illustrates the intravoxel gradient evolution across the cardiac cycle averaged over all volunteers and its effect on T2*. The mean range (max-min) of the septal intravoxel B0 gradients was
1.9±0.5Hz throughout the cardiac cycle, while the mean gradient was ranging from 2.8-4.5Hz (black plot). Mean septal T2*
was found to be 16.1±1.0ms (blue plot). The mean macroscopic gradient-induced ΔT2* (red plot) was estimated as -1.0±0.2ms
and was varying in a range (max-min) of 1.0±0.6ms, which is small compared to the mean range of T2* changes found
3.8±1.2ms.
Discussion and Conclusion
This study investigated macroscopic B0 variation in the heart with focus on the intraventricular septum over the
cardi-ac cycle at 7.0T and its effects on T2* mapping. B0 field variation was found to induce a nearly constant but minor offset in
sep-tal T2*. Consequently, macroscopic magnetic field variation across the cardiac cycle can be considered to be negligible for
sep-tal T2* mapping. This result provides encouragement for temporally resolved susceptibility sensitized CMR at UHF.
Additional-ly, the T2* offset in each phase is small compared to their absolute value indicating that septal T2* mapping is reliable even at
UHF. In conclusion, macroscopic B0 inhomogeneities and their temporal changes in the septum were found to be minor and
the feasibility of septal dynamic T2* mapping at 7.0 T was demonstrated.
Figure 1: B0 field maps in the heart over the cardiac cycle. Top: In-plane analysis performed in mid-ventricular short axis views.
Bot-tom: Four chamber views used to measure through-plane variations. White box marks ROI where the SAX view is positioned. Arrow points to profile placement in one representative phase.
Figure 2: Intravoxel gradient maps of one volunteer across the cardiac cycle for a mid-ventricular short axis view in the whole heart
and surroundings (top), left-ventricular myocardium (middle) and septum (bottom). Contrast adapted in the middle and bottom images. Septal B0 gradient variations are minor over the cardiac cycle.
Figure 3: A) End-systole and end-diastole gradient (top), T2* (middle) and macroscopic gradient-induced ΔT2* (bottom) maps. Septal
segments highlighted by arrow. B) Mean septal T2* (blue), gradient (black) and ΔT2* (red) plots over the cardiac cycle, averaged for all
Myocardial B0 over the Cardiac Cycle at 7.0T: Implications for Susceptibility-based Cardiac MR Techniques
Teresa Serradas Duarte1, Till Huelnhagen1 and Thoralf Niendorf1,2
1Berlin Ultrahigh Field Facility (B.U.F.F.), Max Delbrück Center for Molecular Medicine in the Helmholtz Association, Berlin, Germany; 2Experimental and Clinical Research Center, a joint cooperation between the Charité Medical Faculty and the Max Delbrück Center in the Helmholtz Association, Berlin, Germany
Target audience: This work is of interest for basic MR researchers, imaging scientists, clinical scientists, radiologists and cardiologists.
Purpose: Magnetic susceptibility-based methods are emerging cardiovascular MR (CMR) techniques for myocardial tissue characterization [1, 2]. The linear
relation-ship between magnetic field strength and microscopic susceptibility effects [3], renders susceptibility weighted MRI at ultrahigh magnetic fields (B0 ≥ 7.0T) (UHF)
conceptually appealing to pursue high spatial resolution temporally resolved T2* mapping [1] . Since T2* is highly dependent on main magnetic field (B0) homogeneity
[4], meaningful interpretation of these results requires temporally resolved B0 assessment. Shah et al. [5] reported temporal variation of the main field to be
negligi-ble across the cardiac cycle at 1.5T, but B0 inhomogeneities are increased at UHF [3, 6]. For this reason, this study investigates B0 variation in the myocardium over the
cardiac cycle at 7.0T and elucidates its implications for myocardial T2* mapping in a healthy volunteers cohort.
Methods: Three healthy volunteers were scanned using a 7.0T whole body MR system (Siemens Healthcare, Erlangen, Germany). A 16 channel transceiver array
tai-lored for CMR at 7.0T was used for signal excitation/reception [7]. Volume selective B0 shimming adjusted to the heart was applied prior to T2* weighted acquisitions.
CINE T2* and B0 mapping was carried out in mid-ventricular short axis (SAX) views employing a segmented, cardiac gated, breath-held, multi-shot multi-echo gradient
echo technique [1] (spatial resolution=(1.4x1.4x4.0)mm3, TE=2.04-10.20ms, ΔTE=1.02ms) [1]. CINE four chamber views were acquired similarly to measure the
through-plane B0 variation (TEs=3.06, 7.14ms, spatial resolution=(2.8x2.8x4.0)mm3). An MR stethoscope (MRI.TOOLS GmbH, Berlin, Germany) was used for cardiac
triggering. Field maps were calculated offline in MATLAB (The Mathworks, Natick, MA) using a phase difference method [8]. The B0 maps were filtered using a
Gaussi-an low-pass to reduce high frequency noise contributions while maintaining macroscopic B0 variations. Since susceptibility contrast is determined by intravoxel field
gradients rather than by overall changes in B0, it is essential to investigate the change of these gradients. Intravoxel field gradients for mid-ventricular short axis views
were calculated based on in-plane field variations together with through-plane gradients estimated from B0 profiles in the septum of the CINE four chamber views.
Septal segments (8 and 9, [9] ) are less prone to susceptibility artifacts than other myocardial segments [3] and hence commonly assessed in clinical routine. There-fore mean septal intravoxel gradients were analyzed for all cardiac phases. Finally, the expected T2* variations caused by macroscopic field gradients were estimated
using an analytic approach. The post-processed data was averaged for all volunteers, while interpolation based on R-R interval duration was used to match cardiac phases of different volunteers.
Results: Through-plane B0 gradients (mean=0.4±0.1Hz/mm; mean temporal range (max-min)=0.9±0.2Hz/mm) estimated from septal profiles in four chamber views
were small compared to in-plane septal gradients (mean=2.3±0.5Hz/mm; mean range=0.6±0.1Hz/mm). Intravoxel gradient maps are shown in Figure 1A. Intravoxel gradients were comparable for all cardiac segments with exception of the antero- and inferolateral segments which showed higher values (compare Figure 1A cen-ter). Figure 1B illustrates the intravoxel gradient evolution across the cardiac cycle averaged over all volunteers and its effect on T2*. The mean range (max-min) of the
septal intravoxel B0 gradients was 1.9±0.5Hz throughout the cardiac cycle, while the mean gradient was ranging from 2.8-4.5Hz (black plot). Mean septal T2* was
found to be 16.1±1.0ms (blue plot). The mean macroscopic gradient-induced ΔT2* (red plot) was estimated as -1.0±0.2ms and was varying in a range (max-min) of
1.0±0.6ms, which is small compared to the mean range of T2* changes found 3.8±1.2ms.
Discussion and Conclusion: This study investigated macroscopic B0 variation in the heart with focus on the intraventricular septum over the cardiac cycle at 7.0T and
its effects on T2* mapping. B0 field variation was found to induce a nearly constant but minor offset in septal T2*. Consequently, macroscopic magnetic field variation
across the cardiac cycle can be considered to be negligible for septal T2* mapping. This result provides encouragement for temporally resolved susceptibility sensitized
CMR at UHF. Additionally, the T2* offset in each phase is small compared to their absolute value indicating that septal T2* mapping is reliable even at UHF. In
conclu-sion, macroscopic B0 inhomogeneities and their temporal changes in the septum were found to be minor and the feasibility of septal dynamic T2* mapping at 7.0 T
was demonstrated.
Figure 1: (A) Intravoxel gradient maps of one volunteer across the cardiac cycle for a mid-ventricular short axis view in the whole heart and surroundings
(top), left-ventricular myocardium (middle) and septum (bottom). Contrast adapted in the middle and bottom images. (B) Mean septal T2* (blue), gradient (black) and