1
ON THE BEHAVIOUR OF STRUCTURAL STEEL BEAMS
UNDER NATURAL COMPARTMENT FIRE
KADA ABDELHAK1, LAMRI BELKACEM1, BENLAKEHAL NOUREDDINE1, BOUCHAIR ABDELHAMID2, MESQUITA LUIS M.R.3
1STRUCTURES, GEOTECHNICS AND RISKS LABORATORY, HASSIBA BENBOUALI UNIVERSITY OF
CHLEF, FACULTY OF CIVIL ENGINEERING AND ARCHITECTURE, DEPARTMENT OF CIVIL ENGINEERING, BP 151, ROUTE DE SENDJAS, CHLEF 02000, ALGERIA. E-MAIL:
2ACLERMONT UNIVERSITÉ, UNIVERSITÉ BLAISE PASCAL, INSTITUT PASCAL, BP 10448, 63000
CLERMONT FERRAND, FRANCE
2BCNRS, UMR 6602, INSTITUT PASCAL, 63171 AUBIÈRE, FRANCE
3APPLIED MECHANICS DEPARTMENT, POLYTECHNIC INSTITUTE OF BRAGANÇA, AP. 1134, 5301-857
BRAGANÇA, PORTUGAL
Thème N°10 : Risque d’incendie
Abstract
Fire is an extreme action, to which a steel structure may be submitted, and therefore, must be designed to resist.
Traditionally, the fire resistance of structural steel beams has been determined in standard fire tests, with the temperature-time curve ISO834 representing more severe heating conditions compared to that which occurs in many typical natural fire compartments. Therefore to design a steel structure safely and economically, it is necessary to calculate temperature distribution in steel beams under natural fire.
In this paper, the temperature profiles in a steel beams under natural fire are studied first, using spread-sheets written by authors and compared to standard fire. Secondly, two Cardington compartment corner office tests are highlighted, and analysis of primary and secondary steel beams is presented. Simple theoretical natural fire models based on Eurocode EN 1991-1-2 parametric compartment fire are used and a comparison is made using the experimental results from tests conducted at Cardington research centre, UK. Compartment temperatures and cross-section temperature distribution respectively demonstrates that analytical fire models and experimental results are in good agreement in the case of timber cribs fire load.
Keywords: Natural fire, steel beam, temperature distribution, numerical, Cardington fire tests
1. INTRODUCTION
Steel construction is becoming widely used in buildings nowadays, for it can reduce substantially the construction time and therefore the global cost.
During the last decades, remarkable progress has been made in understanding the parameters which influence the development of building fires [1], and also the behaviour of fire exposed structural materials and structures [2, 3]. In particular, for steel structures, this progress has resulted in the production of very detailed rules for the design and calculation of structural behaviour and load bearing capacity in fire [4-6].
However, the poor behaviour of structural materials under the conditions of exposure to fire must not be forgotten. It is well known that steel among all materials, suffers a great reduction of yield stress and Young’s modulus, under the effect of high temperatures[6-8].
behaviour as energy is dissipated at these points [1, 3].
Extensive research has been carried out in recent years on the numerical simulation using finite element method (FEM) [8, 13] as an alternative to the original plastic hinge analysis method.
Moment redistribution is one of the significant phenomena occurring in heated steel beams and a good understanding of this behaviour under fire conditions is dealt with by investigations on the performance of redundant structures [14].
There is limited research work conducted on natural fire conditions [15-17]. It is therefore useful to study steel beams under such conditions. Temperature distributions in steel beams, needed to be determined prior to analysing the structural behaviour, are studied on the basis of the Eurocode parametric fires [4] using worksheet programs written by authors.
In this paper the authors used the available real fire Cardington compartment tests data with two main types of fire loads deployed for wood cribs and a variety of office materials (computers, desks, plastic files, paper piles…) for test 3 and 6 respectively. Comparisons are made with respect to ISO 834 curve and the two BRE-Cardington real fire tests [18-20].
2. FIRE CURVES
The ISO 834 standard fire curve (Fig.1) is used for the fire resistance design in many countries, in which the temperature increases monotonically with time. In EN 1991-1-2 [4], the gas temperature θ in oC, at time t in minutes, is given by expression (1).
𝜃𝑔= 20 + 345 𝑙𝑜𝑔10(8 𝑡 + 1) (1)
Where θg -is the gas temperature in the fire compartment [°C]; t − is the time [min].
In modern fire safety engineering however, the design of structures is moving from the traditional prescriptive method to the performance-based methodology [14]
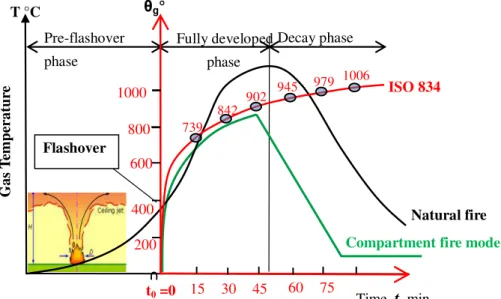
Unlike the standard fire curve, a natural fire curve is characterized by 3 phases: a pre-flashover phase, a fully developed phase and a decay phase (Fig.1). Most structural damage occurs during the fully developed fire phase and only the fully developed fire phase and the decaying phase are taken into account. The reference time t0, figure 1, is regarded as the origin of the temperature-time coordinate system, corresponding to the point of flashover.
Flashover
ISO 834
Natural fire Fully developed
phase
Compartment fire model Decay phase
Pre-flashover phase
Figure 1. Fire Temperature-time curves – 3 phases real fire vs ISO 834 and natural compartment fire model.
T °C
Gas
T
em
p
er
at
u
re 1000
800
600
400
200
739 842
902 945
979 1006
t0 =0
0
15 30 45 60 75
3
It is clear that the ISO 834 fire curve generally is more conservative than a natural fire curve because the standard curve implies that there is an inexhaustible supply of fuel. If a natural fire is used in a steel structure fire resistant design, it is possible to reduce fire protection [15].
3. NATURAL COMPARTMENT FIRE MODELLING
The compartment temperature during natural fire depends on the amount, distribution, and composition of the combustible materials in the compartment, the enclosure dimensions and ventilation, as well as the thermal properties of the compartment linings [15]. Thus, the natural fire modelling required, takes account of actual fire load, ventilation conditions and thermal characteristics of compartment walls.
3.1 Eurocode compartment fire models
The Eurocode parametric temperature-time curves [1, 4] are based upon three parameters, the design fire load density qtd, the opening factor O that accounts for the openings in the vertical walls and the parameter which accounts for thermal properties of the enclosure b.
𝜃𝑔= 𝑓(𝑞𝑡,𝑑 , 𝑂, 𝑏) ;
With
𝑞𝑡,𝑑= 𝑞𝑓,𝑑. 𝐴𝑓⁄ [𝐴𝑡 𝑚𝑀𝐽2] ; 𝑂 = √𝑒𝑞. 𝐴𝑣⁄ [ 𝑚𝐴𝑡
1
2] {≥ 0.02
≤ 0.2 ; 𝑏 = √𝑐. 𝜌. 𝜆 [𝑚2:𝑆𝐽1 2⁄𝐾 ] {
≥ 100
≤ 2200 (2)
Time temperature in the heating phase :
The evolution temperature during the heating phase is given by:
𝜃𝑔=20 + 1325(1 − 0.324𝑒−0.2𝑡∗− 0.204𝑒−1.7𝑡∗− 0.472𝑒−19𝑡∗ (3) Where t* is the fictitious time given t*=t Γ, t the time in hours and
Γ = (𝑏 1160𝑂 0.04⁄⁄ )2 (4)
In the case of Γ=1, Equation (3) approximates the ISO834 standard temperature-time curve [16].
Depending on whether the fire is fuel controlled or ventilation controlled, the duration of the heating phase tmax is given, in hours, by
𝑡𝑚𝑎𝑥=max {0.0002 × 𝑞𝑡,𝑑⁄ ; 𝑡𝑂 𝑙𝑖𝑚} (5)
The introduction of tlim is to avoid an unrealistic short fire duration when the ratio between the fire load and the
opening factor decreases. Any object or fire load needs a certain amount of time to burn, even if there is an unlimited presence of air [16]
Time temperature in the cooling phase :
The time-temperature curve during the cooling phase is given by
θg= θmax− 625(t∗− tmax∗ . x) for tmax∗ ≤ 0.5
θg= θmax− 250(3 − tmax∗ )(t∗− tmax∗ . x) for 0.5 < tmax∗ < 2 (6)
θg= θmax− 250(t∗− tmax∗ . x) for tmax∗ ≥ 2
In which t∗= t . Γ and tmax= (0,2. 10−3. qt,d⁄ ). ΓO
𝑥 = 1 𝑖𝑓 𝑡𝑚𝑎𝑥≥ 𝑡𝑙𝑖𝑚 , Ventilation Controlled
𝑜𝑟 𝑥 = 𝑡𝑙𝑖𝑚. Γ 𝑡⁄ 𝑚𝑎𝑥∗ 𝑖𝑓 𝑡𝑚𝑎𝑥< 𝑡𝑙𝑖𝑚 , Fuel Controlled
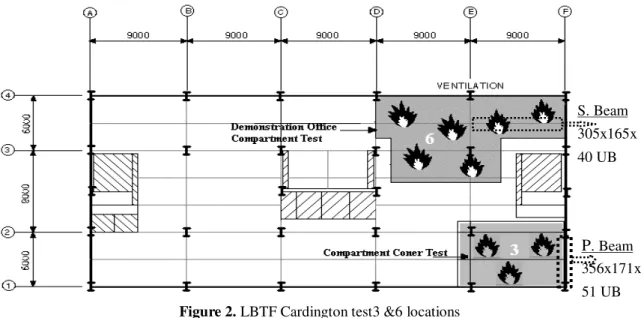
S. Beam 305x165x 40 UB
Figure 2. LBTF Cardington test3 &6 locations
P. Beam 356x171x 51 UB 3.2 Input data for BRE-Cardington compartment fire tests
BRE-Cardington full-scale fire tests
To generate data on the overall steel structures, the BRE has recently completed at Cardington a series of full scale fire tests in its Large Building Test Facility (LBTF), on eight storey steel-framed building [18]. The so called BRE’s-Cardington building is an eight storeys (33m) steel framed construction with five bays (5x9m=45m) by three bays (6+9+6=21m) in plan figure 2 [19].
Test3, 6, figure 2, involved compartment compartments of different sizes subjected to natural fire fuelled by timber cribs and modern office furniture respectively.
Fire simulation - design value of the fire load
It is calculated based on the characteristic value qf,k as defined annex A EN 1991-1-2 [4]
qf,d= qf,k. m. δq1δq2. δn (7)
With: m combustion factor, the value of which is between 0 and 1 (0.8 for cellulosic materials); δq1 factor that accounts for the risk of fire activation due to the compartment size; δq2 factor that accounts for the risk of fire activation due to the of occupancy; δn factor that takes into account the effect of active fire fighting.
For either case, the fire load is composed by 20% of plastic, 11% of paper and 69% of timber that is only cellulosic materials and hence m = 0.8.
δq1= 1.5 (Af ≤250); δq2= 1.0 (office);
δn=∏ δ10i=1 ni= 1.0 × 0.73 × 0.87 × 0.78 × 1.0 × 1.0 × 1.0= 0.5
(8)
A total fire load equivalent to 46 Kg /m2 of timber cribs has been considered with a characteristic value qf,k of 805MJ/m2 , which gives a design value of the fire load :
qf,d= 805 × 0.8 × 1.5 × 1.0 × 0.5 = 483 MJ/m2 (9)
Compartment Fire tests input data
5
Table 1: Data forTest3 & Test6 compartment fires
4. TEMPERATURE TIME CURVES OF BRE-CARDINGTON FIRE TESTS 3 AND 6
Fire curves were produced for two BRE-Cardington tests (3 & 6) showing significant dependence of fire temperature on thermal properties of the enclosure materials.
4.1 Gas temperature profiles in compartment fire test3 & test6
Parametric fire recommended in EN 1991-1-2 [4], is used to simulate both compartment tests 3 and 6 and equations in the heating and cooling phases Eqt.(10), Eqt.(11) are derived .
Temperature evolution in the heating phase:
𝜃𝑔(𝑇𝐸𝑆𝑇3)=20 + 1325(1 − 0.324𝑒−0.2(0.506.𝑡)− 0.204𝑒−1.7(0.506.𝑡)− 0.472𝑒−19(0.506.𝑡)
𝜃𝑔(𝑇𝐸𝑆𝑇6)=20 + 1325(1 − 0.324𝑒−0.2(3.04.𝑡)− 0.204𝑒−1.7(3.04.𝑡)− 0.472𝑒−19(3.04.𝑡) (10)
Temperature evolution in the cooling phase:
𝜃𝑔(𝑇𝐸𝑆𝑇3)= 813 − 625(0.506 𝑡 − 0.405)
𝜃𝑔(𝑇𝐸𝑆𝑇6)= 959 − 475(3.04 𝑡 − 1.1) (11)
Buchanan [1] has, however pointed out that Eurocode equation gives extremely fast decay rates for large openings in well insulated compartments and extremely slow decay rates for small openings in poorly insulated compartments.
4.2 Parametric fire curves and steel beams temperature profiles
Plots of fire curves for compartment tests 3 and 6 together with ISO standard fire are shown in figure 3.
It can be seen figure 3, that the time to reach the maximum temperature tmax (48 mins., 22 mins.), for test3 and test6 is greater than the time tlim (20 mins.). Thus both fire compartments are controlled by ventilation.
Compartment data TEST3 TEST6
Total area of the enclosure At 295 m2 474 m2 Floor area Af 76 m2 135 m2
Total area of the vertical openings Av 7 m2 27 m2 Opening factor in the vertical walls O 0.031m1/2 0.076 m1/2 Height H 4.0 m . 4.0 m Average height of the window openings heq 1.8m 1. 8 m Light weight concrete ρ
C λ
1900 kg/m3 840J/kgK 1.0 W/mK
4.3 Natural fire compartment tests
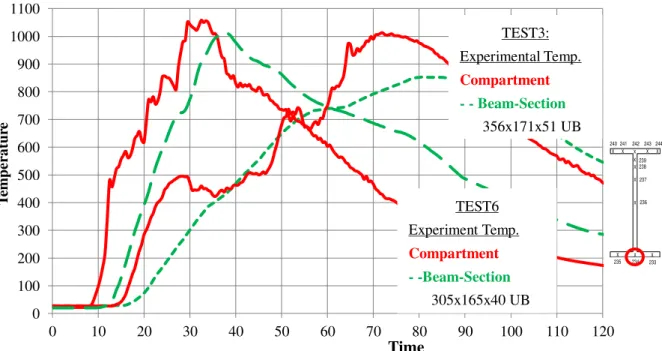
Experimental gas temperature in real and steel beams temperature profiles
Measurements of the temperature in the mid-span beams are shown in figure 4. They are taken in the bottom flanges since they represent the maximum recorded temperatures with regard to web and upper flange.
Experimental mid-span deflections
Figure 5 shows the mid-span vertical displacement recorded in both beams from test3 and test6. It observed that during heating phase, the beam with lower displacement is the testt3 primary beam. It is also worth mentioning that in the cooling phase both beams sustained partial recovery Fig.5.
θcritical= 620°C 0 100 200 300 400 500 600 700 800 900 1000 1100
0 10 20 30 40 50 60 70 80 90 100 110 120
T em p er at u re [ ° C]
time [min]
TEST3:Model Temp. -Compartment
- -Beam Section 356x171x51 UB TEST6:Model Temp.
-Compartment
- -Beam Section
305x165x40 UB
ISO 834
Gas Temperature
Steel Section
Compartment
Figure 3. Parametric fire curve for TEST3 &TEST6- Temperature evolution (Eurocode Models) vs. ISO834
0 100 200 300 400 500 600 700 800 900 1000 1100
0 10 20 30 40 50 60 70 80 90 100 110 120
T em p ér at u re
(°C
)
Time (min) TEST6 Experiment Temp. Compartment - -Beam-Section 305x165x40 UB TEST3: Experimental Temp. Compartment - - Beam-Section356x171x51 UB 235 243 241 240 244 239 238 242 237 236 233 234 x x x x x x x x x x x x x
7
5. MODELLING OF CARDINGTON TESTS 3 & 6 STEEL BEAMS UNDER NATURAL FIRE
The response of structural steel members under fire conditions is governed by mechanical, thermal properties and deformations [8]. Thermal properties define the temperature profile within the steel cross-section whereas the loss in strength and stiffness is governed by mechanical properties which are temperature dependant. Deformation properties define the permissible mid-span beams vertical displacement under fire loading.
5.1 Basic equations and boundary conditions
The temperature distribution in steel beam can be handled as a one-dimensional heat transfer problem without internal heat source(𝑞̇ = 0), valid for non-combustible member. The one-dimensional heat transfer equation can be written as [13]:
λa(θ) (∂
2θ
∂x2) + 𝑞̇ = ρa. Ca(θ). (
∂θ
∂t) (12)
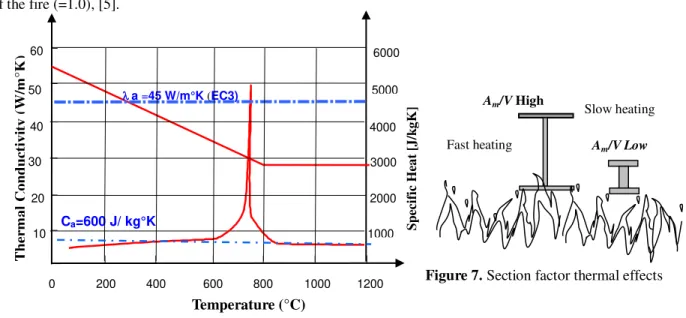
Where ρa=the unit mass of steel (7850 kg/m3); θ= temperature distribution in member; t= time; x = Cartesian coordinate; Ca=specific heat of steel [J/kgK] and λa= thermal conductivity of steel Figure 6.The temperature field which satisfies Eq. (12) must satisfy the following boundary conditions:
Prescribed temperatures on a part of the boundary; the heat flow by convection and radiation at the boundary assuming that θr=θ∞ (surrounding ambient temperature)
𝑞𝑐𝑟= 𝑞𝑐+ 𝑞𝑟= (∝𝑐+∝𝑟)(𝜃 − 𝜃∞) (13)
𝛼𝑟= 𝜎. 𝜀(𝜃2+ 𝜃∞2)(𝜃 + 𝜃∞)
Where q = combined external heat flow per unit area; αc is convection coefficient (=25 or 35W/m2K for ISO834 or for Parametric fire); αr heat flux by radiation between part of the boundary;θ = current temperature;
-Boltzmann constant (= 5.667 x 10⁻⁸ Wm-2K-4) ε=radiative emissivity (=0.7) of the flame associated with fire.
5.2 Simplified method solution for unprotected steelwork
No closed-form solution to the governing non-linear Eq. (12) and its boundary condition non-linear Eq. (13) is possible. For an equivalent uniform temperature distribution in the beam cross-section, the EN 1993-1-2 [5],
Figure 5: Experimental vertical displacement Test3 et Test6 -700
-600 -500 -400 -300 -200 -100 0
0 10 20 30 40 50 60 70 80 90 100 110 120 130 140 150
M
id
-s
p
an
ve
rt
ical
d
is
p
la
ce
m
en
t
(
mm)
Test 3-Primary beam 356x171x51 UB
Test 6-Secondary beam 305x165x40 UB
provides step by step solution of the increase of temperature Δθ a,t in an unprotected steel member during a time
interval Δt defined as:
∆𝜃𝑎,𝑡= 𝑘𝑠𝐶𝑎1𝜌𝑎. (𝐴𝑉𝑚) . ̇𝑛𝑒𝑡,𝑑. ∆𝑡 [°𝐶] (14)
Where: ksh is the correction factor for shadow effect; Am/V is the section factor as defined by Eurocode 3 [5],
representing the ratio of the perimeter of the section exposed to the fire, in meters, and the cross-sectional area of the member, influences the rate of temperature Δθa,t figure 7 .
̇𝑛𝑒𝑡,𝑑 - is the design value of the net heat flux due to convection and radiation per unit area:
̇𝑛𝑒𝑡,𝑑 = ̇𝑛𝑒𝑡,𝑐+ ̇𝑛𝑒𝑡,𝑟
̇𝑛𝑒𝑡,𝑐=∝𝑐(𝜃𝑔− 𝜃𝑚) [𝑊/𝑚2]
̇𝑛𝑒𝑡,𝑟= Φ. 𝜀𝑓. 𝜀𝑚. 5,67x10⁻⁸. [(𝜃𝑟+ 273)4− (𝜃𝑚+ 273)4] [𝑊/𝑚2]
Where: Φ is the view factor (=1.0); θm surface temperature of the beam;; θr is the radiation temperature of the environment of the member usually (θr= θg); εm is the surface emissivity of the surface (=0.7); εf is the emissivity of the fire (=1.0), [5].
Temperature profiles for both primary beam-section in test3 compartment fire and secondary beam-section in test6 are presented in figure 3.
5.3 Beams fire resistance
In this section, steel materials S275 and S355 as a provision for high strength requirement in the actual tests environment and two bare beams, primary with a 6m span and secondary with 9m span, from test3 & 6 respectively, figure 2, are considered.
The steel beams exposed to fire consist of two cross-sections, 356x171x51UB for primary beam and 305x165x40 UB for secondary beam, figure 2 and both are subjected to 3-side heating.
The purpose of the study is to investigate the behaviour of two different type beam models under two different naturel compartment fires.
The uniformly distributed fire design load Pfi,d is calculated with a load factor η=0.6:
P𝑓𝑖,𝑑 = 𝜂𝑙82.𝑊𝑝𝑙,𝑦𝛾 . 𝑓𝑦
𝑀0 (15)
The critical temperature θa,cr of a carbon steel, of the steel grades S275 and S355, at time t for a uniform
temperature distribution in a member is determined for any degree of utilization μ0 at time t=0 [5]:
Slow heating
Am/V High
Am/V Low Fast heating
Figure 7. Section factor thermal effects
Sp
eci
fi
c
He
a
t
[J
/k
g
K]
3000
2000
1000
Ca=600 J/kg°K 10
20 30
40 50 60
0 200 400 600 800 1000 1200
Temperature (°C)
a =45 W/m°K (EC3)
T
h
er
m
al
Cond
u
ct
ivi
ty
(W
/m
°K)
4000 5000 6000
9
𝜃𝑎,𝑐𝑟= 39.19𝑙𝑛 [0.9674𝜇1 0
3.833− 1] + 482 (°𝐶) (16)
With μ0=k1.k2.η ; k1=0.7 and k2=1 adaptation factors, for non-uniform temperature on the section and along the beam respectively.
6. RESULTS AND DISCUSSIONS
The results of parametric compartment fire analysis are used as part of natural fire input in the heat transfer to obtain temperature profiles for beam-sections. Figure 3 compares the parametric temperature curves presented in Eurocode1 [4] for compartment fire models from test3 and test6. The variations of experimental compartment and steel temperatures with time are shown in figure 4. Both theoretical and experimental maximum recorded steel temperatures are shown in table 2.
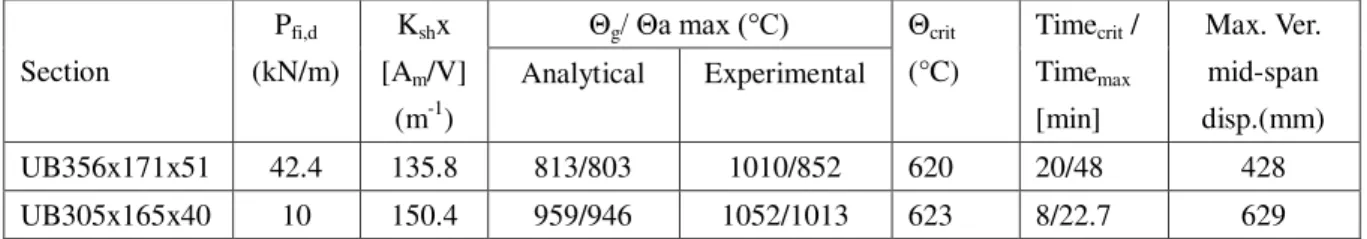
Table 2: Results for temperatures and times for fire resistance
Theoretical calculations based on analytical Eurocode formulations were conducted on spread- sheet format for automatic use in different data cases and results from thermo-mechanical analyses in the form of critical temperatures and times are summarised in Table 2.
Figure 3 shows that ISO834 gas temperature curve (maximum temperature compartment: 1049.0 ºC at 120.00 min) and subsequent beam temperature profiles remains higher above of the test3 temperature curve and this is true for test6 compartment for a time reference over 20 minutes.
On cooling, the test3 primary beam and the test6 secondary beam, recovered to a permanent displacement of 296 mm and 600 mm respectively, figure 5.
7. CONCLUSIONS
The present paper investigates the structural behaviour of steel beams under natural fires for the purpose of a safe and economical design using compartment fire models. Temperature distributions in steel beams are studied using worksheet programs and obvious difference between the temperature distribution under natural fire and that under ISO 834 curve is highlighted. The standard curve, represents only one of many possible fire exposures, generally provides a very conservative prediction of how a steel beam will perform in an actual fire, therefore it is more reasonable to employ natural fires in fire resistant design.
This study shows that the parametric fire models established on the bases of Eurocode 1 for the tests 3 and 6 compartment fires gives a fair description for both the heating and the cooling phase as compared to the experimental temperature profiles. This is more significant for test3, in which wood cribs has been used as fire load, as the analytical parametric fire model agrees closely with the experiment. A simple overlapping of figure 3 and figure 4 with a shift of 10 on the time reference axis gives a clear understanding to the statement above. Finally, large-scale tests provide unique data on how steel frames react to real compartment fires. In particular, the Cardington full test program has shown that the fire resistance of the overall structure can be much greater than that of an individual structural member.
Section
Pfi,d (kN/m)
Kshx [Am/V]
(m-1)
Θg/ Θa max (°C) Θcrit (°C)
Timecrit / Timemax [min]
Max. Ver. mid-span disp.(mm) Analytical Experimental
UB356x171x51 42.4 135.8 813/803 1010/852 620 20/48 428
References:
[1] Buchanan A.H., Structural Design for Fire Safety, John Wiley & Sons (2001)
[2] Bailey C.G., Newman GM., “The design of Steel framed buildings without applied fire protection” The structural Engineer, 1998; 76(5), pp. 77-81.
[3] Usmani, A.S., Rotter, J. M., Lamont, S., Sanad, A. M., Gilie, M. (2001) “Fundamental principles of structural behaviour under thermal effects” Fire Safety Journal (36), 721-744.
[4] EN 1991-1-2 (2002), Basis of Design and Actions on Structures – Part 1-2: Actions on Structures Exposed to Fire. European Community. CEN,Brussels
[5] Eurocode 3, Calcul des Structures en Acier. EN 1993-1-2: Règles générales- Calcul du comportement au feu, 2003.
[6] EN 1993-1-2 (2005). “Eurocode 3 - Design of steel structures - Part 1.2: General rules -Structural fire design”. CEN, Brussels.
[7] Saab HA, Nethercot DA. Modelling of steel frame behaviour under fire conditions. Eng Struct 1991; 13:371–82.
[8] Abdelhak KADA, Belkacem LAMRI, Nourredine BENLAKEHAL, Belkacem ACHOUR, Abdelhamid Bouchaïr, Analyse non-linéaire de poutres métalliques PRS de longues travées sous l’effet de hautes températures dues à l’incendie, Revue Nature & Technologie, A-Sciences fondamentales et Ingénierie, N°8, Janvier 2013, pp. 27-34
[9] Benlakehal N, Kada A., A. Bouchair, B. Lamri, Investigation du comportement non-linéaire des structures industrielles en acier selon plusieurs scénarios de feu, 1er Congrès International – GCDD2011-Tébessa 17-19 octobre 2011
[10] Mesquita L.M.R. , P.A.G. Piloto, M.A.P. Vaz, P.M.M. Vila Real, Experimental and numerical research on the critical temperature of laterally unrestrained steel I beams, Journal of constructional Steel Research 61 (2005) 1435–1446
[11] Yin YZ, Wang YC. A numerical study of large deflection behaviour of restrained steel beams at elevated temperatures. J Construct Steel Res 2004;60(7):1029–47.
[12] Li Guoqianga,b, Wang Peijuna,_, Jiang Shouchaoa, Non-linear finite element analysis of axially restrained steel beams at elevated temperatures in a fire, Journal of Constructional Steel Research 63 (2007) 1175– 1183
[13] Fonseca Elza M. M, Vila Real Paulo M. M, Finite Element Modelling of Thermo-Elastoplastic behaviour of hot-rolled steel profiles submitted to fire, métodos numéricos en ingeniería, SEMNI, pp 1-15, España (1999)
[14] Tom Lennon, David Moore, The natural fire safety concept-:full-scale tests at Cardington, Fire Safety Journal 38 (2003) 623-643
[15] Zhongcheng Ma, Pentti Makelainen, Parametric temperature-time curves of medium compartment fires for structural design, Fire Safety Journal 34 (2000) 361-375
[16] Richard Liew J.Y.,Ma K.Y., Advanced analysis of 3D steel framework exposed to compartment fire. Fire Mater. 2004; 28: 253-267
[17] Wald, F, Simões da Silva, L., Moore, D., Lennon, T., “Experimental behaviour of a steel structure under natural fire”, Fire Safety Journal 41(7), pp. 509-522 (2006).
[18] Wang Y.C., Kodur V.K.R., Research Toward Use of Unprotected Steel Structures, Journal of Structural Engineering.Dec.2000 1442-1450
[19] Kirby B. R, The behaviour of a multi-storey steel framed building subjected to fire attack, Experimental data, Cardington Fire Test (1998) -British Steel Report.