Carlos Pestana Barros & Nicolas Peypoch
A Comparative Analysis of Productivity Change in Italian and Portuguese Airports
WP 006/2007/DE _________________________________________________________
João Bernardino and Tanya Araújo
On Positional Consumption and Technological Innovation
– an Agent-based Approach
WP 04/2010/DE/UECE _________________________________________________________
Department of Economics
W
ORKINGP
APERSISSN Nº0874-4548
School of Economics and Management
On positional consumption and technological
innovation - an agent-based approach
Jo˜ao Bernardino
∗and Tanya Ara´
ujo
ISEG (School of Economics and Management)
Technical University of Lisbon (TULisbon)
Rua do Quelhas, 6 1200-781 Lisboa Portugal
Research Unit on Complexity in Economics (UECE)
†December 15, 2009
Abstract
Positional behavior is a source of externalities and sets limits to wellbeing. Remedies against this market failure are defended by some authors and rejected by others, while the core of the discussion rests on the benefits and costs of applying economic instruments. One of the issues discussed is the role that the competition for positional goods may have in generating technological innovation.
This paper aims to contribute to the understanding of this process by analyzing an agent-based model. We observe a plausible structure of the dynamics behind the process of generation of technological inno-vation by positional consumption and obtain results on the influence of some key factors on the pace of innovation, particularly those of income inequality, the Hirsch conjecture of relative increase of posi-tional consumption with affluence, and consumer network and social neighborhood sizes.
Keywords: Positional consumption, innovation, agent-based models, Robert Frank
∗corresponding author
1
Introduction
The positional economy refers to all those goods, services, occupations, or
other social relations that are either scarce in an absolute or socially im-posed sense, or subject to crowding or congestion through more extensive use. The concept was introduced by Fred Hirsch (1976) in the book ”So-cial Limits to Growth”. The idea of a positional economy differs from the classicalmaterial economy, in which the utility enjoyed with material goods is independent of other individuals’ choices. In the material economy, the possibilities to increase the utility of members of society can ultimately be considered limitless, as long as the consumption of additional goods pro-vides any marginal utility to individuals. In opposition, utility gathered in the positional economy depends on the scarcity of the items consumed, a scarcity imposed either physically or socially. With positional consumption, one’s utility depends directly on the way other individuals consume the same product. The consumption of status goods is the most eminent case of the po-sitional consumption. The scarcer and most difficult to obtain are the status goods, services or occupations, the more utility they give to the consumer.
Hirsch identifies negative consequences to wellbeing by the positional economy, because the satisfaction of one individual implies the loss of sat-isfaction by other individuals. In the realm of the consumption of status goods, the nature of the purposes of individuals leads them to a competition over positional goods. However, by definition the net utility provided by status consumption is socially limited, because status is a relative concept; any increase in satisfaction of an individual is formed at the expense of a correspondent decrease in the satisfaction of others. This competition thus results in a zero-sum game and status consumption can consequently be re-garded as resource wasteful, since individuals as a whole expend efforts with no aggregate return for the economy.
level, a result upon which he asserts that ”material norms on which judg-ments of well-being are based increase in the same proportion as the actual income of the society”. Several other authors covered this subject before Hirsch, but it never got into the first line of the economics research agenda. After his observations of positional consumption and economic affluence, Hirsch argued that the inefficiencies to wellbeing caused by positional con-sumption increases with economic growth: ”as the level of average consump-tion rises, an increasing porconsump-tion of consumpconsump-tion takes on a social as well as an individual aspect. That is to say, the satisfaction that individuals derive from goods and services depends in increasing measure not only on their own consumption but on consumption by others as well”. This presumably hap-pens because, as the economy grows, and with it consumer incomes, a higher share of spending can increasingly be applied in uses other than the basic material needs such as food and habitation. As a consequence, the relative importance of the positional economy over the material economy increases as affluence grows, thereby imposing ”social limits to growth”.
Hirsch’s conjecture originated one of the debates on the origin, conse-quences and possible remedies of the positional economy. Is indeed the quest for positional goods gaining eminence as the economy grows, thereby increas-ing inefficiency? Are there benefits from the positional economy offsettincreas-ing its damage? Should policymakers regard this issue as a matter of state interven-tion? Hirsch himself assumed a prudent position on policy remedies against it. His prudence was justified by the lack of knowledge of the costs and ben-efits of applying such kind of policies, although he provided enlightenment on the issues.
cascade” that follows.
Critics of Frank generally do not question that positional consumption is a market failure (Frank, 2006). However several do question that it should be a matter of state intervention. Kashdan and Klein (2006) present a set of arguments against taxation on positional consumption, arguing that Frank ”overstates the problem, overlooks various voluntary solutions, overlooks un-intended consequences of using taxation, and neglects the Smithian incum-bency on those proposing coercion” .
One of the arguably unintended consequences of positional taxation is that it will reduce the positive effect of positional consumption in its role as a driver of technological innovation. Cited by Kashdan and Klein, Hayek has stated the importance of high-end consumption to innovation: ”What today may seem extravagance or even waste, because it is enjoyed by the few and even undreamed of by the masses, is payment for the experimentation with a style of living that will eventually be available to many” (Hayek 1960). In this respect Kashdan and Klein add that ”in the dynamics of a growing economy, the wealthy provide a market for goods that must be expensive in order to supply to be viable. The wealthy pay extra to enjoy the benefits of new goods, which, if suitable to human existence, will later become inexpensive and widely adopted”. To internalize the costs of the competition for positional goods would therefore cease the positive externalities of this mechanism to innovation.
In reply to Kashdan and Klein, Frank (2006) countered this argument by stating that the alternative capital allocation caused by positional taxation would also drive technological innovation. In the short run, Frank argues, ”the tax would not change the total level of spending. Rather, it would shift the composition of spending in favor of investment”, which would drive capital goods innovation. Frank additionally argues that the higher rates of investment would, in the long run, cause consumption level to increase in relation to the low-savings trajectory through income growth.
Several and complex matters interfere with the way positional consump-tion may or may not generate socially desirable technological innovaconsump-tion, and how far. An objective evaluation of the extent to which positional consump-tion generates a process of technological innovaconsump-tion seems unattainable on practical grounds. However, at a theoretical level we could at least envisage a better understanding of the issues at stake.
of the process of generation of technological innovation through positional consumption. In that view, we build an agent-based model which stands for the generation of technological innovation by the competition for positional goods. The results of its simulation allow to observe in detail the dynamics of this process. Besides it, we observe the influence of some relevant factors on the pace of innovation. These factors are, namely, the level of income in-equality of the consumer society, the materialization of the Hirsch conjecture and the size and structure of the network of positional consumers.
2
Is positional consumption an effective way
of generating technological innovation?
Frank’s (2006) point on the role of alternative capital allocations to positional consumption towards technological innovation shows that, even accepting that positional competition has a positive effect over innovation, there are
noa priorireasons to believe that positional taxation reduces innovation
be-cause the increase in investment capital allocation generated also has positive effects over innovation in the short run and even more so in the long run.
Whether the outcome of positive effects over innovation is better in the short run in a laissez faire or a taxed positional economy, depends simply on either it is the first or the second case that directly generates the highest innovation. In the long run the answer is less straightforward, depending also on the dynamical effects of innovation and investment. If, in the short run, innovation is higher in the positional taxation scenario, it is clear that it will also be higher in the long run. However, if the laissez faire scenario produces higher short run innovation, both outcomes would still be possible in the long run depending on whether the additional short run innovation of the laissez faire scenario would generate enough income growth to offset the income growth driven by additional investment in the positional taxation scenario.
regard aim to assess wether or not its process generates technological inno-vation and, if so, in what extent.
The answer certainly depends largely on what the particular object of positional competition is, and on which attribute of the good is valued for status. For example if the positional good in question is the automobile, and its positional attribute is solely its brand name, then the associated positional behavior will not generate technological innovation. It will instead plausibly cause prices to be maintained at a high level to promote the top status of the brand thanks to the limited number of consumers who can afford such a car. On the contrary, if the positional attribute of the car is its driving performance, or its comfort, then positional competition should be a source of technological innovation directed at that positional attribute.
Another issue is that of the benefits of the type of innovation in question to society. Even if positional consumption does produce technological inno-vation, such innovation can only be regarded as positive for wellbeing in the extent to which it is able to address material needs, in addition to positional needs, for only the satisfaction of the former need is susceptible to increase wellbeing. For example, if we assume that the odor of a perfume solely sat-isfies positional needs, then technological innovation directed at improving the smell of perfumes can not increase wellbeing because the additional sat-isfaction of one’s needs (of smelling good, in relation to others) motivated by innovations in the chemistry of the substance is done at the expense of the satisfaction of the remaining.
In view of these matters, the question of whether positional consumption is an effective process of generating technological innovation should be broken down into three questions:
- Does positional consumption contribute to the generation of any tech-nological innovation?
- If so, in what measure?
- And finally, is the generated technological innovation welfare enhancing (i.e. does it address material needs)?
technological innovation generated. The condition of the first question above as taken as true - i.e. the type of good considered is one over which there is a positional competition directed at an attribute susceptible of technological innovation - whereas the issue of effects on welfare is not covered here.
To analyze the level of technological innovation generated, the model includes several factors which affect the pace of innovation. The factors analyzed are income inequality, the occurrence of the Hirsch conjecture and the size and nature of the network of positional consumers.
3
A Model of Positional Consumption and
Technological Innovation
process is characterized by the existence of interacting agents, by the contin-gency of their decisions on past decisions and by the existence of feedback loops, all elements that make a mathematical approach difficult to realize.
Our agent-based model intends to represent the process of interaction between positional consumption of status goods and the possible generation of technological innovation through the creation of more advanced goods. For such it is designed to contain the most elementary features of both positional consumption and the development of innovative goods as a function of the consumers’ willingness to pay. The focus is therefore mainly on representing
(i) a consumer valuation of goods based on status grounds (utility depends on other consumers’ choices), (ii) the behavior of firms over technological innovation contingent on expected revenues, and also (iii) the consideration of a progressive price decrease of existing goods due to increasing competition between firms and production process efficiency. The designed model aimed to contain these features in a simple form. A detailed description follows.
The model is characterized by the following agents:
- Cconsumers, characterized by different levels of income;
- The industry, which is a single agent representing the aggregate behavior of firms in the economy;
The fundamental structural assumptions of the model are described below:
- There is one type of good, with a technological attribute that provides consumers with status;
- Consumers aim to maximize individual utility; utility is obtained through status;
- There is a G number of versions of that type of good1, each being characterized by having different levels of technological development;
- The utility provided by a good to a consumer depends on the technolog-ical level of the good and on the choices of the other consumers; the higher is the technological hierarchy and the least consumers have that version or superior versions of the good, the higher is the positional utility conferred by the good;
1
- The utility obtained in each simulation period is valid for that period only; consumers buy a good in each simulation period to obtain utility for that period;
- The budget of the consumer for buying a good in each period is deter-mined by his income;
- Consumers’ choices depend on the expected utilities provided by the goods, their prices and the available incomes of consumers; consumers have different willingness to pay for utility depending on their incomes.
- The industry can create a technologically more advanced good; to do that it must incur in research & development (R&D) for its development; a technologically more advanced version is created if the expected demand for the new version is able to exceed the R&D costs necessary for its development; - When a new good is created, the industry sets its price at the level that maximizes revenues from sales, taking into account the number of consumers that would buy the good at each possible price;
- The price of the existent versions of the good decrease with time due to increasing competition of supply and production process efficiency.
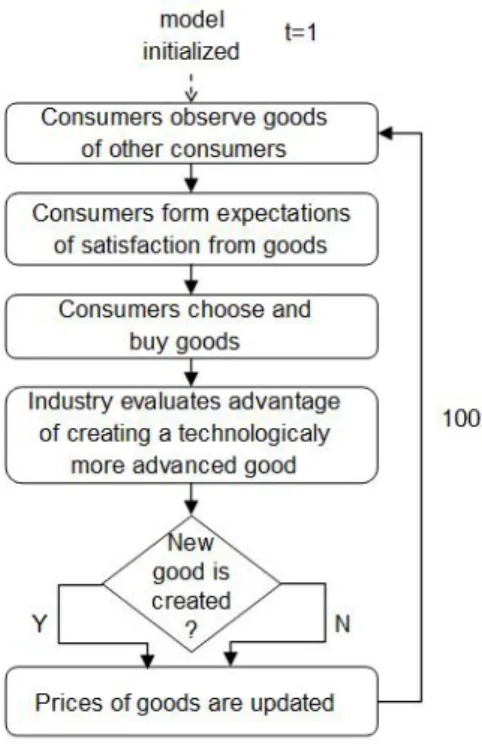
Figure 1 describes the sequence of steps of the model run. It consists of a cyclical sequence in which consumers observe the choices of other consumers, form expectations of the utility derived from each possible version of the good and decide which good to buy. Then the industry evaluates the possible advantage of developing a technologically more advanced good and decides whether or not to create the good. Finally, the prices of goods are updated and the following period starts.
The formal specification of the model setup is described in the following sections.
Consumer Network
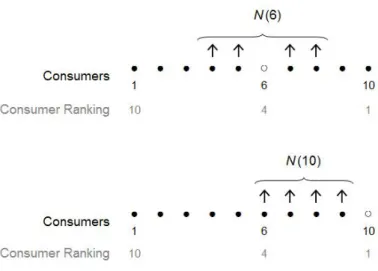
A consumer is influenced by a set of consumers, in his preferences over positional goods. The model is built on a network in which each consumer is influenced by a group of other consumers, in line with Frank and Levine’s (2007) description of the interactions affecting consumer preferences over positional goods.
Figure 1: Model structure
in the income ranking 2, being N
s the size of the neighborhood. The formal definition of neighborhood is as follows:
N(i) :=
Np(i) if Ns
2 < i≤C− Ns
2 Np(1 + Ns
2 ) if |i−1|< Ns
2 Np(C− Ns
2 ) if |C−i|< Ns
2
(1)
where Np(i) is the pseudo-neighborhood of iand is given by:
Np(i) :={j ∈I : |i−j| ≤ Ns
2 } (2)
2
For the purposes of this paper, a Ranking characterizes the hierarchical order of sub-jects before a given attribute. The ranking is a sequence of integers between one (1) and the number of subjects characterized by the ranking (C). Rankings are attributed by
Figure 2: Examples of neighborhood in a network of 10 consumers with a neighborhood size of 4
where I is the set of consumers.
As stated in equation 1, the neighborhood of each consumer depends on his relative position on the income ranking. All consumers have the same number of neighbors, therefore low-end and high-end consumers have an asymmetric neighborhood with more neighbors on one side of the income ranking than the other side, due to finiteness of the set of consumers. This definition implies that connections are unidirectional, i.e. where a consumer is influenced by the choices of another consumer the opposite may not nec-essarily happen. Figure 2 illustrates examples of consumer neighborhoods.
Consumer Incomes
Consumers have different levels of income, which increase with the index
i representing individuals. Consumer incomes (W) follow a Weibull distri-bution curve, with a cumulative form given by:
F(W(i),W , k¯ ) = 1−exp(−(WW(i))k) (3)
The Weibull curve allows to represent various configurations for the distri-butions of incomes, ranging from unequal to even distridistri-butions. The degree of (in)equality of the distribution depends on the constant k. The following Figure represents three possible curve profiles, depending on k:
Figure 3: Possible profiles for income distributions characterized by a Weibull distribution
Consumers are willing to spend up to a fractionqpof their income in posi-tional funcposi-tionalities. Fractionqpwould be actually spent by the consumer in the positional functionality if the good purchasable with that amount would allow him to reach the maximum possible utility derived from the positional functionality. This assumption is described in further detail below.
Prices of Goods
Each good g has a price P(g). The prices of goods decrease with time due to increasing competition of supply and production process efficiency. Prices of goods evolve according to a negative exponential given by:
P(k) = Pcomp+ (Plaunch(g)−Pcomp).exp(− t−t0(g)
kp ) (4)
is maximized (in the long term) - Plaunch(g) is the price of a good g set by the industry in the period of its launch in the market, t is the present time,
t0(g) is the period of creation of good g and kp is a constant that determines how slow the price decreases3.
Utilities
The positional utility provided by a good depends on: how high that good is positioned in the technological hierarchy, and; on the hierarchies of the goods possessed by the other consumers. The value of the maximum achievable utility is one (1) and occurs if the consumer possesses the higher good in the technological hierarchy and no other consumers possess the same good. The minimum possible utility is zero (0) and occurs if all the remaining consumers possess goods of higher hierarchy than that of the individual. The positional utility for an individual i for buying a goodg is given by:
U(i, g) = Ninf(i,g)+ 1
2∗Neq(i,g)
Ns (5)
whereNinf(i, g) is the number of neighbors in the social influence network (neighborhood) of individual i who buy technologically inferior goods than
g andNeq(i, g) is the number of consumers in the social influence network of the individual i who buys equivalent goods (i.e. goodg itself).
In words, having a superior good than that of another consumer within the influence neighborhood provides twice the positional utility of having the same good as another consumer, while having an inferior good does not give any positional utility.
The utility provided by the good only lasts for the period of its acquisition, expiring at the beginning of the following period. Therefore the consumers have to buy a new good in a period to achieve any utility at that period.
Finally, it is implicitly assumed that material utility does not influence the choices of consumers; either the goods provide no material utility or they all provide the same.
Consumer choices
The consumer’s choice of a good in each period depends on his willingness to pay for utility, which is a function of his income. In each period, the
3k
consumer chooses the good with the better trade-off between price and utility. It is assumed that consumers do not downgrade their previous choices, i.e. they do not consider buying a given good if they have previously bought a more technologically developed one at some point in time.
The model assumes that, for taking a decision, the consumer compares pairs of goods. In each comparison, his preference is determined by the differences of potential utilities provided by the goods being compared and by his willingness to pay for utility. When comparing between goods gm and
gn, the consumer chooses gm if the difference in utilities between gm and gn is higher than the ratio between their difference in prices and the consumer’s maximum budget assignable to the positional functionality. Formally, the choice falls on gm overgn if the following condition is met:
U(gm)−U(gn)≥ P(gm)−P(gn)
W(i)∗qp (6)
The consumer is willing to give a proportion qp of his income in return for Umax=1, therefore his willingness to pay for utility is W(i)∗qp.
An assumption of the model is that consumers base their decisions on expected utilities, which are formed under the supposition that all other consumers maintain the options made in the previous period.
Innovation: creation of new goods
Technological innovation is reflected in this model by the creation of new, technologically more advanced goods. The more goods are created during the simulation time, the more investment in innovation happens.
In each period, a new and technologically more advanced good may be created by the industry. For that to happen, the industry must invest a given amount in R&D (Crd). A new good is developed if the potential revenue (Rpot) derived by its hypothetical sales in the following period is higher than the R&D costs that would be involved in its creation:
Rpot > Crd (7)
The cost of R&D efforts necessary to create the new good is given as a ratiof of the total income of consumers in the economy (Wtotal). Fixing R&D costs in terms of total income allows us to test effects of income distribution.
The potential revenue from a hypothetical new good is calculated on the basis of the price that would maximize the difference between revenues obtained from its sales and those obtained if the good would not be created, considering the number of consumers that would be willing to buy the good at that price:
Rpot =maxi{(Pmax(i, gnew)−P(ghigh))∗(C−i+ 1)}, i∈H (9)
where gnew is the hypothetical new good, ghigh is the present good with the highest ranking,H is the group of consumers which consumed ghigh and
Pmax(i, gnew) is the maximum price that the consumer i would be willing to offer for the newly more advanced good, with:
Pmax(i, gnew) = P(ghigh) + (U(gnew)−U(ghigh))∗W(i)∗qp (10)
4
Results
4.1
Scenarios
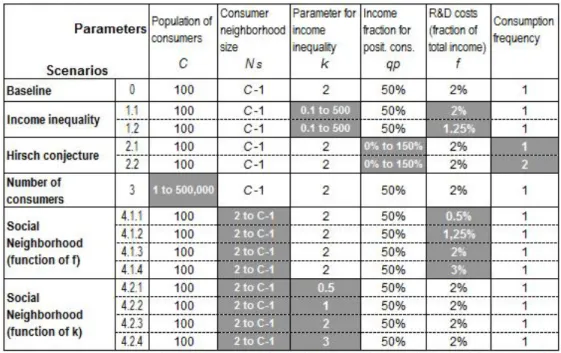
The model was aimed at the comprehension of the process of technological innovation through the competition for positional goods. Its simulation al-lowed us to observe the structure of dynamics behind positionality driven innovation, as well as testing the influence of relevant factors towards the pace of innovation, particularly:
- Income inequality (k); as described above, income inequality has been pointed out by prominent authors as a factor that promotes the market generation of technological innovation, and is consequently pointed as an ar-gument against the application of instruments aimed at recoiling the process of competition for positional goods like the progressive consumption tax.
- Proportion of income allocatable to positional consumption (qp); testing this factor corresponds to testing the effects of the material-ization of the the Hirsch conjecture, of growing positional relative spending with wealth increase.
innovation that may arise from different sizes of the population of consumers and the extension of social influence through social classes.
The set of simulations realized was formed by a baseline simulation, and further sets of simulations aimed at studying the influence of factors outlined here. The term innovation, or pace of innovation, refers here to the total number of new goods created during the simulation time.
Table 1: Model inputs
In the tested set of simulations some quantitative assumptions are applied: R&D costs for the creation of a new product are a fraction of total income (f) of 2%; the competitive market price for each good (Pcomp) is equal to zero (0), therefore prices of goods tend to zero in the long term; at the first period of simulation there are 3 goods with different prices and technological levels, and; the simulation runs for 100 periods of time.
spent in positional consumption, size of the consumer population and size of the consumer social neighborhood respectively. Tha values of R&D costs (f) and consumption frequency are also varied in some subscenarios. Table 1 describes the set of scenarios tested.
4.2
Baseline simulation - modelling positional
compe-tition and technological innovation
In the baseline simulation, the model takes an inequality coefficient (k) of 2 -a v-alue simil-ar to those found in typic-al societies4 - , a maximum fraction of consumer income potentially expendable in the positional functionality (qp) of 0.5 - half the consumers’ income - , a population (C) of 100 consumers with all consumers influencing each other - i.e. with a social neighborhood size (Ns) of 99 - and R&D costs being a fraction of total income (f) of 2%.
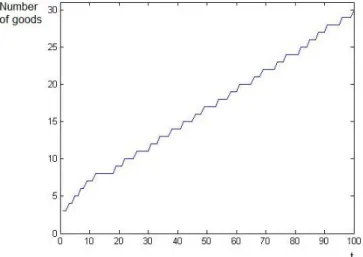
Figure 4: Number of goods over time
The results reveal a cyclical creation of new and technologically more developed goods driven by competition for positional goods. In the first pe-riods of the simulation the consumers make their choices, according to their
4
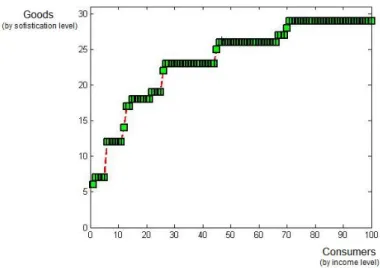
Figure 5: Matching between consumers and goods, at the end of simulation (t= 100)
at the low end of income are consuming the less sophisticated goods. The three initial goods have no longer any buyers. It is noteworthy that in this last period the good with the highest number of consumers is good number 29, which was, when consumers made their decisions, the most sophisticated one available. But as is possible to see in Figure 4, a new good is finally created in this period (good number 30), which happens precisely as a result of the fact that many consumers were already consuming the highest level good, enabling a strong latent demand for a new good.
The main result of this dynamics of ”competition” for positional goods together with a continuous price downtrend is a cyclical creation of more technologically advanced goods.
4.3
Income inequality
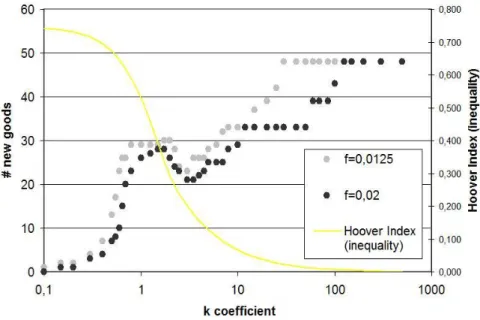
As we have seen above, the degree of inequality depends on the value ofk in the Weibull curve that defines income distribution among the population of consumers. To check for effects of inequality over the level of innovation in the model, simulations were run with different values ofk. The Figure below shows the results obtained. It also shows the Hoover index - a measure of (in)equality - for the spectrum of tested k values. The higher is the Hoover index - and k - the most equitative is the defined income distribution.
The general trend observed is that the dynamics of technological inno-vation improves with equality, although this trend is broken for values of k
sensibly between 2 and 3. This result holds for different values of R&D costs (f), as is seen in Figure 6.
Figure 6: Number of new goods with different income distributions
consumption is, in the large majority of the income distribution setups, a stronger driver of technological innovation than the relative wealth of the richest consumers.
Back to the argument of Kashdan and Klein, inspired by Hayek, that in the dynamics of a growing economy it is the wealthy that enable a market for goods necessarily expensive for its supply to be viable, this result shows that it is possible to have an even more viable market for new goods with a lower price for those goods, as long as there is a larger pool of consumers economically able to compete for the highest positional places (i.e. a less unequal society).
4.4
Hirsch Conjecture
According to Hirsch, ”social limits to growth” are imposed by the fact that the relative importance of the positional economy over the material economy increases with affluence growth. When basic material needs of consumers get satisfied, they tend to increase their share of income to positional means 5.
We analyze consequences, on the dynamics of innovation, of the materi-alization of the Hirsch conjecture. Model simulations with different shares of consumption dedicated to positionality show decreasing returns of innovation to the share of allocatable income to positional spending. This would imply that ”social limits to growth” would apply also to the ”innovation factor” of positional consumption.
Figure 7: Number of new goods as a function of the share of consumer income available to positional spending
However, this result of decreasing returns of innovation to positional con-sumption is subject to the ascon-sumption of the model that consumers exert
5
their positional stakes (by consuming) at a constant rate (one good is bought at each period; its utility is valid for one period). It is plausible to expect positional stakes to be played more frequently as the budget available for po-sitional consumption also increases. On this, the model shows that different frequencies of consumption may return different volumes of innovation; com-paring the initially assumed consumption frequency of 1 with a consumption frequency of 2 (two goods consumed in each period) results show that (Figure 7) that the lower frequency returns more innovation for low levels of relative budget allocatable to positional spending whereas the higher consumption frequency returns more innovation for high levels of positional budget. This suggests that, if the increment of positional spending carries with it an in-crease in consumption frequency, then the result of decreasing returns of innovation to positional spending would not necessarily occur. The nature of the relation between positional spending and innovation therefore depends also on the the relation between positional spending and the frequency of positional consumption. In this respect, we remark nevertheless that the in-crease of frequency of positional consumption must have its own limits, posed by the finite pace at which consumers are able to incorporate information on changes in the ”positional market”. Only when consumers actually realize changes in their positional ranking and available positional goods can they form and deliver their consumption decisions.
4.5
Consumer network
The positional competition for goods occurs within its own societal context. When one individual evaluates his position or that of other individuals in the social ranking, he does so within his perceived social sphere, i.e. within the group of individuals with whom he regards as belonging to his group of influence.
On one hand, one may discuss whether this social arena for positional competition is regarded by individuals as a large group of other individuals, like a region or a country, or on the contrary as a very small circle of close connections in the individual’s particular social context, like family and clos-est acquaintances. In this scope context it is interclos-esting to tclos-est for the level of innovation occurring before different sizes of the social population (still assuming a fully connected influence neighborhood) are tried.
Figure 8: Number of new goods as a function of number of consumers
population size, except for very low sizes of the social network (less than 10 agents) where the number of goods produced can vary no more than 25% of the commontypical innovation output. Therefore, the size of the relevant social network for positionality shows no relevant effects on the speed of innovation, unless very small networks are considered.
On the other hand, we may question the importance of the nature and size of the influence group affecting each consumer’s choices (named above as the consumer neighborhood). We admitted a consumer neighborhood defined by proximity in social class (or level of income); a consumer is influenced - in his evaluation of the utilities given by different goods - by his closest neighbors in the social ranking. This accounts for a world where people compare themselves to friends, work colleagues and residential neighbors, i.e. people who tend to belong to a similar income group.
any other individuals, disregard of their social class. Such was the case in the simulations presented above. On the other hand, a small neighborhood in our model is analogous to a world where individuals compare their positional achievements with other individuals with a very similar social class.
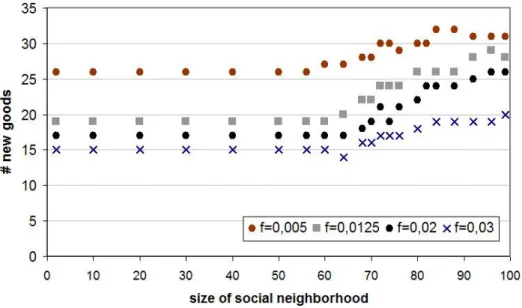
Figure 9: Number of new goods as a function of size of social neighborhood, with different investment costs of R&D
Taking the baseline population of 100 consumers, we simulated different neighborhood sizes to account for its effects on the creation of new goods. In the first set of simulations, different levels of R&D investment costs were tried (f). The baseline value for inequality was taken (k=2).
potential revenue for the industry is affected by the size of the social neigh-borhood only with neighneigh-borhood sizes relatively close to the total number of consumers, case in which the potential income tends to increase.
However, this particular result, which assumes a given inequality profile (k=2), is not generalizable. In fact, testing neighborhood sizes with other inequality profiles produces quite distinct results. As we can see in Figure 10, not only the partial non-dependence between neighborhood size and in-novation does not occur for other income distributions, but also the direction of the observed relation varies largely with income distribution and differen-tially with neighborhood size. A high equality level (k=3) results in a null relation, for the number of new goods produced is invariable. On the other hand, a society with a high inequality (k=0.5) produces results with disparate differential relations between neighborhood size and level of innovation.
Figure 10: Number of new goods as a function of size of social neighborhood, with different income distributions
the real world, which is likely to vary largely from place to place depending on the structure of society.
Figure 11: Summary of results
The table in Figure 11 summarizes the main findings provided by the results of the simulations presented above.
5
Summary and Conclusions
devel-oped a model that represents the process of technological development gen-erated by the competition for consumption of positional goods.
In this model, the positional utility of goods is connected to their tech-nological attributes and consumers periodically play their stakes in the posi-tional game by consuming one type of good. There are different versions of the type of good which differ in their technological level. New, more techno-logical advanced, versions of the good are developed and put into the market by the industry whenever the expected revenues of sales are higher than the costs of R&D for developing the more technologically advanced version. Si-multaneously, prices of new goods decrease with time due to increasing com-petition and productive efficiency. Periodically the consumers evaluate the expected positional utility achieved from each version of the good against their available budgets and correspondingly place their decisions on which one to buy.
This process of competition for positional goods associated with the pos-sibility of creation of new goods and their progressive price decrease generates a cyclical development of technologically more developed goods. The pace of innovation depends on several model parameters, namely the number of consumers, the amount of R&D costs for the creation of new goods, the pace of decrease of prices, income inequality, the relative preferences of consumers for positional goods over other types of spending and the type of influence network of the consumers. We tested for the effects of variations of some of these parameters over the pace of innovation, namely income inequality, the materialization of the Hirsch conjecture and the size of the population of consumers and the size of the social neighborhood of positional influence.
Before different levels of income inequality, the model globally produces a negative relation between income inequality and the number of new goods created, although with oscillations in this rule accross the possible spectrum of income distribution profiles. This result has shown that, contrary to a conventional argument, the market for innovation may happen to be higher in less unequal societies.
fre-quency of consumption is likely to increase with wealth, we note that it must also have its own limits, if not for other reasons at least due to restrictions in the ability of positional consumers to obtain information on the positional market.
Finally, the relation between the social neighborhood size of positional influence and the generation of innovation was seen as a complex one, highly dependent on income distribution. According to the results of the model, the profile of this relation in the real world varies largely from place to place, depending on the structure of society.
References
[1] Araujo, T. and R. Vilela Mendes. 2006. Market-oriented innovation:
When is it profitable? An abstract agent-based study, Working Paper,
UECE.
[2] Araujo, T. and R. Vilela Mendes. 2009. Innovation and
Self-Organization in a Multi-agent Model, Advances in Complex Systems,
v.12, pp 233-253.
[3] Arthur, W. Brian. 1994. Inductive Reasoning and Bounded Rationality (The El Farol Problem), Amer. Econ. Review (Papers and Proceedings), 84, pp 406.
[4] Axelrod, R. and Tesfatsion, L. 2005. A Guide for Newcomers to Agent-based Modeling in the Social Sciences, Appendix in Handbook of Com-putational Economics, vol. 2, pp 1647-1659.
[5] Brekke, K. A., Howarth R. B., Nyborg, K.. 1998.Are there Social
Lim-its to Growth?, Discussion Papers No. 239, November 1998, Statistics
Norway, Research Department.
[6] Brekke, K. A. and Howarth, R. B.. 2000. The Social Contigency of
Wants, Land Economics, November 2000, 76 (4): 493-503.
[7] Dawid, Herbert. 2006. Agent-based Models of Innovation and
Techno-logical Change, Chapter 25 in Handbook of Computational Economics,
[8] Easterlin, R. A. 1994. Will raising the incomes of all increase the
hap-piness of all?, Journal of Economic Behavior and Organization, Vol. 27,
pp 35-47.
[9] Ellis, A. and Heath, A. 1983. Positional Competition or an Offer You
Can’t Refuse, In. A. Ellis & K. Dumat (Eds.), Dilemmas of Liberal
Democracies, pp. 1-22, London: Tavistock.
[10] Frank, R. 1999. Luxury Fever, Princeton University Press, Princeton.
[11] Frank, R. 2003. Are Positional Externalities Different From Other
Ex-ternalities?, Draft for presentation at The Brookings Institution.
[12] Frank, R. 2005. Positional Externalities Cause Large and Preventable
Welfare Losses, American Economic Review, 95(2), pp 137-41.
[13] Frank, R. 2006.Taking Libertarian Concerns Seriously: Reply to
Kash-dan and Klein, Econ Journal Watch, Volume 3, Number 3, pp 435-451.
[14] Frank, R. and Levine, A. S. 2007.Expenditure Cascades, paper presented at the 2007 American Economics Association Conference, Chicago.
[15] Galbraith, J. K. 1958.The Affluent Society, Houghton Mifflin Company, New York.
[16] Hayek, F. A. 1960.The Constitution of Liberty, Chicago: The University of Chicago Press.
[17] Hirsch, F. 1976. Social Limits to Growth, Harvard University Press, Cambridge, Massachussetts.
[18] Howarth, R. B. and Brekke, K. A. 1998. Status Preferences and
Eco-nomic Growth, Discussion Papers No. 240, November 1998, Statistics
Norway, Research Department.
[19] Kashdan, A. and Klein, D.B. 2006;Assume the Positional: Comment on
Robert Frank, Econ Journal Watch, Volume 3, Number 3, pp 412-434.
[20] Mason, R. 2000; Conspicuous Consumption and the Positional
Econ-omy: Policy and Prescription Since 1970, Manage. Decis. Econ. 21:
[21] Veblen, T. 1899.The Theory of the Leisure Class, Viking Compass Edi-tion published 1967.
[22] Vriend, N. J. 2006. ACE Models of Endogenous Interactions, Chapter 21 in Handbook of Computational Economics, vol. 2, pp 1047-1079.