X-DLVO Interactions between Nanocolloidal Magnetic Particles: The Quantitative Interpretation
of the pH-Dependent Phase Diagram of EDL-MF
A. F. C. Campos, E. P. Marinho, M. de A. Ferreira, and F. A. Tourinho Complex Fluids Group, Instituto de Qu´mica, Universidade de Bras´lia,
Caixa Postal 04478, 70919-970, Bras´lia (DF), Brazil
F. L. de O. Paula, J. Depeyrot
Complex Fluids Group, Instituto de F´sica, Universidade de Bras´lia, Caixa Postal 04455, 70919-970, Bras´lia (DF), Brazil
(Received 01/07/2008)
The phase behavior of acidic samples of EDL-MF based on cobalt ferrite nanoparticles with controlled mean sizes was investigated at constant temperature and in absence of magnetic field. By monitoring the nanoparticle charge by pH adjustments, we constructed an experimental pH-dependent phase diagram for all samples that revealed sol, gel thixotropic or coagulated phases in different pH regions. Then, by using an extended DLVO potential we analyzed quantitatively the observed phase diagram in function of pH and nanoparticle mean size.
Keywords: EDL-MF, surface charge density, phase diagrams
I. INTRODUCTION
The colloidal interactions in magnetic dispersions of nano-sized particles has routinely been a matter of outstanding in-terest in complex fluids research. In fact, because of their im-portance in industrial, biomedical and environmental applica-tions, the colloidal stability of these systems must be ensured in order to prevent agglomaration phenomena. In this way, many aspects concerning magnetic colloidal behavior have currently been explored not only by experiments but also in theoretical point of view. This paper looks in a straight line to this subject.
The systems where interparticle interactions can be totally described by only van der Waals forces are rare and limited [1]. On the contrary, in electric double layered magnetic flu-ids (EDL-MF) there is an interplay between short-range at-tractive and long-range repulsive interactions which leads to a complex potential energy function. Nanoparticle interac-tions in EDL-MF may therefore cause colloidal instability in the primary minimum of the potential, kinetical stability in the secondary minimum or thermodynamical stability if a high enough energy barrier is present. It agrees with the experimental observations of fluid, liquid, gas-like and solid phases in these magnetic colloids [2,3,4] For instance, gas-liquid-like and fluid-solid phase transitions may be evidenced varying the ionic strength or pH of the dispersion at constant temperature and in absence of external magnetic field [5,6]. It corresponds to monitor respectively the rate of screening in the electric double layer and the nanoparticle surface charge density. Moreover, by applying an external magnetic field or decreasing the temperature of the colloidal dispersion, such kind of phase transitions can also be observed [7,8,9].
Very recently, we have investigated the surface charge den-sity of EDL-MF based on nanoparticles with controlled mean sizes, by electrochemical measurements [10]. The results have shown that for larger particles the surface is fully ion-ized whereas for smaller ones the saturation value of the
sur-Electronic address:[email protected]
face charge is strongly reduced. This behavior was enlight-ened considering finite size and surface effects which lead to marked changes of the coordination of surface ions. Thus, as the electrostatic repulsive component of the interparticle potential energy is strongly dependent on particle surface charge, the nanoparticle mean size seems to play an important role in the interpretation of the pH-dependent phase diagram of EDL-MF.
In this context, the main goal of this work is to investi-gate the colloidal stability of EDL-MF dispersions in function of pH coupling experimental data with theoretical calcula-tions. In the first part of the paper, we describe quantitatively the interparticle forces in the EDL-MF system according to the framework of the extended DLVO potential which corre-sponds to the summation of the electrostatic, van der Waals and magnetic dipole forces. The long-range electrostatic re-pulsive component is obtained from the Poisson-Boltzmann formalism using the superposition approximation [11] and taking into account for the first time both pH [12] and the size dependence [10] of the particle surface charge. Treating the nanopaticles as rigid spheres the contribution of van der Waals interactions are calculated without retardation effects. The magnetic interparticle interactions are analyzed applying the dipole model in low coupling regime. In the section 3, a brief description of the chemical synthesis and characteri-zation of the EDL-MF samples investigated and the experi-mental procedure for the calculation of the nanoparticles sur-face charge density is revisited. Moreover, after obtaining the pH-dependent phase diagram for the EDL-MF nanoparticles, qualitative observations of the evidenced phases is presented. In section 4 the pH dependence of the surface charge density is deduced from our analysis so the pair potential interaction is calculated. Finally, the transition lines of the phase diagram are discussed in function of pH and of nanoparticle mean size.
II. PAIR POTENTIAL ENERGY FUNCTIONS
The strongly screened electrostatic repulsions between two identical and charged spheres with radiusR, separated by a surface-surface distanceDcan be calculated as [13]:
Ue kBT
=64kTε0εrπR 2
e2 tanh
eΨ0
4kT
2
exp( κD) (D+2R) , (1)
whereε0is the dielectric constant of the solvent, ethe
ele-mentary charge,kB the Boltzmann constant,T the tempera-ture,Ψ0the surface potential andkthe inverse of the Debye
length. Expanding the Poisson-Boltzmann equation up to cu-bic terms, the surface potential can be calculated as [14]:
Ψ0= kBT
2pB earcsinh
σ0eR2
p B
ε0εrkT(1+κR) !
, (2)
where the dimensionless coefficientB is dependent on the screening ratekDproduced by the electric double layer [14]. The magnitude and the range of the electrostatic repulsive contribution to the interparticle potential are very sensitive to kandσ0, which were essentially controlled in this work by
the adjustment of the ionic strength and pH of the colloidal dispersions.
Scholten [15] has estimated the van der Waals attraction between iron oxide particles dispersed in aqueous medium, neglecting retardation effects, as follows:
Uvdw kBT
= A
6kBT
2R2 D2+4RD+
2R2
(D+2R)2+ln
D2+4RD
(D+2R)2
.
(3) The magnitude of the Hamaker constantAreflects the con-tribution of the chemical nature of nanoparticles. It depends on both the polarizabilities of the ferrite particles and the di-electric permittivity of the solvent. In the case of EDL-MF particles,A=1.0 10 19J[17].
The contribution of the magnetic dipolar interaction can be calculated considering the mean field approximation for low volume fraction regime [17]:
Umag kBT
= γ
2
48π2. (4)
The parameterγdepends on the interparticle distance and on the individual magnetic moments associated with each parti-cle. In this workγ=0.006 which characterizes low coupling between particles [16]. This approximation is valid only if
γ/4π<1 which is in perfect agreement with our results. In this way, the ferrofluid samples can be considered as a disper-sion of isolated or independent nanoparticles.
III. MATERIALS AND METHODS
III.1. Sample Synthesis and Characterization
The EDL-MF samples under investigation in this work were prepared using the usual procedure [18]. Briefly, in a first step ferrite nanoparticles were synthesized by hydrother-mal coprecipitation of aqueous solutions of CoCl2-FeCl3in
alkaline medium. By changing both the nature of the base
(NaOH, CH3NH2and NH4OH) and the rate of reagents
addi-tion it was possible to obtain nanoparticles of CoFe2O4with
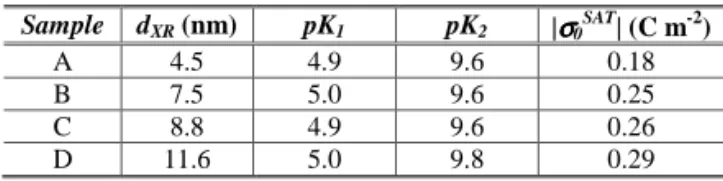
different mean sizes. In a second step the particles were con-veniently peptized in acidic medium by adjustment of the ionic strength, resulting in high quality stable sols labeled as A, B, C and D. The nanoparticles mean sizes were determined by X-rays diffraction experiments from the powder samples, obtained by evaporation of the liquid carrier and were found ranging from 4.5 to 12.0 nm (Table 1).
Table 1 - The corresponding values of the X-rays particles diameter (dX R), equilibrium constants and the saturation value of the surface
charge density for all samples investigated.
Sample dXR (nm) pK1 pK2 |σσσσ0SAT| (C m-2)
A 4.5 4.9 9.6 0.18
B 7.5 5.0 9.6 0.25
C 8.8 4.9 9.6 0.26
D 11.6 5.0 9.8 0.29
III.2. pH-Dependence of the Surface Charge Density
It has been evidenced that the EDL-MF nanoparticles come charged when properly dispersed in aqueous media be-cause of the Br¨onsted acid-base behavior of particles sur-face [12]. This structural charge is achieved through hydrol-ysis reactions at surface, which lead to positively charged sites in acidic medium and negatively ones in basic medium. Around neutral pH most of the surface sites are uncharged. In this way, the pH-dependent chemical equilibrium of protona-tion/deprotonation can be described by using a two-pK model and the concentration of the charged surface sites can be ex-perimentally determined from potentiometric-conductimetric titrations coupled with the Henderson-Hasselbalch formalism and the mass balance. Then, one can obtain both the satura-tion value of the structural surface charge density(σSAT0 )and its pH-dependence.
III.3. Potentiometric-Conductimetric Titrations
In order to determine the concentration of the charged sur-face sites we have performed simultaneously potentiometric-conductimetric acid-base titrations of 40 mL of each mag-netic colloid sample using sodium hydroxide as titrant [12]. The titrations were carried out with an electronic burette Metrohm 751 DOSIMAT. The potentiometric readings were performed with a pHmeter Metrohm 713 using a pH glass double-junction electrode while the conductivity was mea-sured with a conductometer Metrohm 712 using a conduc-tivity cell specially designed for colloidal dispersions.
III.4. Phase Diagrams
adjusted by addition of varying quantities of tetramethylam-monium hydroxide (TAMOH). The distinction of the phases was carried out by qualitative experimental observations (Fig. 1). In low pH values for all samples, the dispersion flowed and did not strongly scatter visible light, even in the pres-ence of magnetic field, evidencing the sol phase (1(a)). Pro-gressive additions of TAMOH increased the viscosity of dis-persions because of the partial neutralization of the surface charge. Thus, for samples A, B and C a phase transition was observed where a thixotropic gel could be evidenced. The magnetic colloidal dispersions did not flow when the tube test was tilted (1(b)). Under shaking, the system becomes liquid. Increasing the pH up to 5.2, all ferrofluid samples coagulated and a macroscopic phase separation with an apparent aqueous supernatant could be evidenced (1(c)).
FIG. 1: Qualitative experimental observations of the phase transi-tions for sample B. (a) Sol phase (pH = 2.0). (b) Comparison be-tween the sol (pH = 2.0) and thixotropic gel (pH = 4.5) phases. Un-like the sol phase, the magnetic colloidal gel does not flow when the tube test is tilted. (c) Fluid-solid transition (pH = 7.0). A macro-scopic phase separation with an apparent aqueous supernatant is clearly evidenced.
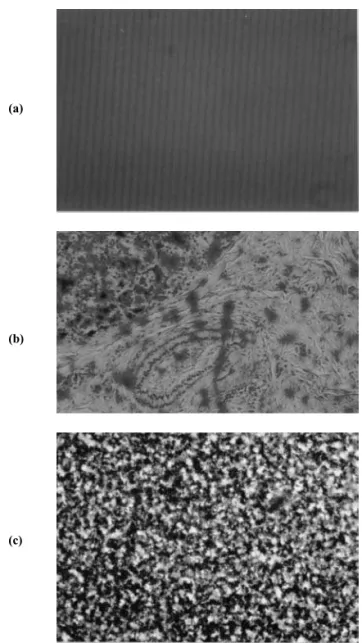
Figure 2 presents the observations of the evidenced pH-dependent phases by optical microscopy in the case of sample B. The sol phase (2(a)) is homogeneous on the scale of the optical microscope. In the coagulated state (2(c)) it can be seen solid aggregates (dark regions) dispersed in the solvent (clear regions). Macroscopically, the thixotropic gel phase is homogeneous as the sol one. However, observed by opti-cal microscopy (2(b)) it appears as if in an intermediate state, between a sol state and a coagulated one, where some local inhomogeneities are present as in a presumably triphasic sys-tem, shown in gray scale. The picture allows to observe a phase diluted in magnetic particles (gray regions), coexisting with a more concentrated one (dark regions). The clear areas refer to the solvent pockets dispersed in the later mentioned phases.
IV. RESULTS AND DISCUSSION
Figure 3 exhibits a typical simultaneous potentiometric and conductimetric titration result. It shows three distinct regions related to the neutralization of the H3O+ free ions in bulk
dispersion, the titration of the surface protons and the excess of base added, respectively. The equivalence points are de-termined by using the technique of graphical direction lines [19]. Then using the Henderson-Hasselbalch [20] equation, the constants of the chemical equilibrium involved in the sur-face protonation/deprotonation process (pK1andpK2) can be
(a)
(b)
(c)
FIG. 2: Microscopic observation pictures of sample B. (a) sol (pH = 2.0), (b) gel (pH = 4.5) and coagulated (pH = 7.0).
obtained. Moreover, the whole superfitial sites concentration CT can be determined using the mass balance. According to the Two-pK model, the surface charge density (σ0)can be
calculated as [12]:
σ0(pH) = F AV
10−2pH
−10−(pK1+pK2) 10−2pH+10−(pH+pK1)+10−(pK1+pK2)
! CT,
(5) whereF is the Faraday constant, Athe total surface area of particles (including the polydispersity) andV the volume of the dispersion. Table 1 summarizes the obtained results ofσ0
for all samples.
0 5 10 15 20 25 30 2
4 6 8 10 12
2 4 6 8 10 12
EP3
EP1
κ
(
m
S
c
m
-1)
p
H
Volume (mL)
pH κ
FIG. 3: Typical potentiometric-conductimetric titration curve of EDL-MF samples. EP1 and EP3 are the equivalence points.
ionic strength does not allow stable EDL-MF dispersions, al-though the particle surface is charge saturated.
2 4 6 8 10 12 -0,2
-0,1 0,0 0,1 0,2
σ0
(
C
m
-2)
pH
FIG. 4: pH dependence of the surface charge density for nanoparti-cles of sample B according to the Two-pK Model. This profile was evidenced for all samples investigated.
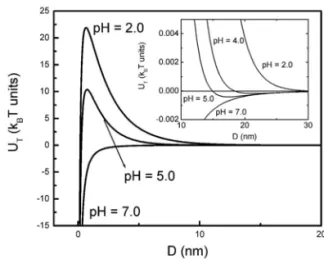
The calculated pair potential interactionUT (inkBT units) taking into account the pH dependence of the surface charge density in the electrostatic repulsion, is shown in figure 5 for some pH conditions of sampleB. The potential profile ex-hibits a primary minimum at short interparticle distances and a positive energy barrierW at short interparticle distances
(D=2nm). The pair potential may reveal strong long-range repulsion or irreversible aggregation at the primary minimum (coagulation) depending on the height of the energy barrier and on the nanoparticles mean size. In the inset of the fig-ure 5 one can identify a secondary minimum at intermediary interparticle distances(D=17nm). If this minimum is mod-erately deep a reversible aggregation phenomena may occurs (flocculation).
The transition lines of the pH-dependent phase diagram and the height of the energy barrier in function of pH for sam-pleB are plotted in figure 6. In low pH medium, the high energy barrier associated to the saturation value of the struc-tural surface charge density ensures the sol phase. The pH increasing leads to a strong reduction of both energy barrier and nanoparticle charge. Then, a thixotropic gel phase is
evi-FIG. 5: Pair potential interaction results for some pH conditions of sample B.
denced in the range of 3.8<pH<5.2. The existence of this reversible phase transition (flocculation) is clearly related to the decrease of the nanoparticle surface charge about 50% of its saturation value and to the presence of a secondary mini-mum whose depth increases for pH increments in the range of analysis. Simultaneously, the position of this secondary mini-mum is shifted towards lower values of interparticle distance, evidencing a slight aggregation effect. ForpH 5.2 in acidic medium, the energy barrier and the surface charge fall dras-tically so the both minima collapse. Indeed, according to the literature [21] when the energy barrier is lower than 5kBTthe thermal fluctuations are sufficient to induce rapid coagulation with a sharp macroscopic fluid-solid phase separation. This phase transition is irreversible due to the strong van der Waals forces which maintain the particles held together and do not break apart without strong external forces.
FIG. 6: The pH-dependent phase diagram sample B, the height of the energy barrier (W) and the pH dependence of the surface charge density. The labels SOL, FLOC and COAG refer to sol, flocculated and coagulated phases, respectively.
the sol-gel transition in EDL-MF occurs in the same pH range where the surface charge strongly decreases compared to its saturation value that implies an increase of the amphoteric surface sites concentration. In this way, these experimental observations are consistent and the thixotropic gel phase in EDL-MF would result from the free energy minimization of the system which would tend to compensate the decreasing of the nanoparticle charge through a surface charge sharing, positive or negative, between particles. This charge sharing suggests a movement of protons by “proton hopping” [24,25] along the hydrogen bonding network of liquid water adjacent to the particles according to the Grotthus mechanism [26,27]. A qualitative and significant fact is that when the nanoparti-cle surface charge is very small, the system coagulates and the thixotropic gel phase is not evidenced. Moreover, it has been reported that this behavior does not take place in sur-facted magnetic fluids [28,29], except under external mag-netic field. In this case it has been observed an increase of the system viscosity when the nanoparticles form reversible aggregates [29]. It is worth to underline that in this kind of magnetic fluids the peptization procedure is carried out in non-polar medium, where no charges are involved. An-other key factor that enhance our hypothesis is the fact that the strength of hydrogen bonds usually ranges from 4 kJ/mol to 20 kJ/mol. This energy is smaller than a covalent bond en-ergy, but greater than the thermal energy (2.5 kJ/mol at room temperature) [1]. Thus, if the hydrogen bonding is present in the system it dominates the properties of the solvent. In fact, one can observe that under a gentle shaking, which would be sufficient to break the hydrogen bonds, the magnetic colloidal recovers a flowing liquid state in a short time scale but the gel regenerates if the sample is left to stand.
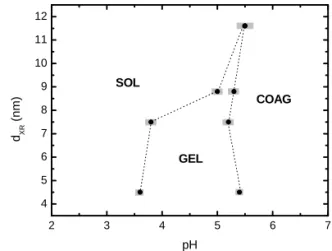
In order to investigate the nanoparticle size dependence in the pH ranges of the observed phase transitions in EDL-MF, we plotted in figure 7 the pH dependent phase diagram for all samples. The gray bars estimate the uncertainty of the pH determination for each phase transition. As it shows, the decrease of nanoparticles mean size leads to a significant in-crease of the pH range related to the gel phase. In contrast, for larger particles the sol-gel transition occurs in a very narrow pH range. In the case of sampleD, it is not evidenced any gel phase. Regarding the phase transitions (GEL! COAG or SOL! COAG), the nanoparticle mean size has no influ-ence on the pH of coagulation. In fact, as shown in figure 8, pH 5.5 in acidic medium impliesW 5kBT, which in-duces rapid coagulation whatever the nanoparticle mean size. On the one hand the X-DLVO approach applied in this work leads to good results related to the general compre-hension of the pH-dependent phase diagram of EDL-MF. On the other hand the theory is unable to explain the nanoparticles size dependence on the pH ranges related to the sol-gel phase transitions in the magnetic colloidal dis-persions. The X-DLVO potential used in our investigations only includes the interplay between short-range attractive forces (van der Waals and dipolar magnetic interactions) and long-range repulsive force (electrostatic repulsion interaction). However, in general colloidal systems the presence of non-magnetic and non-DLVO forces, which could be monotonic repulsive, monotonic attractive or oscillatory [1], can strongly modify the profile of the pair
2 3 4 5 6 7
4 5 6 7 8 9 10 11 12
COAG
GEL SOL
dX
R
(
n
m
)
pH
FIG. 7: Nanoparticle size dependence in the pH ranges of the SOL!
GEL! COAG phase transitions in EDL-MF.
2 3 4 5 6 7
0 5 10 15 20 25
W
(
kB
T
u
n
it
s
)
pH
A (dXR = 4.5 nm)
B (dXR = 7.5 nm)
C (dXR = 8.8 nm)
D (dXR = 11.6 nm)
FIG. 8: Height of the energy barrier in function of pH for all samples investigated.
potential interaction [30]. These additional forces, mainly related to hydration forces (as hydrogen bonding in our case), become preponderant specially as the interparticle distance decreases. Then, concerning the EDL-MF system, the influence of the nanoparticle size in the sol-gel phase transitions requires a more detailed theoretical description of non-DLVO short-range interactions in order to include in the interparticle potential the hydration forces induced by the hydrogen bonding network related to the thixotropic gel phase formation. Despite the influence of hydration forces, the role of the size polydispersity of EDL-MF nanoparticles has to be emphasized. Whatever the preparation method, magnetic colloids always present size distribution. Since the pair potential energy function considers two identical particles, the existence of this polydispersity doubtless affects the diffusion of particles in the solvent, the phase stability of the colloidal system and the interparticle interac-tions which probably modify the pair potential interaction.
V. CONCLUDING REMARKS
We have used an extended DLVO potential in order to sim-ulate the interplay between short-range attractive forces and a long-range repulsive force in the system. The profile of the interparticle energy function was successfully employed to investigate quantitatively the phase transitions induced by modifications of the hydronium concentration of the magnetic colloidal dispersions. As a consequence of the Br¨onsted acid-base behavior of nanoparticle surface, the superficial density of charge proved to be a very important parameter to fine-tune the electrostatic repulsive interparticle potential. In this way, by monitoring experimetally the nanoparticle charge three distinct phases could be evidenced: sol in low pH, coagu-lated in neutral pH region and a thixotropic gel phase in pH ranges between the previous ones, whose existence is related to the formation of a hydrogen bond network in liquid wa-ter adjacent to the particles. The transition lines of the
con-structed phase diagrams revealed that the increase of nanopar-ticle mean size implies a significant decrease of pH ranges re-lated to the gel phase. Nevertheless, the fluid-solid transitions occurred in the same pH range independing on the particle mean size. In a future attempt we will propose an expression in the pair potential interaction to take into account the non-DLVO forces related to hydration phenomena involved in the gel phase of EDL-MF.
Aknowledgments
The authors are so grateful to the Brazilian agencies CAPES, CNPq, and FINATEC for their financial support.
[1] J. N. Israelachvili, Intermolecular and Surface Forces, (Aca-demic Press, New York, 1985).
[2] F. Cousin, V. Cabuil, Progr. Colloid Polym. Sci115, 77 (2000). [3] F. Cousin, E. Dubois, V. CabuilPhys. Rev. E68021405 (2003) [4] A. Robert, E. Wandersman, E. Dubois, V. Dupuis, R.
Perzyn-ski,EuroPhys. Lett.75, 764 (2006).
[5] E. Hasmonay, A. Bee, J.-C. Bacri, R. Perzynski, J. Phys. Chem. B103, 6421 (1999).
[6] J.-C. Bacri, R. Perzynski, D. Salin, V. Cabuil, R. Massart, J. Colloid Interface Sci.132, 43 (1989).
[7] R. Massart, E. Dubois, V. Cabuil, E. Hasmonay, J. Magn. Magn. Mater. Sci.149, 1 (1995).
[8] O. Sandre, J. Browaeys, R. Perzynski, J.-C. Bacri, V. Cabuil, R.E. Rosensweig,Phys. Rev. E591736 (1999).
[9] E. Dubois, R. Perzynski, F. Bou´e, V. Cabuil,Langmuir165617 (2000).
[10] A. F. C. Campos, F. A. Tourinho, R. Aquino, J. Depeyrot, J. Magn. Magn. Mater. Sci.310, 2847 (2007).
[11] S. L. Carnie, D. Y. C. Chan, J. Stankovich, J.Colloid Interface Sci.165, 116 (1993).
[12] A. F. C. Campos, F. A. Tourinho, G. J. da Silva, M. C. F. L. Lara, J. Depeyrot, Eur. Phys. J. E6, 29 (2001).
[13] W. B. Russel, D. A. Saville, W. R. Schowalter, Colloidal Dis-persions, Cambridge University Press, Great Britain, 1989. [14] A. O. Ivanov, Colloid Journal59, 446 (1997).
[15] P. C. Scholten, Colloid Chemistry of Magnetic Fluids. Ther-momechanics of magnetic fluids; Berkovsky, Hemisphere
Pub-lishing Corporation, Bristol, 1978.
[16] C. Menager, L. Belloni, V. Cabuil, M. Dubois, T. Gulik-Krzywicki, Th. Zemb, Langmuir12, 3516 (1996).
[17] E. Dubois, V. Cabuil, F. Bou´e and R. Perzynski, J. Chem. Phys.
111, 7147 (1999).
[18] F. A. Tourinho, R. Franck, R. Massart, J. Mater. Sci.25, 3249 (1990).
[19] E. Chromiak, Analyst120, 149 (1995).
[20] D. A. Skoog, D. M. West and F. J. Holer, Fundamentals of Analytical Chemistry (Saunders College Publishing, Orlando, 1996) p 202.
[21] Y. Wang, R. J. Pugh, E. Forssberg, Colloid Surf. A 90, 117 (1994).
[22] T. Jin, D. Finotello, Phys. Rev. Lett.86, 818 (2001). [23] L.P. GoodmanUS Patent6.617.356 (2003). [24] K. D. Kreuer, Solid State Ionics94, 55 (1997). [25] R. Pomes, B. Roux, Biophys. J75, 33 (1998). [26] N. Agmon, Chem. Phys, Lett.244, 456 (1995).
[27] P. W. Atkins, Physical Chemistry(Oxford University Press, Oxford, 1994).
[28] G. M. Sutariya, R. V. Upadhayay, R. V. Metha, J. of Colloid Interf. Sci.155, 152 (1993).
[29] S. Odenbach, H. St¨ork, J. Magn. Magn. Mater.183, 188 (1998). [30] D. Grasso, K. Subramaniam, M. Butkus, K. Strevett, J. Bergen-dahl, Reviews in Enviromental Science & Biotechnology 1