Gravitational and Magnetic Separation in Self-Assembled Clay-Ferrofluid Nanocomposites
F.L.O. Paula
Institute of Physics, University of Bras´ılia, Bras´ılia, Brazil G.J. da Silva, R. Aquino, and J. Depeyrot Institute of Physics. University of Bras´ılia, Bras´ılia, Brazil
J.O. Fossum
Department of Physics, Norwegian University of Science and Technology, Trondheim, Norway K.D. Knudsen and G. Helgesen
Physics Department, Institute for Energy Technology, Kjeller, Norway F.A. Tourinho
Complex Fluids Group, Institute of Chemistry, University of Bras´ılia, Bras´ılia, Brazil (Received on 1 September, 2008)
We report on experimental observations of self-assemblies in colloidal dispersions of clay nanoplatelets and magnetic nanoparticles. Visual observations have been combined with small angle X-ray scattering (SAXS) in the study of several composites at a fixed clay concentration in the dilute regime, and varying ferrofluid con-centrations. Our visual observations which encompass macroscopic separation in gravitational- and magnetic field, indicate that all samples present a concentrated phase and a diluted one. SAXS data obtained from each phase are consistent with the interpretation that the scattering contribution from the clay nano-platelets in the samples can be neglected in comparison with the magnetic particle contribution. The analysis of the scattered intensity is performed combining two models, one based on the global scattering function and the other allow-ing the extraction of the structure factor of the mixtures. The parameters of the size distribution of magnetic nanoparticles determined by both methods are in good agreement. The structure factor of the mixtures shows that on a local scale, the mixtures behave like a gas of isolated magnetic nanoparticles. It also indicates the presence of interactions between magnetic nanoparticles mediated by the presence of Laponite platelets. Such interactions could be attributed with a progressive partial phase separation between spheres and discs rather than to the formation of dense aggregates.
Keywords: VER
Introduction
Self-assembly of nanoparticles and the use of such parti-cles in composite materials are currently very active areas within chemistry, physics, and nanoscience [1]. Many self-assembled systems under investigation are colloidal particle systems, such as suspensions of carbon nanotubes, clays, ferrofluids etc. [1–3]. To predict and monitor the thermo-dynamic stability of dispersions and to associate theoretical models with the experimental results represents a challenge in colloidal science. Several technological and industrial ap-plications require stable colloids, and this is directly related to the process of self-assembly and phase separation. Col-loidal stability and self-assembly is very complex and in-volves several kinds of particle interactions [4], van der Waals and magnetic dipole-dipole interactions and repulsive elec-trostatic interaction. Considering the solvent as a continuous medium, it is possible to make analogies between colloidal and atomic systems because the interparticle interaction po-tential displays the same overall shape for both systems [5]. With this point of view, liquid phases, gas phases and solid phases can be observed in colloidal dispersions. However un-like atomic systems, inter-particle interactions in complex flu-ids made from self-assembled colloidal nanoparticles can be tuned by experimental parameters such as ionic strength [6], temperature, colloidal pH, density and size of nanoparticles [6–8], magnetic field [3, 9, 10] or electrical field [11, 12].
In the present case, we report on experimental investiga-tions of composite mixtures of two such complex particle sys-tems; i.e. composites of Laponite clay nanoplatelets [13] and magnetic nanoparticles [14]. Dispersions of discotic nanopar-ticles of Laponite present aging properties and a well known rheological state diagram with an isotropic-nematic transi-tion. Ferrofluids are colloidal dispersions of ferrite nanopar-ticles and combine liquid properties and susceptibility to an applied magnetic field. By associating both aqueous colloidal systems, one may thus obtain a magneto-rheological system. The present work expands and elaborates in depth on a previ-ous preliminary report on these systems [15].
Each of the two ingredient aqueous colloidal systems, i.e. clay and ferrofluid, have their own phase behavior as a func-tion of several parameters and are in the present case strongly dependent on the electrostatic interactions [4]. The chemi-cal synthesis [16] and the colloidal stability [17] of magnetic nanoparticles in aqueous media are relatively well known, and their phase behavior as a function of ionic strength and temperature has been studied using small angle neutron scat-tering.
Laponite [10, 19] is a widely studied synthetic clay that be-longs to the family of swelling 2:1 clays [2, 20]. The colloidal phase diagram of aqueous Laponite suspensions as a function of ionic strength and concentration has been investigated [10] and displays four different regions (phases): isotropic liquid, isotropic gel, nematic gel and flocculation.
incorporated as a probe into clay dispersions in order to char-acterize their spatial repartition and micro-rheological behav-ior [21]. In the present work, we prepare a Laponite clay dis-persion (0.1 wt %) in the isotropic liquid phase, and combine this with citrated ferrofluid based on cobalt ferrite nanopar-ticles at several concentrations in order to obtain composite products. We report here on experimental investigations and results from visual observations combined with small angle X-ray scattering experiments.
In the following sections, we first describe in detail the aqueous suspensions of Laponite nanoplatelets, the synthe-sis of magnetic nanoparticles and the elaboration of com-posite mixtures. Then, visual observations of the compos-ites and small angle scattering experiments are presented and followed by a description and discussion of the experimental observations.
Materials and Methods
Aqueous suspensions of Laponite nano-platelets
Laponite is a synthetic clay with general formula Na+0.7
[Si8Mg5.5Li0.3H4O24]−0.7, diameter around 25 nm and
thick-ness of 1 nm, and nearly monodisperse. The chemical pH stability range of Laponite platelet solutions is narrow: be-low pH 9 the magnesium ions dissolve in solution, and above pH 10 the dissolution of silica is observed [22]. The struc-tural charge of the surface of the platelets is negative. The edge charge depends on the acid–base behavior of the Si— OH and Mg—OH amphoteric hydroxyl groups which are the main species on the edge. Figure 1a shows a Laponite parti-cle and its crystallographic structure. Laponite powder with high chemical purity was purchased from Laporte Absorbents (UK). The Laponite stock solution was prepared in a sodium citrate solution with trisodium citrate (Na3Cit)=2.5×10⁻³
mol/l and vigorously stirred for 48 h.
Aqueous suspensions of synthesized magnetic nanoparticles
Cobalt ferrite nanoparticles were obtained using a hy-drothermal coprecipitating aqueous solution of a CoCl2–
FeCl3mixture in alkaline medium [16]. After the
coprecip-itation step these particles were conveniently peptized in an acidic medium by adjustment of the ionic strength resulting in an aqueous stable sol of high quality at pH∼2. Addi-tion of Na3Cit to the solution allows coating of the particles
with citrate ions for dispersion in aqueous solution at pH∼ 10. Figure 1b displays the crystallographic structure of Cobalt ferrite nanoparticles.
In the present case, the mean size of our nanoparticles was determined through X-ray powder diffractograms. Accord-ing to the Scherrer equation and usAccord-ing the half width of the strongest diffraction peak it leads to an average size 14.0 nm. TEM allowed also the morphology and the size distribution of the nanoparticles to be characterized. The size distribution is usually described by a log-normal law:
P(d) =√ 1
2πdσexp(−
ln2(dd0)
2σ2 ), (1)
FIG. 1: Characteristic shape, dimensions, crystallographic structure and chemical formula for a Laponite particle a) and a Cobalt ferrite nanoparticle b).
whered0is the characteristic size of the distribution andσthe
polydispersity index. From TEM pictures a sampling of about 500 individual particles was analyzed and the size histogram was obtained givingd0=11.7 nm andσ=0.24.
Composite mixtures
In order to obtain a stable isotropic liquid dispersion of magnetic nanoparticles and Laponite platelets it is necessary to adjust the pH and ionic strength of each precursor col-loid. On account of the citrate adsorption equilibrium at the magnetic nanoparticle surface the ionic strength of the mix-ture is imposed by the sodium citrate concentration and fixed, by dilution, to the required value. As described above, the Laponite suspensions must have pH between 9 and 10 in or-der to avoid platelet degradation. In the case of citrate fer-rofluids, the pH stability interval ranges from 4 to 10. Since the pH and ionic strength regions in which it is possible to obtain a stable dispersion is narrow, we have fixed the pH to 10 and the ionic strength to Na3Cit=2.5x10⁻³mol/l in all
mixtures. This Na3Cit concentration is equivalent to an ionic
strengthI=1
0.1% w/w Laponite stock solution and stirring vigorously for 10 min. All samples were degassed to prevent any formation ofCO−3 and stored for about 1 month before the scattering experiments.
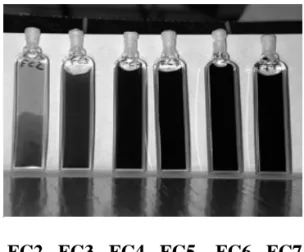
FC2 FC3 FC4 FC5 FC6 FC7
FIG. 2: Investigated samples of composite Ferroclay (FC), labeled and numbered from FC2 to FC7. Note that CoFe2O4nanoparticles optically absorb in red and that Laponite nanoplatelets do not.
Figure 2displays the investigated composite (FC) samples labeled from FC2 to FC7 with increasing content of magnetic nanoparticles. For all samples, there is a concentrated region (lower part) and a diluted region (upper part). This is most clearly evidenced for the FC2 sample, even if, in the lower part of the bottle, concentrated domains mixed with more di-luted regions can be seen. The characteristics of the studied samples are collected inTable 1which also gives the details of pure ferrofluid (FF) and pure Laponite samples (Lp). The table lists their respective concentrations of nanoparticles in grains/cm3, their corresponding volume fraction of
nanopar-ticlesφ(%), the ratio between the number of platelets and the number of ferrite nanoparticles, as well as the ratio between the volumes of each material.
Samples Particles Concentration (1014
grains/cm3
) φ
(%) Number ratio
FF Lp
Volume ratio
FF Lp
FF 4.0 × 10²
1 - -
Laponite 11.0 0.1 - -
FC2 0.9 0.010 11.91 3.37
FC3 2.3 0.025 4.76 1.34
FC4 4.7 0.050 2.38 0.67
FC5 7.0 0.075 1.58 0.44
FC6 9.3 0.100 1.19 0.33
FC7 23.0 0.250 0.47 0.13
Table 1:Content in ferrite nanoparticle and Laponite nanoparticles in the samples studied.
Visual observations:
In order to investigate the behavior of this composite sam-ples under an applied magnetic field, one of the samsam-ples (FC3) was loaded into a 1mm quartz cell and placed in contact with a discoid rare earth permanent magnet of approximately
1.2 Tesla, which induces a strong magnetic field gradient. Vi-sual microscopy observations were recorded at regularly in-tervals of time, and pictures were taken for situations with and without a magnetic field gradient.
Small angle X-ray scattering (SAXS):
The SAXS experiment was done at beamline D11A-SAXS at the Laboratorio Nacional de Luz Sincrotron (LNLS) in Campinas, Brazil (energy range 6–12 keV). All data were col-lected at a wavelength,λof 1.756 ˚A with a sample-to-image plate detector distance of 1.5 m resulting in a coveredqrange from about 0.01 to 0.2 ˚A−1, where q= (4π/λ) sinθ is the modulus of the scattering vector, and 2θis the scattering an-gle. The samples were contained in metricconverter in 1mm quartz capillaries. Data treatment was performed using the software FIT2D (free download from ESRF: www.esrf.eu) with the usual corrections included in its routine integration of the two-dimensional SAXS pattern. The output of this soft-ware provides the corrected intensities ready for subtraction of the scattering from the citrated solution and the quartz cap-illary. The scattering length densities of CoFe2O4
nanopar-ticles, Laponite platelets, water and sodium citrate are 4.35, 2.29, 0.94 and 1.66×1011cm−2respectively.
Theoretical considerations
Scattered intensity
The scattered intensity from a dispersion of single and cen-trosymmetrical objects, each of average volume V, can be written asI(q) =nV2∆ρ2|F(q)|2S(q)
, wherenis the number of scattering objects per volume unit (cm−3) of solution,∆ρ
is the contrast between the particles and the solvent,P(q) =
|F(q)|2 is the particle form factor andS(q) is the structure factor of the solution. For a dilute dispersion of isolated scat-tering objects,S(q)= 1. In this case, at sufficiently lowq, the scattering may be described by the Guinier law which allows to determine the Guinier scattering object radius of gyration (RGg) by the expression I(q) =I(0)exp(−q2(RGg)2/3)). At
high values ofq, i.e. whenq>>1/RG
g, the scattering curve reflects the characteristics of the interface between the scat-tering object and the solvent (Porod region). In the case of non-interacting randomly oriented platelets (h<<D, where h is the platelet thickness and D is the platelet diameter), the measured scattered intensity scales asq−2in the intermediate range (See Ref. 15). For the case of spherical non-interacting particles, the scattering intensity in the Porod regime scales asq−4.
For a polydisperse set of scattering objects, the size distri-bution must be taken into account and, using scattering data, the size distribution function can be obtained by a numerical routine.
∆2
FerriteVFerrite2 /∆ρ2lapoV
2
lapo is about 10
2; then, the I(0)
scat-tering of ferrite nanoparticles should be superior than the I(0) scattering of laponite platelets by more than one order of mag-nitude for FC2 and two orders of magmag-nitude for samples FC6 and FC7. Moreover, we have already shown in reference 15, where we present SAXS scattering from a 1 % pure citrated ferrofluid solution and a 0,1 wt % pure clay dispersion, that the scattering of our Laponite-ferrofluid composite sample FC3 is mainly due to the magnetic nanoparticles since we observe about one order of magnitude lower SAXS scatter-ing from pure Laponite as compared to pure ferrofluid for our concentrations.
Global scattering function, the unified equation
Here, we use a global scattering function proposed by G. Beaucage [23] which unifies the Guinier and Porod local laws in only one function which describes the form factor of a scat-tering object in terms of radius of gyration and interfaces in the medium. This function writes:
I(q) =Gexp −q
2R2
g 3 ! + B qn o
+y0, (2)
with qo=q
h
er f(qRg.√6)i3, where erf(x) is an error function,Gis the Guinier pre-factor proportional to the con-centration of scattering objects and to the square of the vol-ume,Bis a constant pre-factor specific to the kind of power law obtained for highq values andν0is a term introduced
in order to take into account the incoherent scattering. This global scattering function describes both regimes at low and high values of the scattering vectorq. In general, the value of the exponentn is between 3 to 4 in the case of fractal surfaces, smaller than 3 for fractal masses and larger than 4 for diffuse interfaces [17, 24–26]. These models have been successfully used to characterize a disordered cluster struc-ture [28], a fractal mass of particles [29] as well as to dis-tinguish between individual polydisperse particles and aggre-gates [30]. Polydispersity of the particles serves to increase the dimensionless ratioBR4g
Gassociated with the size Poly-dispersity Index (PDI) of the scattering object. For a system of polydisperse spheres described by a log-normal size dis-tribution, the parametersR0(the characteristic radius of the
distribution) andσcan be obtained directly by the unified fit parameters, through the spherically normalized PDI [30] and BR4g
(1.62G):
R0=
r 5
3Rgexp −7σ
2
andσ=
lnPDI
12 1/2
. (3)
Using the definition ofPDIwe can rewrite the global scat-tering function as:
I(q) = G (
exp −q
2R2
g 3
!
+
+ 1.62PDI
R4
g
!ner f qR2 g
61/23on
qn
y0. (4)
Extraction of the structure factor
For monodisperse spheres of diameterd, the form factor is the square modulus of [31]:
Fd(q) =3
sin(qd/2)−cos(qd/2)
(qd/2)3 . (5)
The size distribution must be taken into account by consid-ering a superposition of contributions of each different par-ticle weighted by the square of the parpar-ticle volume. We can therefore write the form factor as:
P(q) = R∞
0 |Fd(q)|2P(d)d6dd
R∞
0 P(d)d6dd
. (6)
If the clay scattering is negligible,I(q)∼P(q)Smixtures(q). AsP(q)has been independently measured on a pure solution of isolated magnetic nanoparticles [15], one can easily calcu-late the structure factor of the mixturesSmixtures(q).
Results and discussion
2D SAXS scattering patterns were collected from the sam-ples presented in Table 1. Subsequently, the two-dimensional images were integrated in order to obtain one-dimensional scattering curves as a function of scattering vector magnitude, q. These one-dimensional scattering curves that have been analyzed below. The data were obtained for each of the two gravity-induced regions indicated in Figure 2, that are sepa-rated into an “upper” and a “lower” part. These measurements were performed at equilibrium conditions, in the absence of external magnetic field.
In our preliminary report on these systems [15], we showed that equation 4 describes very well both the SAXS and SANS I(q)scattering curves obtained from our pure Laponite dis-persion and pure citrated ferrofluid solution. For the 0.1 % wt dilute dispersion of Laponite nanoplatelets, we observed that the scattering intensity is low and we concluded that the SAXS scattering power of our Laponite dispersion scale as q−2 in agreement with previous observations [32]. For the pure citrated ferrofluid solution, the deduced values of the lognormal size distribution parameters were in good agree-ment with Rietveld refineagree-ment of the X-ray powder diffrac-tion pattern of magnetic nanoparticles. We have furthermore observed that the scattering is proportional to the ferrofluid particle concentration, indicating that we are working in a non-interaction regime as far as the pure ferrofluid is con-cerned. For small values of q, typically q < 0.01 ˚A−1, the log-log plots from our pure ferrofluid samples show a plateau, indicating the absence of large aggregates and no significant interactions between scattering objects. For larger qvalues, the log-log scattering intensity scales withq−4, as will be the case for 3-D objects with a sharply defined smooth interfaces. Moreover, using equation 6, the nanoparticles form factor can also be determined.
FIG. 3: SAXS curves obtained for botha)Concentrated partb) Di-luted part for the samples FC3, FC4, FC6 and FC7. Open squares represent experimental data, continuous lines the fitted model ac-cording to eq. 4, and the dash-dotted line theq−4behavior.
(dashed line in Fig. 3) as expected for a Porod region for non-interacting smooth nanoparticles, thus confirming that the scattering from our Laponite–ferrofluid composites is mainly due to isolated magnetic nanoparticles. This conclusion is further strengthened by our observation in Figure 4, which shows that by appropriate scaling, both the diluted and the concentrated part scattering data can be scaled onto a master curve.
The good agreement between experimental data and the model of the Global Scattering Function is shown on Figure 3 where the continuous line represents the results of the best fit obtained using equation 4. The exponentnhave been fixed to 4, the Porod value for smooth particles (here spherical) and the other parameters,G, Rg and PDI have been left free to vary. The values ofσwere deduced from thePDIvalue de-termined using equation 3.
Figure 5 present the values ofG, R0andσdeduced from
the fit, both for the diluted and more concentrated parts, plot-ted as a function of the concentration of the number of mag-netic nanoparticles per cm3(prior to separation). The ratio of
the Guinier pre-factor determined from this SAXS analyses gives the ratio between the concentrations of the two parts. The fitted values forR0andσin both cases agree well with
those determined for the diluted pure ferrofluid. The values of R0deduced from the Guinier law are in good agreement with
those obtained from the fit with the global scattering
func-FIG. 4: Master curve for SAXS from all samples invetigated.
tion, using equation 4. Moreover, both determinations com-pare well with the RX Rvalue using the following empirical relationship [21]RX R=R0exp(2.5σ2). It therefore confirms
that for all our composite samples, the distribution of scatter-ing object is the same for both parts of the sample, composed by spheroidal objects with a mean value ofR0around 5.5 nm
and a polydispersity index equal to 0.34, close to the distribu-tion parameters of FF sample.
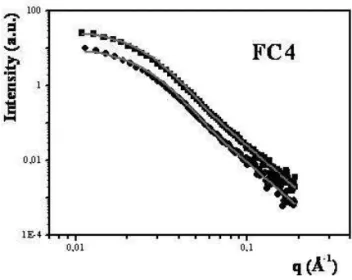
We now use as form factor, a superposition of contributions of each spherical particle weighted by the square of the par-ticle volume (see equation 6) enlightens the discussion about the FC dispersion structure. Figure 6 shows, in continuous line, the best form factor for spherical objects calculated using a log-normal function for the diluted (circle) and concentrated (square) phases of sample FC4. It indicates that the scatter-ing intensity resembles that of an assembly of non-interactscatter-ing spheres as the calculation agrees well with the experimen-tal points. Similar results are obtained for samples FC3 to FC7 and the determined parameters of the size distribution for these samples are shown in Table 2.
For all samples, the values ofR0andσ, obtained in both
concentrated and diluted parts, converge to the same value which compares well with the parameters of the size distri-bution of the pure FF sample. Moreover, these values agrees well with those deduced using the Global Scattering Function (see Figure 5). Again, this result indicates that the scattering of our colloidal mixtures of ferrite nanoparticles and Laponite nanoplatelets is mainly due to the presence in the dispersion of magnetic nanoparticles, and that in our samples, the con-tribution of Laponite nanoplatelets can be neglected.
FIG. 5: Fitted parameters as a function of concentration ofFF× 1014(grains/cm3) for the FC samples listed in Table 1. Full squares for concentrated samples and open circles for the diluted ones. The values ofR0are in units of ˚Angstrom.
concentrated phases.
The structure factors of Figure 7 are close to 1 over a large range of q values, showing a very flat profile when q > 0.015 ˚A−1 indicating that in our mixtures, the cobalt
ferrite nanoparticles are not sensitive to effective attractions at short scales. Thus, on a local scale, the mixtures behave like a perfect gas of isolated magnetic nanoparticles. This is the case both for the concentrated and diluted phases. Nev-ertheless, for q<0.015 ˚A−1the structure factors present a slight increase, up to 1.3. A similar behavior, with a more pronounced steep rise for lowerqvalues, has recently been observed in fluid suspensions of Laponite nanoplatelets and maghemite nanoparticles [33] with low content of both kinds of nanostructures. It has been related to the existence of effec-tive attraceffec-tive interactions between magnetic nanoparticles, induced by the presence of Laponite platelets, which leads to a progressive spatial exclusion of the two kinds of nanos-tructures. This partial phase separation between spheres and discs cannot be excluded in this work; nevertheless such at-tractive effect seems to be weaker in our samples due to the lower content of both kinds of nanoparticles in the mixtures.
Our visual observations (Figure 2) also seem to indicate the existence of interactions with the presence of darker and
FIG. 6: SAXS curves obtained for both diluted (circle) and concen-trated (square) phases of sample FC4. The full lines represent the best fit obtained with a form factor of spherical objects calculated using a log-normal function (equation 6)
Sample Concentrated Diluted
FC3 11.0 11.0
FC4 11.8 11.7
FC6 11.6 11.2
d0 (nm)
FC7 10.4 10.6
FC3 0.33 0.35
FC4 0.34 0.34
FC6 0.36 0.36
σ
FC7 0.35 0.36
Table 2:Parameters of the size distribution of scattering objects obtained from fitting the scattering curves of diluted and
concentrated phases accordingly to equation 6.
lighter regions in the more concentrated phase which could be associated with a progressive segregation-like phenomenon rather than to the formation of dense aggregates. Indeed, for dense aggregates, it would be expected a structure factor with a correlation peak for large values ofqdue to the contact be-tween particles and a correlation hole for intermediateq, fea-tures which are not observed here.
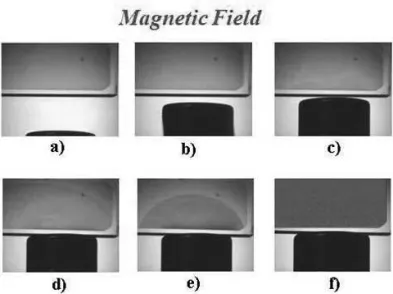
In addition, we found that when submitted to a magnetic field gradient all prepared Laponite-ferrofluid composite sam-ples show a separation in a diluted region with smaller mag-netic susceptibility and a concentrated region which geomet-ric shape is a consequence of the magnetic field lines. Also, it was observed that the composite samples return to single phase samples with apparent homogeneous visual appearance within tens of seconds after the magnet is removed. Note that this is not a quantitative study due to the inhomogeneity of the applied magnetic field generated by the disc-shaped perma-nent magnet which results in a net translational force. Figure 8a-e illustrates the dynamics of this separation for composite sample FC3.
FIG. 7: Structure factor for the concentrated phase for different sam-ples. The inset presents the results obtained for the diluted and con-centrated phases of sample FC4.
FIG. 8: a)-e) Dynamics of the separation for composite sample FC3 as the rare-earth permanent magnet approach the quartz cuvette. The total elapsed time from a)-e) was about 3 minutes, and the images are evenly spaced in time. Figure metricconverterProductID8f8f shows the original FF sample under the presence of the same field.
Nevertheless, the behavior of such mixtures in the presence of an applied magnetic field would requires more SAS inves-tigations.
Conclusions
Composite materials were obtained from the mixture of an isotropic phase Laponite solution with a diluted citrate
fer-rofluid for various magnetic nanoparticle volume fractions. Such a Laponite–ferrofluid composite material raises gen-eral questions concerning self-assembly and colloidal stabil-ity. During sample mixing, the pH and ionic strength parame-ters of the final system were optimized in order to respect the range of stability of each component.
Small-angle X-ray scattering experiments were performed in order to investigate the nanostructure of the composite samples. The scattering is much more intense for the mag-netic nanoparticles than for the Laponite platelets, thus the composite scattering signal is mainly due to the magnetic nanoparticles. Fitting the scattered intensities to a global scat-tering function including the size polydispersity and the form factor using the log-normal distribution allows us to deduce the characteristic radius and polydispersity index of the scat-tering object present in the composite sample, and to show that it is the same as for the pure ferrofluid sample. Using a form factor calculated by a superposition of contributions of each spherical particle weighted by the square of the particle volume assists in the discussion about the ferroclay disper-sion structure. First, the fitted parameters of the size distri-bution of magnetic nanoparticles match well the determina-tion with the global scattering funcdetermina-tion. Subsequently we cal-culate the effective structure factor of the mixture which ac-count for the effective interactions induced by the presence of Laponite nanoplatelets between magnetic nanoparticles. The results show that on a local scale, the mixtures behave like a perfect gas of isolated magnetic nanoparticles. This is the case both for the concentrated and diluted phases. For the lower investigated values ofq, the structure factors present a slight increase which could be associated with the existence of effective attractive interactions between magnetic nanopar-ticles on a longer scale, induced by the presence of Laponite platelets, which lead to a progressive spatial exclusion of the two kinds of nanostructures. Our visual observations confirm our SAS investigations.
Acknowledgements
The authors wish to acknowledge the help from the staff at beamline D11A-SAXS at the Laboratorio Nacional de Luz Sincrotron (LNLS) during the SAXS experiments. This work was supported by the Research Council of Norway (RCN) through the NANOMAT and FRINAT Programs, and by the placePlaceNameBrazilian PlaceTypeagencies PlaceType-CAPES and CNPq.
[1] M. P. Pileni, ed. Nanocrystals Forming Mesoscopic Structures, Wiley-VCH, Weinheim, Germany, 2006 ISBN 3-527-31170-X, 330 pages.
[2] F. Bergaya, B.K.G. Theng, G. Lagaly, eds. Handbook of Clay
Science; Elsevier: London, 2006.
[3] C.Y. Matuo, F.A. Tourinho, M.H. Sousa, J. Depeyrot, A.M. Figueiredo Neto, Braz. J. Phys. 2002, 32, 458.
Aca-demic Press; StateplaceNew York; 1985.
[5] P.N. Pusey, J.P. Hansen, D. Levesque, J. Zinn-Justin, Liquids Freezing and Glass Transitions; North-Holland; Amsterdan; 1991.
[6] J.O. Fossum, E. Gudding, D.D.M. Fonseca, Y. Meheust, E. DiMasi, T. Gog, C. Venkataraman, Energy The International Journal, 2005, 3, 873-883.
[7] F.M. van der Kooij, H.N.W. Lekkerkerker, J. Phys. Chem. B, 1998, 102, 7829-7832
[8] D.M. Fonseca, Y. M´eheust, J.O. Fossum, K.D. Knudsen and K.P.S. Parmar, Phys. Rev.E, 2009, 79, 021402.
[9] G. Meriguet, E. Dubois, M. Jardat, A. Bourdon, G. Demouchy, V. Dupuis, B. Farago, R. Perzynski, P. Turq,J. Phys.: Condens. Matter 2006, 18, 2685-S2696
[10] E.N. de Azevedo, M. Engelsberg, J.O. Fossum, and R. E. de Souza, Langmuir 2007, 23, 5100.
[11] J.O. Fossum, Y. M´eheust, K.P.S. Parmar, K.D. Knudsen, K.J. M˚aly, D.M. Fonseca, Europhysics Letters, 2005, 74, 438-444. [12] Baoxiang Wang , Min Zhou , Zbigniew Rozynek and Jon Otto
Fossum, J.Mat.Chem. 2009, DOI:10.1039/b818502f.
[13] A. Mourchid, E. Lecolier,; H. van Damme, P. Levitz, Lang-muir. 1998, 14, 4718.
[14] F.A. Tourinho, J. Depeyrot, G.J. da Silva, M.C.L. Lara, ; Braz. J. of Physics, 1998, 28 (4): 413-427.
[15] F.L.O. Paula, ; R. Aquino, G.J. da Silva, J. Depeyrot, F.A. Tour-inho, J O. Fossum, K.D. Knudsen, J. Appl. Cryst. 2007, 40. 269.
[16] F.A. Tourinho, R. Franck, R. Massart, J. Mater. Sci. 1990, 25, 3249.
[17] A.F.C. Campos, F.A. Tourinho, G.J. da Silva, M.C.F.L. Lara, J. Depeyrot, Eur. Phys. J. E. 2001, 6, 29.
[18] E. Dubois, R. Perzynski, F. Bou, V. Cabuil, Langmuir. 2000, 16, 5617.
[19] J.P.C. Gabriel, C. Sanchez, P. Davidson, J. Phys. Chem. 1996, 100, 11139.
[20] H. van Olphen, An introduction to Clay Colloid Chemistry, 2nd ed. ,Krieger Publishing Company, StateplaceFlorida, 1991. [21] F. Cousin, V. Cabuil, P.Levitz, Langmuir. 2002, 18, 1466. [22] D.W. Thompson, T.J. Butterworth, Colloid Interface Sci.,
1992, 151, 236-243.
[23] Beaucage, G.; J. Appl. Cryst, 1995, 28, 717. [24] Schimidt, P. W.; J. Appl. Cryst, 1992, 15, 567.
[25] Debye, P.; Henderson, H. R.; Brumberger, H;.J. Appl. Phys, 1967, 28, 669.
[26] Koberstein, J. T.; Morra, B.; Stan, R. S.; J. Appl. Cryst, 1945, 13, 34.
[27] Fisher, M. E.; Burford, J. R.; Phys. Rev, 1967, 156, 593. [28] Beaucage, G.; J. Appl. Cryst, 1996, 29, 134.
[29] Beaucage, G.; Physical Review E, 2004, 70, 031401. [30] Beaucage, G.; J. Appl. Cryst, 2004, 37, 523.
[31] O. Glatter, Neutron, X-ray and light scattering, North Holland, Delta Series, Elsevier Science Publisher (1991).
[32] Lemaire, B.J., Panine, P., Gabriel, J.C.P., and Davidson, P.; Eu-rophysis. Lett., 2002, 59, 55.