ACPD
15, 23131–23172, 2015Mineral aerosol deposits on sea ice
M. L. Lamare et al.
Title Page
Abstract Introduction
Conclusions References
Tables Figures
◭ ◮
◭ ◮
Back Close
Full Screen / Esc
Printer-friendly Version Interactive Discussion
Discussion
P
a
per
|
Discussion
P
a
per
|
Discussion
P
a
per
|
Discussion
P
a
per
|
Atmos. Chem. Phys. Discuss., 15, 23131–23172, 2015 www.atmos-chem-phys-discuss.net/15/23131/2015/ doi:10.5194/acpd-15-23131-2015
© Author(s) 2015. CC Attribution 3.0 License.
This discussion paper is/has been under review for the journal Atmospheric Chemistry and Physics (ACP). Please refer to the corresponding final paper in ACP if available.
The impact of atmospheric mineral
aerosol deposition on the albedo of snow
and sea ice: are snow and sea ice optical
properties more important than mineral
aerosol optical properties?
M. L. Lamare1, J. Lee-Taylor2,3, and M. D. King1
1
Department of Earth Sciences, Royal Holloway University of London, Egham, Surrey, TW20 0EX, UK
2
National Center for Atmospheric Research, Boulder, Colorado, USA 3
Cooperative Institute for Research in Environmental Sciences, University of Colorado, Boulder, Colorado, USA
Received: 7 July 2015 – Accepted: 29 July 2015 – Published: 27 August 2015
Correspondence to: M. D. King (m.king@es.rhul.ac.uk)
ACPD
15, 23131–23172, 2015Mineral aerosol deposits on sea ice
M. L. Lamare et al.
Title Page
Abstract Introduction
Conclusions References
Tables Figures
◭ ◮
◭ ◮
Back Close
Full Screen / Esc
Printer-friendly Version Interactive Discussion
Discussion
P
a
per
|
Discussion
P
a
per
|
Discussion
P
a
per
|
Discussion
P
a
per
|
Abstract
Knowledge of the albedo of polar regions is crucial for understanding a range of cli-matic processes that have an impact on a global scale. Light absorbing impurities in atmospheric aerosols deposited on snow and sea ice by aeolian transport absorb solar radiation, reducing albedo. Here, the effects of five mineral aerosol deposits reducing
5
the albedo of polar snow and sea ice are considered. Calculations employing a cou-pled atmospheric and snow/sea ice radiative-transfer model (TUV-snow) show that the effects of mineral aerosol deposits is strongly dependent on the snow or sea ice type rather than the differences between the aerosol optical characteristics. The change in albedo between five different mineral aerosol deposits with refractive indices varying
10
by a factor of 2 reaches a maximum of 0.0788, whereas the difference between cold polar snow and melting sea ice is 0.8893 for the same mineral loading. Surprisingly, the thickness of a surface layer of snow or sea ice loaded with the same mass-ratio of mineral dust has little effect on albedo. On the contrary, multiple layers of mineral aerosols deposited during episodic events evenly distributed play a similar role in the
15
surface albedo of snow as a loading distributed throughout, even when the layers are further apart. The impact of mineral aerosol deposits is much larger on melting sea ice than on other types of snow and sea ice. Therefore, the higher input of shortwave radiation during the summer melt cycle associated with melting sea ice accelerates the melt process.
20
1 Introduction
The albedo of snow and sea ice has a large influence on the surface energy budget of polar regions, impacting the Earth’s climate system (e.g. Barry et al., 1993; Curry et al., 1995; Jacobson, 2004; Serreze and Barry, 2005). Shortwave radiation is a key factor in the radiative balance at high latitudes, influencing the large-scale dynamics
25
ACPD
15, 23131–23172, 2015Mineral aerosol deposits on sea ice
M. L. Lamare et al.
Title Page
Abstract Introduction
Conclusions References
Tables Figures
◭ ◮
◭ ◮
Back Close
Full Screen / Esc
Printer-friendly Version Interactive Discussion
Discussion
P
a
per
|
Discussion
P
a
per
|
Discussion
P
a
per
|
Discussion
P
a
per
|
the physical properties of snow and sea ice, morphology, surface roughness, thickness and light absorbing impurities (e.g. Perovich et al., 1998).
The albedo of sea ice is strongly wavelength dependent, owing to the light scattering and absorption of ice and brine. Previous studies have defined wavelength integrated and spectral albedos for a variety of snow and sea ice types (e.g. Langleben, 1969,
5
1971; Grenfell and Makyut, 1977; Grenfell and Perovich, 1984; Perovich et al., 1986; Buckley and Trodahl, 1987; Grenfell, 1991; Perovich, 1996; Wiscombe and Warren, 1980; Aoki et al., 1998; Hanesiak et al., 2001). Albedo is not only influenced by the physical structure of snow or sea ice but also by the amount and type of light absorbing impurities in the snow and sea ice (Warren and Wiscombe, 1980). Only small amounts
10
of light absorbing impurities are needed to achieve changes in snow or sea ice albedo (e.g. Warren and Wiscombe, 1980; Warren, 1984; Light et al., 1998; Doherty et al., 2010; Marks and King, 2014). Indeed, mass ratios of less than 1 ppm are sufficient to reduce the albedo by 5 to 15 % (Warren and Wiscombe, 1980). Light absorbing pollutants may be transported to the Arctic as fine particulate aerosols (Shaw, 1984).
15
Once in the Arctic, the particles are deposited onto snow or sea ice from the atmo-sphere by precipitation or dry deposition (Fischer et al., 2007; Doherty et al., 2010). Dust from arid and semi-arid regions is the most important source of mineral aerosols in the atmosphere (e.g. Ginoux et al., 2010). Although gravitational processes remove larger particles (Westphal et al., 1987), finer particles can be transported over great
20
distances and in some cases reach the Arctic (Prospero et al., 2002). The two main source areas of mineral dust deposited in the Arctic are Asia and North Africa (Pa-cyna and Ottar, 1989; Zdanowicz et al., 1998; Bory, 2003; VanCuren et al., 2012), with an estimated flux range between 1 and 21 µg cm−2yr−1 (Zdanowicz et al., 1998).
Af-ter mineral dust, volcanic ash is the second largest type of mineral aerosols found in
25
ACPD
15, 23131–23172, 2015Mineral aerosol deposits on sea ice
M. L. Lamare et al.
Title Page
Abstract Introduction
Conclusions References
Tables Figures
◭ ◮
◭ ◮
Back Close
Full Screen / Esc
Printer-friendly Version Interactive Discussion
Discussion
P
a
per
|
Discussion
P
a
per
|
Discussion
P
a
per
|
Discussion
P
a
per
|
shards and aged tephra (Ram and Gayley, 1991). However, the complex nature of volcanic eruptions makes ash deposition in the Arctic difficult to assess.
Soot and black carbon are known to absorb light strongly, thus reducing the albedo of snow and sea ice (e.g. Ch´ylek et al., 1983; Warren, 1984; Clarke and Noone, 1985; Warren and Clarke, 1990; Grenfell et al., 2002; Lee Taylor and Madronich, 2002;
Ja-5
cobson, 2004; Flanner et al., 2007; Doherty et al., 2010; Reay et al., 2012; Marks and King, 2013, 2014). Field observations and modelling simulations have also shown that increases in dust deposition to snow lead to radiative forcing that affects the energy balance of snow (Woo and Dubreuil, 1985; Aoki et al., 1998; Painter et al., 2007, 2012; Zhao et al., 2014; Yasunari et al., 2014). However, although anthropogenic deposits in
10
polar snow and ice have been well characterised, studies on the effects of natural min-eral aerosol deposits are scarcer. Warren and Wiscombe (1980) modelled the impact of desert dust in snow, using a compilation of optical properties present in the litera-ture. By varying particle size and concentration, they showed that the presence of dust reduces the albedo of natural snow at shorter wavelengths (300–800 nm), but the large
15
absorption of snow in the infrared region means that the albedo of snow is insensitive to mineral dust in this region. Carmagnola et al. (2013) considered the impact of dust as well as black carbon on albedo of snow, comparing modelled results with in-situ ob-servations. They pointed out the importance of dust impurities due to their higher con-centration within the snow compared with black carbon. However, Carmagnola et al.
20
(2013) measured small concentrations of impurities to fit their observational data set, and did not take in account a larger range of values. Although volcanic ash has a local and instantaneous impact on snow and sea ice, its effects have been described as sim-ilar to soot (Warren, 1982). Warren (1982) modelled the effect of increasing Mount St. Helens ash on snow albedo for diffuse incidence. The results show a significant
reduc-25
ACPD
15, 23131–23172, 2015Mineral aerosol deposits on sea ice
M. L. Lamare et al.
Title Page
Abstract Introduction
Conclusions References
Tables Figures
◭ ◮
◭ ◮
Back Close
Full Screen / Esc
Printer-friendly Version Interactive Discussion
Discussion
P
a
per
|
Discussion
P
a
per
|
Discussion
P
a
per
|
Discussion
P
a
per
|
ash, based on a two-stream radiative-transfer code (Toon et al., 1989). In the single-layer implementation of the model, SNICAR-online (Flanner et al., 2007), multiple snow types can be modelled by changing the snow grain radius. However, only a single type of volcanic ash derived from Patterson (1981) and combined mineral refractive indices as an approximation of mineral dust were used. Furthermore, SNICAR-online does not
5
allow for calculations in sea ice. Impurities in sea ice have been considered by Light et al. (1998), who used a four-stream discrete-ordinates radiative-transfer model to de-termine how particulates (Saharan dust and sediments) alter the optical properties of sea ice. The authors analysed the sensitivity of albedo in relation to depth and thick-ness of a single dust layer within the ice, showing the importance of vertical distribution
10
of deposited aerosols. Additionally, the effects of an increasing surface layer of snow containing a fixed mass of soot has been considered by Grenfell et al. (2002). How-ever the study was limited to a single snow type and only a constant mass of soot. To the knowledge of the authors of this paper, no studies on the effects on albedo of multiple mineral dust or volcanic ash layers deposited at varying intervals in snow
15
have been published. Studying the layering of mineral aerosol deposits in snow or sea ice enables to take in account the episodic nature of dust and volcanic ash deposition events. Moreover, the comparison of multiple sources of mineral aerosol deposits on multiple different types of snow and sea ice in an Arctic environment has not been investigated. Although Woo and Dubreuil (1985) proposed a characterisation of the
re-20
lationship between dust content and Arctic snow albedo, the range of snow types and dusts was limited. Overall the understanding of the impact of mineral aerosol deposits on the albedo in the Arctic is hampered by the lack of comprehensive studies on the role of the snow or sea ice optical properties in relation to the optical properties of the mineral aerosol deposits. The work of Marks and King (2014) on the effects of the snow
25
ACPD
15, 23131–23172, 2015Mineral aerosol deposits on sea ice
M. L. Lamare et al.
Title Page
Abstract Introduction
Conclusions References
Tables Figures
◭ ◮
◭ ◮
Back Close
Full Screen / Esc
Printer-friendly Version Interactive Discussion
Discussion
P
a
per
|
Discussion
P
a
per
|
Discussion
P
a
per
|
Discussion
P
a
per
|
or sea ice compared to the type of mineral dust or volcanic ash when evaluating the impact of mineral aerosol deposits on albedo. No studies investigating the effects of light absorbing impurities on the albedo of snow and ice have examined this question.
In this work an atmospheric and snow/sea ice radiative-transfer model (TUV-snow) was used to investigate the effects of mineral aerosol deposits on snow and sea ice.
5
The main purpose was to evaluate the impact of different mineral dusts and volcanic ashes on albedo. To do so, different mass-ratios of a selection of five different mineral aerosol deposits in multiple snow and sea ice types were modelled. The thickness of a single surface layer and the vertical distribution of multiple layers loaded with mineral deposits were then varied to explore the effects of layering.
10
2 Method
The description of the method is split into three sections: the radiative-transfer model is described, followed by a detailed section on the calculation of mineral absorption cross-sections and a final section describing the modelling experiment performed.
2.1 Radiative-transfer model
15
The radiative-transfer calculations of the penetration and reflection of light into snow and sea ice containing mineral aerosol deposits were performed using the Tropospheric Ultraviolet and Visible Radiation Model (TUV-snow), using the discrete-ordinates “DIS-ORT” algorithm (Stamnes et al., 1988), as described by Lee Taylor and Madronich (2002). The model is a coupled atmospheric and snow/sea ice model that allows
cal-20
culation of radiative-transfer parameters in snow and sea ice from the top of the atmo-sphere to the surface of the Earth and into a layer of snow or sea ice.
The model parameters simulating different types of snow and sea ice are controlled by an asymmetry factor g, a wavelength independent scattering cross-section,σscatt, a wavelength dependent absorption cross-section,σiceand the sea ice or snow density
ACPD
15, 23131–23172, 2015Mineral aerosol deposits on sea ice
M. L. Lamare et al.
Title Page
Abstract Introduction
Conclusions References
Tables Figures
◭ ◮
◭ ◮
Back Close
Full Screen / Esc
Printer-friendly Version Interactive Discussion
Discussion
P
a
per
|
Discussion
P
a
per
|
Discussion
P
a
per
|
Discussion
P
a
per
|
(Lee Taylor and Madronich, 2002; France et al., 2011a, b; Reay et al., 2012; Marks and King, 2013, 2014).
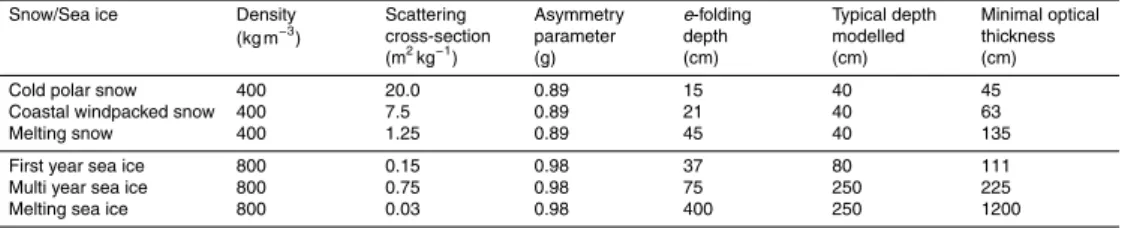
In this study, three types of sea ice were used: first year ice, multi year ice and melting ice, as well as three types of snow: cold polar snow, coastal wind packed snow and melting snow. The optical and physical parameters of the selected snows and sea
5
ice are based on field studies and summarised in Table 1. A detailed description and justification of these values can be found in Marks and King (2014).
The wavelength independent albedo of the surface under the snow and sea ice layer was fixed to 0.1 to represent seawater or soil. Irradiance reflectance at the surface was calculated to approximate albedo, represented by Eq.(1):
10
A=Eu
Ed, (1)
where Eu is the upwelling plane irradiance and Ed is the downwelling plane irradiance. A layer of cumulus cloud was added to the model at an altitude of 1 km to provide diffuse illumination of the snow or sea ice surface and remove the solar zenith angle dependance. The cloud asymmetry factor g, was set to 0.85, the single scattering
15
albedo was set to 0.9999 and the optical depth was set to 32. The atmosphere was added with an ozone column of 300 Dobsons containing no aerosols. The distance between the Earth and the Sun was fixed to 1 AU.
The modelled wavelength dependent albedo was produced over a spectrum ranging from 350 to 800 nm with a 1 nm interval.
20
2.2 Optical properties of mineral dust and volcanic ash
The snow and sea ice were modelled as media which are highly scattering and weakly absorbing of photons. The light-absorbing impurities were modelled as absorbers only and it was assumed that the ice matrix provides all the scattering. The total absorption in sea ice is:
25
ACPD
15, 23131–23172, 2015Mineral aerosol deposits on sea ice
M. L. Lamare et al.
Title Page
Abstract Introduction
Conclusions References
Tables Figures
◭ ◮
◭ ◮
Back Close
Full Screen / Esc
Printer-friendly Version Interactive Discussion
Discussion
P
a
per
|
Discussion
P
a
per
|
Discussion
P
a
per
|
Discussion
P
a
per
|
whereσice(λ) is the wavelength dependant absorption by sea ice or snow and σmn(λ) is the wavelength dependant absorption by mineral aerosols. The optical constants of ice were obtained from the work of Warren and Brandt (2008). The calculation of the absorption cross-section of the mineral aerosol deposits was calculated based on the Mie theory (Bohren and Huffman, 2008) in the Mieplot program (Laven, 2006) using
5
the BHMIE computation code (Bohren and Huffman, 1983). The resulting absorption cross-sections of the mineral aerosol deposits were used in the radiative transfer model described in Sect. 2.1.
To calculate the absorption spectra of representative mineral aerosols from a Mie Calculation, values of the imaginary refractive index, density, size and size distribution
10
are needed. The values of the imaginary refractive index for different mineral dusts and ashes vary significantly with wavelength and the medium’s mineral composition (Tegen and Fung, 1994; Sokolik and Toon, 2007). Data on the typical wavelength dependant refractive index of mineral aerosols is scarce in the literature. A selection of three dif-ferent volcanic ashes and two dusts was chosen from the literature to represent the
15
variety of mineral aerosols deposited in the Arctic. The work of VanCuren et al. (2012), was used for Asian dust, Saharan dust, fresh volcanic tephra and aged volcanic dust plumes as the four characteristic sources of aerosols deposited at Summit, Greenland. A representative value of the imaginary component of the refractive index of Saharan dust was calculated as the average of eight measurements of the imaginary refractive
20
index of airborne Saharan aerosols from eight locations in the Atlantic ocean (Patterson and Gillette, 1977).
The refractive index of a characteristic central Asian dust was taken from Sokolik et al. (1993). The dust samples that Sokolik et al. (1993) collected in Tadzhikistan, are a combination of airborne dust aerosols and surface dust. The imaginary refractive
25
ACPD
15, 23131–23172, 2015Mineral aerosol deposits on sea ice
M. L. Lamare et al.
Title Page
Abstract Introduction
Conclusions References
Tables Figures
◭ ◮
◭ ◮
Back Close
Full Screen / Esc
Printer-friendly Version Interactive Discussion
Discussion
P
a
per
|
Discussion
P
a
per
|
Discussion
P
a
per
|
Discussion
P
a
per
|
(1981). The first sample, collected in Boulder, Colorado corresponds to the first pulse of the eruption and is characterised by a dark grey colour and a high absorption coef-ficient in the visible wavelengths. The second sample collected in Cheney, Washington has a pale grey appearance and a lower absorption coefficient by approximately a fac-tor of 2 (Patterson, 1981). Direct measurements of volcanic ash optical properties are
5
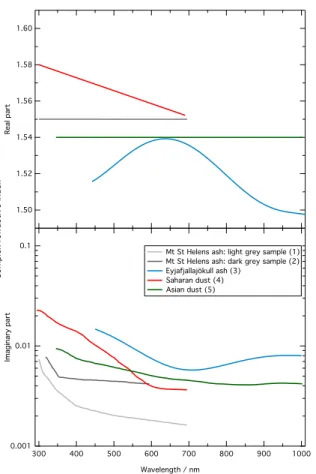
scarce. Therefore an estimate of the complex refractive index of Eyjafjallajökull ash calculated by Derimian et al. (2012) was used. The weighted combination of refractive indices of each aerosol component presented a good fit with AERONET data (Derim-ian et al., 2012) and was more realistic than the mineral dust data of Balkanski et al. (2007) that is more widely used (Johnson et al., 2012; Turnbull et al., 2012). The values
10
of the complex refractive index of the aerosols as a function of wavelength considered in the study presented here are in Fig. 1.
For the calculation of the extinction coefficient of light absorbing impurities, the min-eral aerosol deposits were assumed to be spherical. Based on observations of atmo-spheric dust deposition in snow on the Penny ice cap on Baffin Island by
Zdanow-15
icz et al. (1998), the size distribution of the aerosols used in the calculations pre-sented here was fixed to a log normal distribution peaking at a diameter of 2.3 µm with a standard deviation of 2.1 µm. The size distribution corresponds to a mean value for long-range transported dusts and is similar to those measured in Greenland (Ko-erner, 1977). Particle densities of 2600 kg m−3 for Saharan dust (Hess et al., 1998),
20
2500 kg m−3 for Asian dust (Fratini et al., 2007), 2300 kg m−3 for Eyjafjallajökull ash
(Johnson et al., 2012) and 1400 kg m−3 for Mt St Helens ash (Sarna-Wojcicki et al.,
1981) were assumed in the calculation of absorption cross-sections. The refractive in-dex of air was used as a surrounding medium for the Mie calculations in snow whereas values for pure ice (Warren and Brandt, 2008) were used for sea ice.
ACPD
15, 23131–23172, 2015Mineral aerosol deposits on sea ice
M. L. Lamare et al.
Title Page
Abstract Introduction
Conclusions References
Tables Figures
◭ ◮
◭ ◮
Back Close
Full Screen / Esc
Printer-friendly Version Interactive Discussion
Discussion
P
a
per
|
Discussion
P
a
per
|
Discussion
P
a
per
|
Discussion
P
a
per
|
2.3 Calculation of albedo on snow and sea ice with different mineral
loading schemes
Three types of modelling experiment were performed. Initially, the surface albedo of snow and sea ice was calculated owing to increasing mineral dust mass-ratios uni-formly distributed in the snow and sea ice. To allow a fair comparison between the
5
snowpack or the sea ice and the different dusts, the snow and sea ice was defined as semi-infinite, i.e. the thickness of the medium is large enough that the underlying layer does not affect the results. Secondly, the semi-infinite thickness was replaced by snow-packs and sea ice types with varying realistic thicknesses. Thirdly, the mineral aerosol deposits were constrained to layers in the snow and sea ice, as opposed to a uniform
10
distribution. The third case reflects the episodic nature of mineral deposition.
Initially, the surface albedo of the different snow and sea ice types was calculated between 350 and 800 nm for an increasing mass-ratio of mineral aerosol deposits. Based on the properties of the snow and sea ice used in this study, a depth of 1.5 m for snow and 15 m for ice were found sufficient to achieve a semi-infinite medium.
15
Assuming the mineral aerosol deposits were distributed evenly through the medium, their mass-ratio was varied between 10 and 10 000 ng g−1
. Typical mass-ratio values on Baffin Island range from 78.2 to 193.2 ng g−1(Zdanowicz et al., 1998), however much
higher values can be found on glaciers close to volcanoes or on dust storm paths (Thorsteinsson et al., 2012; Schwikowski et al., 1995; Dong et al., 2014). Therefore
20
a large range of values was included for completeness.
In order to determine the impact of different types of mineral aerosol deposits (with different absorption cross-sections), a semi-infinite snow and sea ice cover with a uni-form mass-ratio of 100 ng g−1for each mineral sample was modelled.
In a second step, representative thicknesses for each type of snow and ice were
25
ACPD
15, 23131–23172, 2015Mineral aerosol deposits on sea ice
M. L. Lamare et al.
Title Page
Abstract Introduction
Conclusions References
Tables Figures
◭ ◮
◭ ◮
Back Close
Full Screen / Esc
Printer-friendly Version Interactive Discussion
Discussion
P
a
per
|
Discussion
P
a
per
|
Discussion
P
a
per
|
Discussion
P
a
per
|
Laxon et al., 2003; Weeks, 2010) and 80 cm for first year sea ice (Weeks, 2010) were chosen. The albedo of the layer under the sea ice or snow was set to 0.1 to simu-late a strongly absorbing medium similar to water or soil. Albedo, as a function of an increasing mass-ratio of Asian mineral dust, was calculated (discussed in Sect. 3.2). By selecting realistic thicknesses of snow and sea ice, a comparison of the impact of
5
mineral dust on different types of snow and sea ice was performed.
In a third step, a surface layer of 1 cm of snow or sea ice containing 100 ng g−1 of
Asian dust was placed on the surface of each snow and sea ice type. The underlying snow or sea ice was modelled as a clean medium containing no black carbon or min-eral aerosol deposits. The thickness of this top layer was increased to 10 cm in 1 cm
10
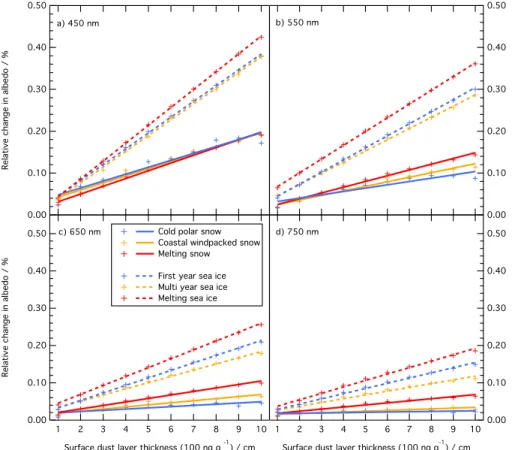
steps. The variation in albedo was represented as a percentage of change relative to a pure medium at four different wavelengths (450, 550, 650 and 750 nm). The effects of multiple layers in snow were taken in account, simulating dust deposition by multiple storm events between snow falls. For three different 40 cm deep snowpacks, 100 ng g−1
of mineral deposits previously placed throughout the pack were concentrated to 5 cm
15
layers of 800 ng g−1. The distance between the five layers was increased from 1 to
8 cm with a 1 cm interval in eight different model combinations, alternating poisoned and clean snow. The albedo of the layered snow packs was compared to a clean snow pack containing 1 ng g−1 of mineral dust. Furthermore, the importance of buried
lay-ers containing mineral aerosol deposits was investigated by comparing multiple laylay-ers
20
each with a dust mass-ratio of 800 ng g−1 to one surface layer of 1 cm containing the
same mass-ratio of 800 ng g−1.
Finally, the albedo of three semi-infinite snow types (cold polar snow, coastal wind packed snow and melting snow) with an increasing mass-ratio of Asian dust and light coloured Mt St Helens volcanic ash, obtained from the TUV-snow model was compared
25
com-ACPD
15, 23131–23172, 2015Mineral aerosol deposits on sea ice
M. L. Lamare et al.
Title Page
Abstract Introduction
Conclusions References
Tables Figures
◭ ◮
◭ ◮
Back Close
Full Screen / Esc
Printer-friendly Version Interactive Discussion
Discussion
P
a
per
|
Discussion
P
a
per
|
Discussion
P
a
per
|
Discussion
P
a
per
|
pared to the cold polar snow modelled in this study, 220 µm for coastal wind packed snow and 1400 µm for melting snow. In a second step, increasing concentrations of dust and volcanic ash were added to SNICAR-online, and the results were compared with TUV-snow.
3 Results
5
The results are presented in three sections: the effect of different types of mineral aerosol deposits on albedo of polar snow and sea ice, the variation of albedo with increasing loading of mineral aerosol deposits and the effect of layers of mineral aerosol deposits in snow.
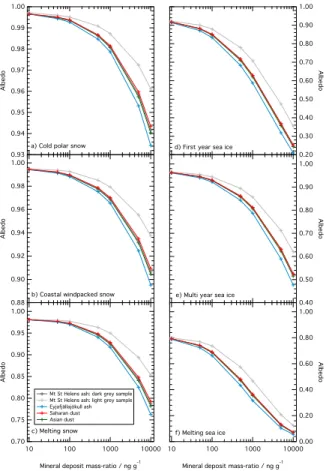
3.1 The effect of different mineral aerosol deposit types on albedo
10
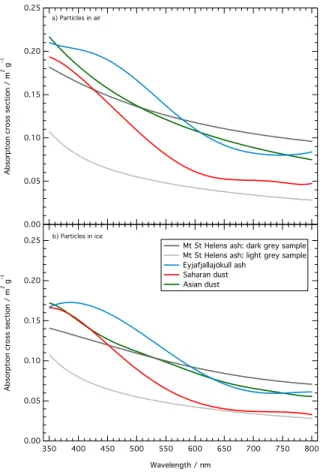
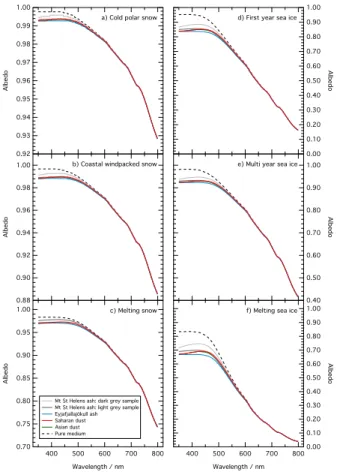
The absorption cross-sections of the different mineral aerosol deposits have a similar pattern with wavelength, but differ by a maximum of 77 %, as seen in Fig. 2, where the wavelength dependant absorption cross-sections of different mineral aerosol deposits are plotted. The variation in the values of absorption cross-section has little effect on the albedo for most snow or ice types. As Fig. 3 indicates, variation in albedo between
15
the different mineral dusts and volcanic ashes does not exceed 0.0080 for snow and 0.0788 for sea ice. For semi-infinite snow or sea ice with a mass-ratio of 100 ng g−1,
the variation in albedo between the strongly light absorbing Eyjafjallajökull ash and the less light absorbing Mt. St. Helens light grey ash sample is 0.0024 for cold po-lar snow at 450 nm; a wavelength where the difference between mineral deposits is
20
the largest. For comparison, the difference in albedo at 450 nm between a cold polar snowpack containing 1 ng g−1 of Mt. St. Helens light grey ash and 100 ng g−1 of the
same ash is 0.0036. Different mineral aerosol deposits have a larger effect on melting sea ice, where the difference in albedo between Eyjafjallajökull ash and Mt. St. Helens light grey ash reaches 0.0749 at 450 nm. When increasing the mass-ratio of mineral
ACPD
15, 23131–23172, 2015Mineral aerosol deposits on sea ice
M. L. Lamare et al.
Title Page
Abstract Introduction
Conclusions References
Tables Figures
◭ ◮
◭ ◮
Back Close
Full Screen / Esc
Printer-friendly Version Interactive Discussion
Discussion
P
a
per
|
Discussion
P
a
per
|
Discussion
P
a
per
|
Discussion
P
a
per
|
aerosol deposits to larger values in the snow or sea ice, the importance of their opti-cal properties becomes more obvious. The variation in albedo between 10 000 ng g−1
of Eyjafjallajökull ash and Mt. St. Helens light grey ash reaches 0.0268 in cold polar snow (smallest change) and 0.1444 in first year sea ice (largest change) as shown in Fig. 4, where the albedo of different snow and sea ice types is shown for an increasing
5
mass-ratio of mineral aerosol deposits.
The variation in the albedo of snow and sea ice is less sensitive to the type of mineral aerosol deposit and its optical properties than to the properties of the snow or sea ice themselves (Figs. 3 and 4). Indeed, where a maximum variation of 0.0788 is observed from a mineral deposit to an other, the variation between the albedo of melting sea ice
10
and cold polar snow for the same mass-ratio of mineral dust reaches 0.8893. Thus, an important result of this work is that when considering the darkening of snow or sea ice, it may be more important to understand the optical properties of the snow or sea ice than the optical properties of the mineral aerosol deposits. Therefore, when observing the impact of an increasing mineral dust mass-ratio on realistic thicknesses (Fig. 6), of
15
surface layers (Fig. 8) and of multiple layers (Fig. 9) a single type of mineral deposit was picked. Asian dust was selected, being the most commonly found mineral dust in the Arctic (Zdanowicz et al., 1998; VanCuren et al., 2012) but also being representative of the range of mineral aerosol deposits (Figs. 1 and 2).
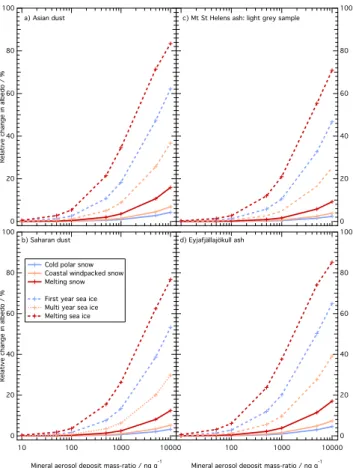
3.2 The effects of increasing mineral dust mass-ratios in snow and
20
sea ice on albedo
Figure 5 shows the change in albedo at 550 nm of an increasing mass-ratio of the two most common types of mineral dust found in the Arctic for three different types of sea ice (first year, multi year and melting sea ice) and snow (cold polar, coastal windpacked and melting snow) relative to a clean medium. The results presented here, as well as
25
ACPD
15, 23131–23172, 2015Mineral aerosol deposits on sea ice
M. L. Lamare et al.
Title Page
Abstract Introduction
Conclusions References
Tables Figures
◭ ◮
◭ ◮
Back Close
Full Screen / Esc
Printer-friendly Version Interactive Discussion
Discussion
P
a
per
|
Discussion
P
a
per
|
Discussion
P
a
per
|
Discussion
P
a
per
|
deposits and albedo calculated with a snow or sea ice containing mineral aerosol de-posits at a mass-ratio of 1 ng g−1. Similarly to black carbon (Marks and King, 2014),
mineral dust deposits have a larger impact on the albedo of sea ice than snow, with melting sea ice being the most sensitive medium. The relative change in albedo as a function of mineral dust is 87 % larger for melting sea ice than a cold polar snowpack
5
for mass-ratio of 10 000 ng g−1
of mineral dust (Fig. 5). However, such mass-ratios of dust are rare in polar regions (Lawrence and Neff, 2009). Such large mass-ratios are included here to allow for a wide range of applications (i.e. study areas close to aerosol sources, astrobiology and general cases). A realistic loading is below a mass-ratio of 100 ng g−1 (Zdanowicz et al., 1998), where mineral aerosol deposits only change
10
albedo by up to 0.03. The decrease of the albedo of melting sea ice with 100 ng g−1of
Asian dust relative to 1 ng g−1 is 5.35 and only 0.12 % for cold polar snow. For smaller
mass-ratios, the effects of mineral aerosol deposits are negligible in snow and small in sea ice: 10 ng g−1 of Asian dust decreases the albedo of cold polar snow by 0.002 %
and melting sea ice by 0.52 % relative to a mass-ratio of 1 ng g−1.
15
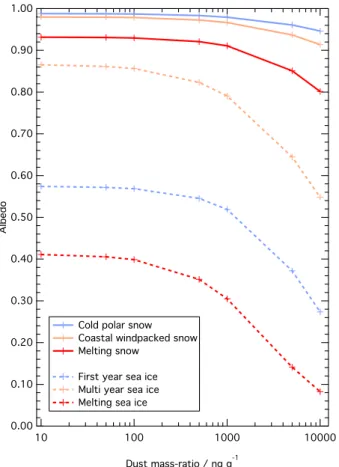
Figure 6 displays decreasing albedo with increasing mass loading of Asian mineral dust at a wavelength of 550 nm with realistic thicknesses of snow and sea ice (Table 1). The realistic thickness of snow and sea ice prevents the snow and sea ice types (except multi year sea ice), from being optically thick. Using realistic values, the absorbing medium under the snowpack or sea ice affects the value of surface albedo. Table 1
20
highlights typical values for the different snow or sea ice types along with theire-folding depths. The snow and sea ice packs were considered to become optically thick at 3 e-folding depths, where over 95 % of incident sunlight is attenuated (France et al., 2011a). The decrease in albedo between a clean snow or sea ice and a snow or sea ice containing the same loading of Asian dust is smaller for realistic depths than for
25
semi-infinite packs. With a concentration of 100 ng g−1 of Asian dust, the variation is
smaller by a factor of ∼0.97 for a realistic thickness than a semi-infinite cold polar
snowpack,∼1.18 for coastal wind packed snow,∼1.91 for melting snow,∼3.05 for first
ACPD
15, 23131–23172, 2015Mineral aerosol deposits on sea ice
M. L. Lamare et al.
Title Page
Abstract Introduction
Conclusions References
Tables Figures
◭ ◮
◭ ◮
Back Close
Full Screen / Esc
Printer-friendly Version Interactive Discussion
Discussion
P
a
per
|
Discussion
P
a
per
|
Discussion
P
a
per
|
Discussion
P
a
per
|
absorbing layer under the snow or sea ice (albedo of 0.1) and a thickness smaller than the minimal optical thickness for the realistic snow and sea ice layers explain a reduction in albedo and smaller variations due to mineral aerosol deposits. Figure 6 also highlights the difference in albedo decrease between realistic snow and sea ice with the same mass-ratio and category of mineral aerosol deposit. Within the snow,
5
reduction in albedo is greater for melting snow, where 1000 ng g−1 of mineral aerosol
deposits causes a 2.25 % decrease relative to a clean snow pack, than for cold polar snow, where the same loading causes a 0.89 % decrease. Moreover, warmer sea ice is more sensitive than cold first year sea ice, as a mass-ratio of 1000 ng g−1of mineral
aerosol deposits causes a 26.05 % reduction in albedo relative to clean ice for melting
10
sea ice and 9.71 % for first year sea ice. The results presented in this section suggest that the type of snow or sea ice are more important to consider than the type of mineral aerosol deposits when studying the impact of atmospheric mineral aerosol deposition on the albedo of snow and sea ice.
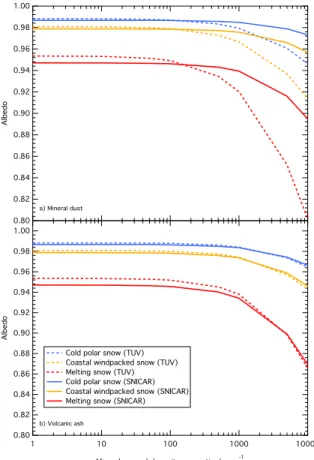
When comparing the results from the modelling in this study with the output from
15
SNICAR-online (Flanner et al., 2007), a very good agreement for the albedo of an in-creasing mass-ratio of volcanic ash can be observed (Fig. 7). The mean difference between the models (350 to 800 nm) is 0.0013 for cold polar snow, 0.0019 for coastal wind packed snow and 0.0050 for melting snow. With mineral dust, the models present a good agreement until 100 ng g−1. For larger mass-ratios, TUV-snow predicts a
sig-20
nificantly lower albedo than SNICAR-online. The mean difference between the models when comparing mineral dusts is 0.0065 for cold polar snow, 0.010 for coastal wind packed snow and 0.023 for melting snow.
3.3 The effect of mineral dust layers in snow and sea ice
Owing to the episodic nature of dust storms and volcanic eruptions, mineral aerosol
25
ACPD
15, 23131–23172, 2015Mineral aerosol deposits on sea ice
M. L. Lamare et al.
Title Page
Abstract Introduction
Conclusions References
Tables Figures
◭ ◮
◭ ◮
Back Close
Full Screen / Esc
Printer-friendly Version Interactive Discussion
Discussion
P
a
per
|
Discussion
P
a
per
|
Discussion
P
a
per
|
Discussion
P
a
per
|
a spacing varying from 1 to 8 cm. Figure 8 demonstrates the relative change in albedo for an increasing mass-ratio of Asian dust in an increasing surface layer in snow and sea ice. The change in albedo is small: 10 cm of 100 ng g−1 of dust on melting sea ice
induces a change of 0.47 % at 450 nm, 0.36 % at 550 nm, 0.26 % at 650 nm and 0.19 % at 750 nm relative to a clean sea ice. Although the mass-ratio of mineral dust observed
5
in the Arctic is much larger than black carbon, the impact of the former on snow and sea ice is less important. Marks and King (2014) show that a surface layer of 5 cm of evenly distributed black carbon with a mass-ratio of 100 ng g−1
causes a reduction of albedo of 1.3 % at 450 nm for first year sea ice. The same layer, containing 100 ng g−1
of Asian dust only reduces albedo by 0.21 % at 450 nm (Fig. 8).
10
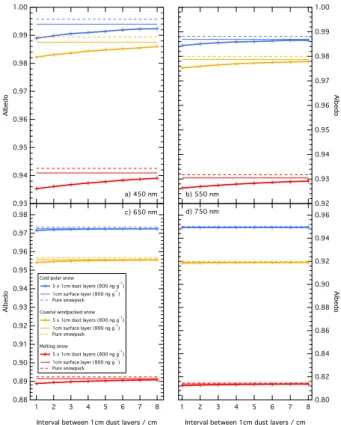
Figure 9 shows the effect of multiple layers evenly buried in a snow pack. Five layers of 1 cm containing 800 ng g−1 of Asian dust were placed in di
fferent 40 cm thick snow packs (polar, coastal wind packed and melting snow). The distance between the layers was increased evenly from 1 to 8 cm. Surface albedo was compared with a single 1 cm surface layer containing 800 ng g−1 of Asian dust and a clean snow pack. Figure 9
15
shows that multiple layers of mineral dust play an important part in the reduction of albedo, even when placed wide apart in the snowpack. Indeed, 1 cm layers containing mineral dust placed 8 cm apart continue to reduce albedo without the overlying snow reducing the contribution to zero. When comparing the results from Figs. 9 and 6, the difference in albedo between a uniform 40 cm snowpack containing 100 ng g−1 of
20
Asian dust and the same mass of dust concentrated into 5 layers of 800 ng g−1with an
1 cm interval is small: 0.0025 for polar snow and 0.0031 for coastal wind packed and melting snow at 550 nm. A snowpack containing multiple layers of more concentrated dust with a small spacing is thus likely to cause a similar reduction in albedo at shorter wavelengths than a snowpack where the dust is uniformly distributed.
25
As seen in the previous results, the effects of mineral dust are more important at shorter wavelengths than in the near infrared. At 550 nm, 5 layers at 1 cm interval containing 800 ng g−1of mineral dust in cold polar snow cause a reduction in albedo of
ACPD
15, 23131–23172, 2015Mineral aerosol deposits on sea ice
M. L. Lamare et al.
Title Page
Abstract Introduction
Conclusions References
Tables Figures
◭ ◮
◭ ◮
Back Close
Full Screen / Esc
Printer-friendly Version Interactive Discussion
Discussion
P
a
per
|
Discussion
P
a
per
|
Discussion
P
a
per
|
Discussion
P
a
per
|
4 Discussion
The following discussion provides explanations of the results presented in Sect. 3 and a discussion on the limitations of this study.
4.1 Model uncertainties
4.1.1 Mie calculation
5
The composition of light absorbing impurities in polar snow and sea ice has been well characterised (e.g. Flanner et al., 2012; Kumai, 1977; Thompson, 1977; Warren, 1982; Zdanowicz et al., 1998). However, values of the optical properties of dust and vol-canic ash aerosols remain scarce. Work has been carried out to measure the phase function (e.g. Dubovik et al., 2002a) scattering matrices (Munoz, 2004) and
bright-10
ness temperature (Newman et al., 2012) of mineral aerosols, but, to the knowledge of the authors of this paper, comprehensive results of wavelength dependant complex refractive index measurements other than the data presented in this paper are lack-ing. When presented, refractive index data generally refers to mineral equivalents or weighted combinations of mineral values (Flanner et al., 2007; Derimian et al., 2012).
15
Consequently, the study was limited to a reduced number of sources when choosing appropriate mineral aerosol optical properties presented here as model input param-eters. However, variation between the type of mineral aerosol deposits has a limited impact on albedo relative to the effect of variation in the type of snow and sea ice, as discussed in Sect. 4.2. An array of mineral dusts and ashes was selected from
plausi-20
ble geographical sources contributing to the Arctic at present (Pacyna and Ottar, 1989; Zdanowicz et al., 1998; Bory, 2003; VanCuren et al., 2012). More importantly, the se-lection covers a range of complex refractive indices that can be applied to different study areas. The absorption cross-sections of the selection of mineral aerosols used in this study vary by a factor of∼2, allowing the model to be adapted to different areas 25
ACPD
15, 23131–23172, 2015Mineral aerosol deposits on sea ice
M. L. Lamare et al.
Title Page
Abstract Introduction
Conclusions References
Tables Figures
◭ ◮
◭ ◮
Back Close
Full Screen / Esc
Printer-friendly Version Interactive Discussion
Discussion
P
a
per
|
Discussion
P
a
per
|
Discussion
P
a
per
|
Discussion
P
a
per
|
In order to calculate the absorption spectrum of the mineral aerosol deposits, Mie scattering theory was used, assuming that the particles were spheres. Dust particles are known to be non-spherical, thus affecting differently the light scattering properties (Mishchenko et al., 1995, 1999; Dubovik et al., 2002b). Studies have focused on non-spherical particles in Mie theory (e.g. Purcell and Pennypacker, 1973), but due to the
5
complexity of the interaction of light with multiple shapes, its modelling is very challeng-ing (Nousiainen, 2009), and approximations have to be made. However, it is possible to calculate a relative change in absorption cross-section if a spherical Mie scattering particle is morphed into a needle or a disk. Bohren and Huffman (1983) proposed three equations for extreme forms of ellipsoids (spheres, needles and disks) allowing for the
10
representation of the shapes found in mineral aerosols. Needles may correspond to glass shards found in volcanic ash (Johnson et al., 2012), and dust particles take on a variety of shapes amongst which flat disks can be observed (Mishra and Tripathi, 2008). At 550 nm the absorption cross-section for the volcanic ash may increase by a factor of∼1.20 for needles and ∼1.53 for disks. The absorption cross-section for 15
the dusts may increase by a factor of∼1.21 for needles and ∼1.56 for disks. Whilst
the shape of needles, disks and spheres is probably too limited to describe mineral particles, consideration of the particle morphology allows the magnitude of the effect of morphology to be estimated. The calculation is dependant on the refractive index of particles but the change in shape would be expected to cause a larger change to
20
the absorption cross-section than the small difference in refractive index between the particles. The effect being multiplicative, the percentage of change in values can be applied to the mass-ratio values in the relative change in albedo (see Figs. 5 and 6) to correct for shape effects. The variations related to particle shape were not considered in this study, but a typical uncertainty is a factor of∼1.5.
25
ACPD
15, 23131–23172, 2015Mineral aerosol deposits on sea ice
M. L. Lamare et al.
Title Page
Abstract Introduction
Conclusions References
Tables Figures
◭ ◮
◭ ◮
Back Close
Full Screen / Esc
Printer-friendly Version Interactive Discussion
Discussion
P
a
per
|
Discussion
P
a
per
|
Discussion
P
a
per
|
Discussion
P
a
per
|
(Ch´ylek et al., 1983). The refractive index of air was used as a surrounding medium for particles in snow, considering that the impurities are external to the snow. In the case of sea ice, the values of pure ice from Warren and Brandt (2008) were used. The distribution of mineral contaminants in sea ice varies with depth and temperature, making it difficult to characterise their surrounding medium. After comparing
cross-5
section absorption values of dust in brine (Maykut and Light, 1995) and in pure ice, the difference was considered to be negligible, with a relative change of 0.1 % between the two.
4.1.2 Snowpack or sea ice thickness
When modelling the albedo of semi-infinite and realistic thicknesses of snow and sea
10
ice, the mineral dust was assumed to be uniformly distributed throughout the snow and sea ice. Such an assumption does not account for the layering effect observed in field measurements, but represents a mean value, easily applicable to a vast spatial extent. Layering effects were studied in Sect. 3.3 by looking at a surface layer and multiple buried layers. Although the configurations used here do not cover all the possibilities
15
found in the field, this study presents an overview of an effect previously unquantified and can be adapted to particular scenarios.
Snow or sea ice thickness is an essential parameter in the calculation of albedo. It is also difficult to quantify, due to temporal and spatial heterogeneity. Sea ice has vary-ing surface conditions, associated with depths rangvary-ing from 0 to over 10 m at pressure
20
ridges (Perovich, 1996). A detailed study would require individual cases with diff er-ent layers of sea ice and associated thicknesses. Where snow is typically sufficiently optically thick to produce general results, this is not the case for sea ice. Therefore, a range of sea ice types (first year sea ice, multi year sea ice and melting sea ice) and their associated depths was produced in this study. To calculate the relative change
25
com-ACPD
15, 23131–23172, 2015Mineral aerosol deposits on sea ice
M. L. Lamare et al.
Title Page
Abstract Introduction
Conclusions References
Tables Figures
◭ ◮
◭ ◮
Back Close
Full Screen / Esc
Printer-friendly Version Interactive Discussion
Discussion
P
a
per
|
Discussion
P
a
per
|
Discussion
P
a
per
|
Discussion
P
a
per
|
parison of the effects of mineral aerosol deposits on the albedo of each type of snow and sea ice. When accounting for realistic thicknesses in Fig. 6, typical depths found in the literature were picked. The selection of depths used in this study are considered to be representative and the results can be calculated for any given thickness using the method presented in Sect. 2.
5
The modelling presented here has several limitations. In this study, the combination of different types of absorbing impurities that can be found in the Arctic, such as soot, HULIS, or black carbon (Marks and King, 2013; Warren and Clarke, 1990) was not considered. However, Marks and King (2014) have modelled the effects of black carbon in similar types of snow and sea ice to the ones used here and the effects of soot have
10
been considered by Warren and Clarke (1990). Organic debris and algae, that have an effect on albedo (Grenfell, 1991) and may have been observed in field data (France et al., 2012), were not examined in this study.
4.1.3 Asymmetry parameter
The asymmetry parameter,g, was one of the parameters used to describe the snow
15
and sea ice. A fixed value of 0.95 for sea ice and 0.89 for snow were determined, based on the values presented by France et al. (2012) and Marks and King (2013). In the two papers,gwas held constant andσscatt andσabs+ varied, based on the methods of Lee Taylor and Madronich (2002). Libois et al. (2014) advocate the use of a value of g=0.86 when modelling snow. To gauge the effects of the value of g on albedo,
20
the scattering and absorption coefficients of the cold polar snow and the melting snow were recalculated from albedo ande-folding depth data, using the optical properties in Table 1. The calculations for the effects of Saharan dust were then repeated with the value ofgrecommended by Libois et al. (2014). The difference in albedo between
g=0.89 and g=0.86 was of 0.006 % for a cold polar snowpack containing 10 ng g−1
25
of Saharan dust, 0.009 % for 100 ng g−1 and 0.18 % for 10 000 ng g−1 and 0.01 % for
ACPD
15, 23131–23172, 2015Mineral aerosol deposits on sea ice
M. L. Lamare et al.
Title Page
Abstract Introduction
Conclusions References
Tables Figures
◭ ◮
◭ ◮
Back Close
Full Screen / Esc
Printer-friendly Version Interactive Discussion
Discussion
P
a
per
|
Discussion
P
a
per
|
Discussion
P
a
per
|
Discussion
P
a
per
|
0.93 % for 10 000 ng g−1. Therefore, the results presented in this study have been
pro-duced without updating the asymmetry parameterg.
4.2 Effect of mineral aerosol deposits on snow and sea ice
Much larger mass-ratios of mineral aerosol deposits are necessary to induce a change in albedo, in comparison with black carbon or soot. In a similar modelling study, Marks
5
and King (2014) found that for a wavelength of 550 nm, 10 ng g−1of black carbon evenly
distributed throughout semi-infinite sea ice causes a 22.9 % change in albedo relative to a clean medium for first year sea ice, 11.2 % for multi year sea ice and 37.6 % for melting sea ice. To achieve the same change, a mass-ratio between 1083 and 1197 ng g−1of Asian dust would be necessary. However, larger mass-ratios of dust are
10
found in polar snow and sea ice, with seasonal deposition events (Zdanowicz et al., 1998).
The calculations of the albedo of snow and sea ice in relation to different types of mineral aerosol deposits commonly found in the Arctic enabled the comparison be-tween types of contaminants and bebe-tween the different snow and sea ice types. The
15
change in albedo induced by different types of snow or sea ice is greater than the type of mineral. The results obtained here show that snow and sea ice with a smaller scat-tering cross-section are more sensitive the effects of mineral aerosol deposits on the albedo, confirming the work of Marks and King (2014), who quantified the phenomenon for the same snow and sea ice types.
20
The wavelength dependant effects of mineral aerosol deposits on albedo are sim-ilar to black carbon. The results of this study present a a good agreement with the work of Warren and Wiscombe (1980). Indeed, the absorbing aerosol deposits mainly affect shortwave radiation. In the infrared, mineral aerosol deposits barely influence the albedo of snow and sea ice, as described by Warren and Wiscombe (1980) and
25
ACPD
15, 23131–23172, 2015Mineral aerosol deposits on sea ice
M. L. Lamare et al.
Title Page
Abstract Introduction
Conclusions References
Tables Figures
◭ ◮
◭ ◮
Back Close
Full Screen / Esc
Printer-friendly Version Interactive Discussion
Discussion
P
a
per
|
Discussion
P
a
per
|
Discussion
P
a
per
|
Discussion
P
a
per
|
at larger wavelengths can be explained by the increasing absorption by the ice, that exceeds absorption by mineral aerosol deposits.
4.3 Comparison with SNICAR-online
The results of this modelling study were compared with the output of the SNICAR-online model. The two models are in agreement when the same mineral aerosol
de-5
posits in the snow are used. The volcanic ash in the model from Flanner et al. (2007) was derived from measurements of Mt St Helens eruption (Patterson, 1981), corre-sponding to the light grey sample of Mt St Helens ash used in this study. The difference in the results for mineral dust can be explained by the use of a different type of dust as input. SNICAR-online uses a combination of indices of refraction of quartz, limestone,
10
montmorillonite, illite and hematite (Flanner et al., 2007), whereas the work presented here uses the refractive indices of real dust sources, which are more representative of the aerosols present in the atmosphere. Nevertheless, the difference in albedo for high loadings of different dusts shows the importance of the mineral aerosol type at extreme loadings. The comparison between the two models for other types of mineral
15
aerosol deposits, sea ice or layers was not possible, as the features are not present in SNICAR-online.
In Fig. 8, the relative change in albedo with an increasing surface layer of mineral dust can be fitted with a linear regression. However, the relative change in albedo for media containing an uniform loading throughout is not linear. For small changes in
20
albedo, the relationship between fractional change in albedo and dust mass-ratio is approximately linear. Although the loading is important in the surface layer, the total amount of mineral aerosol deposit is small compared to a snow or ice pack with an even loading of mineral aerosol deposits.
The effect of dust layers varies significantly depending on their vertical location and
25
ACPD
15, 23131–23172, 2015Mineral aerosol deposits on sea ice
M. L. Lamare et al.
Title Page
Abstract Introduction
Conclusions References
Tables Figures
◭ ◮
◭ ◮
Back Close
Full Screen / Esc
Printer-friendly Version Interactive Discussion
Discussion
P
a
per
|
Discussion
P
a
per
|
Discussion
P
a
per
|
Discussion
P
a
per
|
A 1 cm thick layer containing the same mass-ratio as the individual buried layers was placed on the snow surface (Fig. 9) to compare with the role of the buried layers. Even when spaced out with 8 cm intervals, the buried layers caused a 0.0034 reduction in albedo at 450 nm for cold polar snow where a 1 cm surface layer caused a change in albedo of 0.0017. For comparison, the same mass evenly spread out through the
5
snowpack causes a decrease of 0.0012 in albedo compared to a clean snowpack.
5 Conclusions
The response of the albedo of snow and sea ice to mineral aerosol deposits is more sensitive to the type of snow or sea ice than to the properties of the mineral aerosol deposits themselves. Radiative-transfer calculations show that the albedo of melting
10
sea ice is more responsive to mineral aerosol deposits than snow or first/multi year sea ice. However, larger mass-ratios of mineral aerosol deposits than found in nature are needed to induce a significant change in albedo, even for the more responsive melting sea ice. These higher mass-ratios are more likely to be deposited by sin-gle storm events on snowpacks thus forming alternating layers of polluted and pure
15
snow. The thickness of a surface layer has surprisingly little effect on albedo, whereas multiple layers buried in snow have a larger impact than a uniform mixing throughout the snowpack. Amongst the different snow and sea ice types investigated, a melting medium is more affected by the radiative forcing of mineral aerosol deposits. The time of year associated with these snow and sea ice cover implies that solar radiation is at
20
its strongest, creating positive feedback and accelerating the melt process further. So far, few studies have focussed on the impact of mineral aerosol deposits, accord-ing more importance to black carbon and soot. This study demonstrates that the effects of natural pollutants need to be taken in account when investigating albedo reduction in the Arctic. Therefore, the community studying global climate change can use Fig. 5
25
ACPD
15, 23131–23172, 2015Mineral aerosol deposits on sea ice
M. L. Lamare et al.
Title Page
Abstract Introduction
Conclusions References
Tables Figures
◭ ◮
◭ ◮
Back Close
Full Screen / Esc
Printer-friendly Version Interactive Discussion
Discussion
P
a
per
|
Discussion
P
a
per
|
Discussion
P
a
per
|
Discussion
P
a
per
|
Acknowledgements. M. D. King and M. L. Lamare thank NERC for support under Grant NE/K000770X/1 and NERC FSF (555.0608).
References
Aoki, T., Aoki, T., Fukabori, M., Tachibana, Y., Zaizen, Y., Nishio, F., and Oishi, T.: Spectral albedo observation on the snow field at Barrow, Alaska, Polar Meteorology and Glaciology,
5
12, 1–9, 1998. 23133, 23134
Balkanski, Y., Schulz, M., Claquin, T., and Guibert, S.: Reevaluation of Mineral aerosol radia-tive forcings suggests a better agreement with satellite and AERONET data, Atmos. Chem. Phys., 7, 81–95, doi:10.5194/acp-7-81-2007, 2007. 23139
Barry, R. G., Serreze, M. C., Maslanik, J. A., and Preller, R. H.: The Arctic sea ice-climate
10
system: observations and modeling, Rev. Geophys., 31, 397–422, 1993. 23132
Bohren, C. F. and Huffman, D. R.: Absorption and Scattering of Light by Small Particles, John Wiley and Sons, 1983. 23138, 23148
Bohren, C. and Huffman, D.: Absorption and Scattering of Light by Small Particles, Wiley Sci-ence Series, Wiley, 2008. 23138
15
Bory, A. J. M.: Two distinct seasonal Asian source regions for mineral dust deposited in Green-land (NorthGRIP), Geophys. Res. Lett., 30, 1167, doi:10.1029/2002GL016446, 2003. 23133, 23147
Bourke, R. H. and Garrett, R. P.: Sea ice thickness distribution in the Arctic Ocean, Cold Reg. Sci. Technol., 13, 259–280, 1987. 23140
20
Buckley, R. G. and Trodahl, H. J.: Thermally driven changes in the optical properties of sea ice, Cold Reg. Sci. Technol., 14, 201–204, 1987. 23133
Carmagnola, C. M., Domine, F., Dumont, M., Wright, P., Strellis, B., Bergin, M., Dibb, J., Pi-card, G., Libois, Q., Arnaud, L., and Morin, S.: Snow spectral albedo at Summit, Green-land: measurements and numerical simulations based on physical and chemical properties
25
of the snowpack, The Cryosphere, 7, 1139–1160, doi:10.5194/tc-7-1139-2013, 2013. 23134, 23151
ACPD
15, 23131–23172, 2015Mineral aerosol deposits on sea ice
M. L. Lamare et al.
Title Page
Abstract Introduction
Conclusions References
Tables Figures
◭ ◮
◭ ◮
Back Close
Full Screen / Esc
Printer-friendly Version Interactive Discussion
Discussion
P
a
per
|
Discussion
P
a
per
|
Discussion
P
a
per
|
Discussion
P
a
per
|
Clarke, A. D. and Noone, K. J.: Soot in the Arctic snowpack: a cause for perturbations in radia-tive transfer, Atmos. Environ., 19, 2045–2053, 1985. 23134
Conway, H., Gades, A., and Raymond, C. F.: Albedo of dirty snow during conditions of melt, Water Resour. Res., 32, 1713–1718, 1996. 23134
Curry, J. A., Schramm, J. L., and Ebert, E. E.: Sea ice-albedo climate feedback mechanism, J.
5
Climate, 8, 240–247, 1995. 23132
Derimian, Y., Dubovik, O., Tanre, D., Goloub, P., Lapyonok, T., and Mortier, A.: Optical properties and radiative forcing of the Eyjafjallajökull volcanic ash layer observed over Lille, France, in 2010, J. Geophys. Res.-Atmos., 117, D00U25, doi:10.1029/2011JD016815, 2012. 23139, 23147, 23164
10
Doherty, S. J., Warren, S. G., Grenfell, T. C., Clarke, A. D., and Brandt, R. E.: Light-absorbing im-purities in Arctic snow, Atmos. Chem. Phys., 10, 11647–11680, doi:10.5194/acp-10-11647-2010, 2010. 23133, 23134
Dong, Z., Qin, D., Kang, S., Ren, J., Chen, J., Cui, X., Du, Z., and Qin, X.: Physicochemical characteristics and sources of atmospheric dust deposition in snow packs on the glaciers of
15
western Qilian Mountains, China, Tellus B, 66, 20956, doi:10.3402/tellusb.v66.20956, 2014. 23140
Dubovik, O., Holben, B., Eck, T. F., Smirnov, A., Kaufman, Y. J., King, M. D., Tanré, D., and Slutsker, I.: Variability of absorption and optical properties of key aerosol types observed in worldwide locations, J. Atmos. Sci., 59, 590–608,
doi:10.1175/1520-20
0469(2002)059<0590:VOAAOP>2.0.CO;2, 2002a. 23147
Dubovik, O., Holben, B., Lapyonok, T., Sinyuk, A., Mishchenko, M., Yang, P., and Slutsker, I.: Non-spherical aerosol retrieval method employing light scattering by spheroids, Geophys. Res. Lett., 29, 54.1–54.4, doi:10.1029/2001GL014506, 2002b. 23148
Fischer, H., Siggaard-Andersen, M.-L., Ruth, U., Röthlisberger, R., and Wolff, E.:
25
Glacial/interglacial changes in mineral dust and sea-salt records in polar ice cores: sources, transport, and deposition, Rev. Geophys., 45, RG1002, doi:10.1029/2005RG000192, 2007. 23133
Flanner, M. G., Zender, C. S., Randerson, J. T., and Rasch, P. J.: Present-day climate forc-ing and response from black carbon in snow, J. Geophys. Res.-Atmos., 112, D11202,
30
ACPD
15, 23131–23172, 2015Mineral aerosol deposits on sea ice
M. L. Lamare et al.
Title Page
Abstract Introduction
Conclusions References
Tables Figures
◭ ◮
◭ ◮
Back Close
Full Screen / Esc
Printer-friendly Version Interactive Discussion
Discussion
P
a
per
|
Discussion
P
a
per
|
Discussion
P
a
per
|
Discussion
P
a
per
|
Flanner, M. G., Zender, C. S., Hess, P. G., Mahowald, N. M., Painter, T. H., Ramanathan, V., and Rasch, P. J.: Springtime warming and reduced snow cover from carbonaceous particles, Atmos. Chem. Phys., 9, 2481–2497, doi:10.5194/acp-9-2481-2009, 2009. 23134
Flanner, M. G., Liu, X., Zhou, C., Penner, J. E., and Jiao, C.: Enhanced solar energy absorp-tion by internally-mixed black carbon in snow grains, Atmos. Chem. Phys., 12, 4699–4721,
5
doi:10.5194/acp-12-4699-2012, 2012. 23147
France, J. L., King, M., Lee-Taylor, J., Beine, H. J., Ianniello, A., Domine, F., and MacArthur, A.: Calculations of in-snow NO2and OH radical photochemical production and photolysis rates: a field and radiative-transfer study of the optical properties of Arctic (Ny-Alesund, Svalbard) snow, J. Geophys. Res., 116, F04013, doi:10.1029/2011JF002019, 2011a. 23137, 23144
10
France, J. L., King, M. D., Frey, M. M., Erbland, J., Picard, G., Preunkert, S., MacArthur, A., and Savarino, J.: Snow optical properties at Dome C (Concordia), Antarctica; implications for snow emissions and snow chemistry of reactive nitrogen, Atmos. Chem. Phys., 11, 9787– 9801, doi:10.5194/acp-11-9787-2011, 2011b. 23137
France, J. L., Reay, H. J., King, M. D., Voisin, D., Jacobi, H. W., Domine, F., Beine, H.,
Anasta-15
sio, C., MacArthur, A., and Lee-Taylor, J.: Hydroxyl radical and NOx production rates, black
carbon concentrations and light-absorbing impurities in snow from field measurements of light penetration and nadir reflectivity of onshore and offshore coastal Alaskan snow, J. Geo-phys. Res.-Atmos., 117, D00R12, doi:10.1029/2011JD016639, 2012. 23150
Fratini, G., Ciccioli, P., Febo, A., Forgione, A., and Valentini, R.: Size-segregated fluxes of
min-20
eral dust from a desert area of northern China by eddy covariance, Atmos. Chem. Phys., 7, 2839–2854, doi:10.5194/acp-7-2839-2007, 2007. 23139
Ginoux, P., Garbuzov, D., and Hsu, N. C.: Identification of anthropogenic and natural dust sources using Moderate Resolution Imaging Spectroradiometer (MODIS) Deep Blue level 2 data, J. Geophys. Res.-Atmos., 115, D05204, doi:10.1029/2009JD012398, 2010. 23133
25
Grenfell, T. C.: A radiative transfer model for sea ice with vertical structure variations, J. Geo-phys. Res.-Atmos., 96, 16991–17001, 1991. 23133, 23150
Grenfell, T. C. and Makyut, G. A.: The optical properties of ice and snow in the Arctic Basin, J. Glaciol., 18, 445–463, 1977. 23133
Grenfell, T. C. and Perovich, D. K.: Spectral albedos of sea ice and incident solar irradiance in
30
ACPD
15, 23131–23172, 2015Mineral aerosol deposits on sea ice
M. L. Lamare et al.
Title Page
Abstract Introduction
Conclusions References
Tables Figures
◭ ◮
◭ ◮
Back Close
Full Screen / Esc
Printer-friendly Version Interactive Discussion
Discussion
P
a
per
|
Discussion
P
a
per
|
Discussion
P
a
per
|
Discussion
P
a
per
|
Grenfell, T. C., Light, B., and Sturm, M.: Spatial distribution and radiative effects of soot in the snow and sea ice during the SHEBA experiment, J. Geophys. Res.-Atmos., 107, 8032, doi:10.1029/2000JC000414, 2002. 23134, 23135
Hanesiak, J. M., Barber, D. G., De Abreu, R. A., and Yackel, J. J.: Local and regional albedo observations of arctic first-year sea ice during melt ponding, J. Geophys. Res.-Atmos., 106,
5
1005–1016, 2001. 23133
Hess, M., Koepke, P., and Schult, I.: Optical properties of aerosols and clouds: the software package OPAC, B. Am. Meteorol. Soc., 79, 831–844, 1998. 23139
Jacobson, M. Z.: Climate response of fossil fuel and biofuel soot, accounting for soot’s feed-back to snow and sea ice albedo and emissivity, J. Geophys. Res.-Atmos., 109, D21201,
10
doi:10.1029/2004JD004945, 2004. 23132, 23134
Johnson, B., Turnbull, K., Brown, P., Burgess, R., Dorsey, J., Baran, A. J., Webster, H., Hay-wood, J., Cotton, R., Ulanowski, Z., Hesse, E., Woolley, A., and Rosenberg, P.: In situ obser-vations of volcanic ash clouds from the FAAM aircraft during the eruption of Eyjafjallajökull in 2010, J. Geophys. Res., 117, D00U24, doi:10.1029/2011JD016760, 2012. 23139, 23148
15
Koerner, R. M.: Distribution of microparticles in a 299-m core through the Devon Island ice cap, Northwest Territories, Canada, International Association of Hydrological Sciences, 118, 371–376, 1977. 23139
Kohler, J., Brandt, O., Johansson, M., and Callaghan, T.: A long-term Arctic snow depth record from Abisko, northern Sweden, 1913–2004, Polar Res., 25, 91–113, 2006. 23140
20
Kumai, M.: Electron microscope analysis of aerosols in snow and deep ice cores from Green-land, isotopes and impurities in snow and ice, IAHS-AISH P., 118, 341–349, 1977. 23147 Langleben, M. P.: Albedo and degree of puddling of a melting cover of sea ice, J. Glaciol., 8,
407–412, 1969. 23133
Langleben, M. P.: Albedo of melting sea ice in the southern Beaufort sea, J. Glaciol., 10, 101–
25
104, 1971. 23133
Laven, P.: MiePlot: a computer program for scattering of light from a sphere using Mie theory and the Debye series, PhilipLaven.com, 10, 2006. 23138
Lawrence, C. R. and Neff, J. C.: The contemporary physical and chemical flux of aeolian dust: a synthesis of direct measurements of dust deposition, combined Ecological and Geologic
30
Perspectives in Ecosystem Studies, Chem. Geol., 267, 46–63, 2009. 23144