BGD
12, 4405–4431, 2015Response of CO2and
H2O fluxes of a
mountainous tropical rain forest
A. Olchev et al.
Title Page
Abstract Introduction
Conclusions References
Tables Figures
◭ ◮
◭ ◮
Back Close
Full Screen / Esc
Printer-friendly Version
Interactive Discussion
Discussion
P
a
per
|
Discussion
P
a
per
|
Discussion
P
a
per
|
Discussion
P
a
per
|
Biogeosciences Discuss., 12, 4405–4431, 2015 www.biogeosciences-discuss.net/12/4405/2015/ doi:10.5194/bgd-12-4405-2015
© Author(s) 2015. CC Attribution 3.0 License.
This discussion paper is/has been under review for the journal Biogeosciences (BG). Please refer to the corresponding final paper in BG if available.
Response of CO
2
and H
2
O fluxes of a
mountainous tropical rain forest in
equatorial Indonesia to El Niño events
A. Olchev1,2, A. Ibrom3, O. Panferov4, D. Gushchina5, P. Propastin2, H. Kreilein2, T. June6, A. Rauf7, G. Gravenhorst*, and A. Knohl2
1
A.N. Severtsov Institute of Ecology and Evolution of RAS, Moscow, Russia
2
Department of Bioclimatology, Faculty of Forest Sciences and Forest Ecology, Georg-August University of Goettingen, Goettingen, Germany
3
Centre for Ecosystems and Environmental Sustainability, Department of Chemical and Biochemical Engineering, Technical University of Denmark, Roskilde, Denmark
4
Climatology and Climate Protection, Faculty of Life Sciences and Engineering, University of Applied Sciences, Bingen am Rhein, Germany
5
Department of Meteorology and Climatology, Faculty of Geography, Moscow State University, Moscow, Russia
6
Bogor Agricultural University, Department of Geophysics and Meteorology
7
Universitas Tadulako, Palu, Indonesia
*
BGD
12, 4405–4431, 2015Response of CO2and
H2O fluxes of a
mountainous tropical rain forest
A. Olchev et al.
Title Page
Abstract Introduction
Conclusions References
Tables Figures
◭ ◮
◭ ◮
Back Close
Full Screen / Esc
Printer-friendly Version
Interactive Discussion
Discussion
P
a
per
|
Discussion
P
a
per
|
Discussion
P
a
per
|
Discussion
P
a
per
|
Received: 8 February 2015 – Accepted: 24 February 2015 – Published: 16 March 2015 Correspondence to: A. Olchev (aoltche@gmail.com)
BGD
12, 4405–4431, 2015Response of CO2and
H2O fluxes of a
mountainous tropical rain forest
A. Olchev et al.
Title Page
Abstract Introduction
Conclusions References
Tables Figures
◭ ◮
◭ ◮
Back Close
Full Screen / Esc
Printer-friendly Version
Interactive Discussion
Discussion
P
a
per
|
Discussion
P
a
per
|
Discussion
P
a
per
|
Discussion
P
a
per
|
Abstract
The possible impact of El Niño–Southern Oscillation (ENSO) events on the main com-ponents of CO2 and H2O fluxes in a pristine mountainous tropical rainforest growing
in Central Sulawesi in Indonesia is described. The fluxes were continuously measured using the eddy covariance method for the period from January 2004 to June 2008.
Dur-5
ing this period, two episodes of El Niño and one episode of La Niña were observed. All these ENSO episodes had moderate intensity and were of Central Pacific type. The temporal variability analysis of the main meteorological parameters and components of CO2and H2O exchange showed a very high sensitivity of Evapotranspiration (ET) and
Gross Primary Production (GPP) of the tropical rain forest to meteorological variations
10
caused by both El Niño and La Niña episodes. Incoming solar radiation is the main governing factor that is responsible for ET and GPP variability. Ecosystem Respiration (RE) dynamics depend mainly on the air temperature changes and are almost insen-sitive to ENSO. Changes of precipitation due to moderate ENSO events did not cause any notable effect on ET and GPP, mainly because of sufficient soil moisture conditions
15
even in periods of anomalous reduction of precipitation in the region.
1 Introduction
The contribution of tropical rainforests to the global budget of greenhouse gases, their possible impact on the climatic system, and their sensitivity to climatic changes are key topics of numerous theoretical and experimental studies (Clark and Clark, 1994; Grace
20
et al., 1995, 1996; Malhi et al., 1999; Ciais et al., 2009; Lewis et al., 2009; Phillips et al., 2009; Malhi, 2010; Fisher et al., 2013; Moser et al., 2014). The area covered by tropical rainforests was drastically reduced during the last century, mainly due to human activities and presently there are less than 11.0 million km2 remaining (Malhi, 2010). While deforestation rates in the tropical forests of Brazil are now declining,
coun-25
BGD
12, 4405–4431, 2015Response of CO2and
H2O fluxes of a
mountainous tropical rain forest
A. Olchev et al.
Title Page
Abstract Introduction
Conclusions References
Tables Figures
◭ ◮
◭ ◮
Back Close
Full Screen / Esc
Printer-friendly Version
Interactive Discussion
Discussion
P
a
per
|
Discussion
P
a
per
|
Discussion
P
a
per
|
Discussion
P
a
per
|
forest loss (Hansen et al., 2013), resulting in major changes in carbon and water fluxes between the land surface and the atmosphere. Therefore, during the last decade the tropical forest ecosystems of South-East Asia and especially Indonesia are the focus area of intensive studies of biogeochemical cycle and land surface–atmosphere inter-actions. On the one hand, it is necessary to know how these tropical forests influence
5
the global and regional climate, and on the other hand, how they respond to changes of regional climatic conditions.
Climate and weather conditions in the equatorial Pacific and South-Eastern part of Asia are mainly influenced by the Intertropical Convergence Zone (ITCZ) which is sea-sonally positioned north and south of the equator. Another very important factor aff
ect-10
ing the climate of South-East Asia is the well-known coupled oceanic and atmospheric phenomenon, El Niño–Southern Oscillation (ENSO). During the warm phase of ENSO, termed “El Niño”, sea surface temperature (SST) in the central and eastern parts of the equatorial Pacific sharply increases, and during a cold phase of the phenomenon, termed “La Niña”, the SST in these areas is lower than usual. Both phenomena, El
15
Niño and La Niña, lead to essential changes of pressure distribution and atmospheric circulation and, as a result, to anomalous changes of precipitation amount, solar radia-tion, and temperature fields, both in the regions of sea surface temperature anomalies and in a wide range of remote areas through the mechanism of atmospheric bridges (Wang, 2002; Graf and Zanchettin, 2012). Typically, in Indonesia El Niño results in
20
dryer conditions and La Niña results in wetter conditions, potentially impacting the land vegetation (Erasmi et al., 2009). ENSO events are irregular, characterised by different intensity and, are usually observed at intervals of 2–7 years.
To describe the possible effects of ENSO events on CO2 and H2O exchange
be-tween land surface and the atmosphere, many studies for different Western Pacific
25
BGD
12, 4405–4431, 2015Response of CO2and
H2O fluxes of a
mountainous tropical rain forest
A. Olchev et al.
Title Page
Abstract Introduction
Conclusions References
Tables Figures
◭ ◮
◭ ◮
Back Close
Full Screen / Esc
Printer-friendly Version
Interactive Discussion
Discussion
P
a
per
|
Discussion
P
a
per
|
Discussion
P
a
per
|
Discussion
P
a
per
|
based on direct measurements of CO2 and H2O fluxes, which allow studying the re-sponse of individual terrestrial ecosystems to anomalous weather conditions, are still very limited (e.g. Hirano et al., 2007; Moser et al., 2014). Existing monitoring networks in equatorial regions of the Western Pacific are associated mainly with lowland areas and do not cover mountainous rainforest regions, even though mountainous regions
5
cover some of the last remaining undisturbed rainforest in South East Asia. Most atten-tion in former studies was paid to the descripatten-tion of plant response to anomalously dry and warm weather during El Niño events (Aiba and Kitayama, 2002; Hirano et al., 2007; Moser et al., 2014). The possible changes in plant functioning during La Niña events are still not clarified. In particular, Malhi et al. (1999) reported that El Niño periods
10
are strongly associated with enhanced dry seasons that probably result in increased carbon loss, either through water stress causing reduced photosynthesis or increased tree mortality. Aiba and Kitayama (2002) examined the effects of the 1997–98 El Niño drought on nine rainforests of Mount Kinabalu in Borneo using forest inventory and showed that El Niño increased the tree mortality for lowland forests. However, it did not
15
affect the growth rate of the trees of upland forests (higher than 1700 m) where mortal-ity was restricted by some understorey species only. Eddy covariance measurements of the CO2fluxes in a tropical peat swamp forest in Central Kalimantan, Indonesia, for
the period from 2002 to 2004, provided by Hirano et al. (2007), showed that during the El Niño event in the period November–December 2002 the net annual CO2 release
20
reached maximal values, mainly due to strong decrease of GPP in the late dry season, because of dense smoke emitted from large-scale fires. Effects of El Niño on annual RE in 2002 were insignificant.
There is a great lack of experimental data on CO2 and H2O fluxes in
mountain-ous rainforests in equatorial regions of the Western Pacific, and on their response to
25
ENSO. Hence, the main objective of this study was to evaluate and quantify the impact of ENSO events on the main components of CO2 and H2O fluxes in a pristine
BGD
12, 4405–4431, 2015Response of CO2and
H2O fluxes of a
mountainous tropical rain forest
A. Olchev et al.
Title Page
Abstract Introduction
Conclusions References
Tables Figures
◭ ◮
◭ ◮
Back Close
Full Screen / Esc
Printer-friendly Version
Interactive Discussion
Discussion
P
a
per
|
Discussion
P
a
per
|
Discussion
P
a
per
|
Discussion
P
a
per
|
2 Materials and methods
2.1 El Niño’s types and intensity
Nowadays, two types of ENSO can be distinguished: (1) the canonical or conventional El Niño, which is characterised by SST anomalies located in the eastern Pacific near the South American coast (Rasmusson and Carpenter, 1982) and (2) the Central
Pa-5
cific El Niño or El Niño Modoki (Larkin and Harrison, 2005; Ashok et al., 2007; Kug et al., 2009; Ashok and Yamagata, 2009; Gushchina and Dewitte, 2012). In 2003, the new definition of the conventional El Niño was accepted by the National Oceanic and Atmospheric Administration (NOAA) of the USA, in referring to the warming of the Pa-cific region between 5◦N–5◦S and 170–120◦W. According to Ashok et al. (2007) the
10
Central Pacific El Niño/El Niño Modoki – i.e. unusually high SST – occurs roughly in the region between 160◦E–140◦W and 10◦N–10◦S.
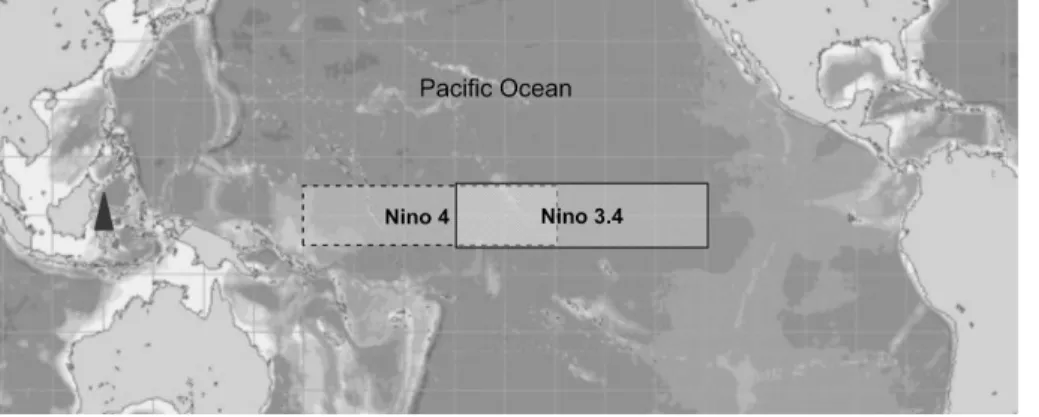
As criteria to assess the intensity of ENSO events, a wide range of indexes based on different combinations of sea level pressure and SST data in various areas of the Pacific are used. For diagnostics of the central Pacific El Niño, the SST anomalies (in
15
◦C) in Nino4 region (5◦N–5◦S and 160◦E–150◦W) are broadly used (Fig. 1). The SST
anomalies (in◦C) in Niño 3.4 region (5◦N–5◦S and 170–120◦W) are used to diagnose both types of El Niño phenomenon: canonical and Central Pacific (Download Climate Timeseries, 2013).
2.2 Experimental site
20
The tropical rainforest selected for the study is situated near the village Bariri in the southern part of the Lore Lindu National Park of Central Sulawesi in Indone-sia (1◦39.47′S and 120◦10.409′E or UTM 51 S 185482M east and 9816523M north) (Fig. 1). It lies on a small plateau (about 1430 m a.s.l.) surrounded by mountain chains surmounting the plane by another 300 m to 400 m. Within 500 m around the tower the
25
BGD
12, 4405–4431, 2015Response of CO2and
H2O fluxes of a
mountainous tropical rain forest
A. Olchev et al.
Title Page
Abstract Introduction
Conclusions References
Tables Figures
◭ ◮
◭ ◮
Back Close
Full Screen / Esc
Printer-friendly Version
Interactive Discussion
Discussion
P
a
per
|
Discussion
P
a
per
|
Discussion
P
a
per
|
Discussion
P
a
per
|
westward inclination that does not exceed 5◦. About 1000 m to the east from the
exper-imental site, the forest is replaced by a meadow (Ibrom et al., 2007).
According to the Köppen climate classification the study area relates to tropical rain-forest climate (Af) (Chen and Chen, 2013). Weather conditions of the region are mainly influenced by the ITCZ. During the wet season (typically, from November to April) the
5
area is influenced by very moist northeast monsoons coming from the Pacific. Max-imum precipitation is observed in April – with 258.0±148.0 mm month−1. The drier
season usually lasts from May to October. The precipitation minimum is observed in September with 195.0±48.0 mm month−1. The September–October period is also
characterised by maximal incoming solar radiation, up to 650±47.0 MJ m−2month−1,
10
mainly because of a significant decrease of convective clouds, due to the reversing of oceanic northeast monsoon to a southeast monsoon blowing from the Australian con-tinent. The mean annual precipitation amount exceeds 2000 mm. The mean monthly air temperature varies between 19.4 and 19.7◦C. The mean annual air temperature is 19.5◦C (Falk et al., 2005; Ibrom et al., 2007).
15
The vegetation at the experimental site is very diverse and represented by more than 88 different tree species per hectare. Among the dominant species are Castanopsis
accuminatissimaBL. (29 %),Canarium vulgareLeenh. (18 %) andFicus spec.(9.5 %).
The density of trees, with diameter at breast height larger than 0.1 m, is 550 trees per ha. In addition, there is more than a 10-fold larger number of smaller trees per hectare
20
with stem diameter lower than 0.1 m. The total basal area of trees reached 53 m2ha−1. Leaf area index (LAI) is about 7.2 m2m−2. LAI has been estimated using an indirect
hemispherical photography approach with a correction for leaf clumping effects. The height of the trees, with diameters at breast height larger than 0.1 m, varies between lowest at 12 m and highest at 36 m. The mean tree height is 21 m (Ibrom et al., 2007).
25
2.3 Flux measurements
CO2 and H2O fluxes were measured from 2004 to 2008 within the framework of the
BGD
12, 4405–4431, 2015Response of CO2and
H2O fluxes of a
mountainous tropical rain forest
A. Olchev et al.
Title Page
Abstract Introduction
Conclusions References
Tables Figures
◭ ◮
◭ ◮
Back Close
Full Screen / Esc
Printer-friendly Version
Interactive Discussion
Discussion
P
a
per
|
Discussion
P
a
per
|
Discussion
P
a
per
|
Discussion
P
a
per
|
the German Science Foundation (DFG). The eddy covariance equipment for flux mea-surement was installed on a meteorological tower of 70 m height at the 48 m level, i.e. ca. 12 m higher than maximal tree height. The measuring system consists of a three-dimensional sonic anemometer (USA-1, Metek, Germany) and an open path CO2and H2O infrared gas analyzer (IRGA, LI-7500, Li-Cor, USA; Ibrom et al., 2007; Panferov
5
et al., 2009). The open-path IRGA was calibrated with calibration gases two times per year and showed no considerable sensitivity drift within one year of operation. Tur-bulence data are sampled at 10 Hz and stored as raw data on an industrial mini PC (Kontron, Germany). All instruments are powered by batteries, which are charged by solar panels, mounted on the tower. The system is entirely self-sustaining and has
10
been proven to run unattended over a period of several months. Post-field data pro-cessing on eddy covariance flux estimates was provided according to existing rules for data analysis (Aubinet et al., 2012). For filling the gaps in the measured Net Ecosys-tem Exchange (NEE) data, as well as the gaps in net radiation, sensible and latent heat flux records of the process-based Mixfor-SVAT model (Olchev et al., 2002; 2008)
15
were applied. The Mixfor-SVAT model was also used to quantify RE and forest canopy transpiration. The model was validated using long-term data records obtained for the tropical rain forest in Bariri under well-developed turbulent conditions. The results of model validation showed a good agreement of model calculations with field observa-tions for a broad spectrum of weather and soil moisture condiobserva-tions (Falk et al., 2005;
20
Falge et al., 2005; Olchev et al., 2008). GPP of the tropical rainforest was derived as a difference between measured NEE and RE.
2.4 Micrometeorological measurements
Air temperature, relative humidity and horizontal wind speed were measured at 4 lev-els above, and at 2 levlev-els inside, the forest canopy using ventilated and sheltered
25
BGD
12, 4405–4431, 2015Response of CO2and
H2O fluxes of a
mountainous tropical rain forest
A. Olchev et al.
Title Page
Abstract Introduction
Conclusions References
Tables Figures
◭ ◮
◭ ◮
Back Close
Full Screen / Esc
Printer-friendly Version
Interactive Discussion
Discussion
P
a
per
|
Discussion
P
a
per
|
Discussion
P
a
per
|
Discussion
P
a
per
|
intensity was measured on top of the tower with a tipping bucket in a Hellman-type rain gauge. To fill the gaps in measuring records the meteorological data from a mobile au-tomatic station, situated about 900 m away from the tower on a nearby meadow, were used. For the analysis, the monthly mean values of air temperature and monthly sums of precipitation and solar energy were calculated.
5
2.5 Data analysis
To estimate the possible impact of ENSO events on CO2and H2O fluxes in the tropical
rainforest at Bariri the temporal variability of monthly NEE, GPP, RE and ET in periods with different ENSO intensity was analysed. To quantify the ENSO impacts on mete-orological parameters and fluxes and to distinguish them from effects caused by the
10
seasonal migration of the ITCZ, the annual patterns of CO2and H2O fluxes as well as
meteorological conditions during the measuring period were also evaluated.
In the first step to assess the possible impact of ENSO events on CO2 and H2O fluxes, the possible correlation between monthly NEE, GPP, RE, ET and
SST-anomalies in Nino4 and Nino3.4 regions (Nino4 and Nino3.4 indexes) were analysed.
15
In the second step, for a more accurate analysis of possible responses of H2O and CO2 fluxes in the tropical rain forest to ENSO forcing and to distinguish from their
annual cycle, the absolute deviations of monthly flux values from monthly averages over the entire measuring period were calculated. The deviation in the case of GPP (∆GPP) was estimated as
20
∆GPPMonth, Year=GPPMonth, Year−
1
N 2008X
Year=2004
GPPMonth, Year
where GPPMonth, Yearis total monthly GPP for a particular month (January to December)
and corresponding year (2004 to 2008),N1P2008Year=2004GPPMonth, Yearis monthly GPP for
this particular month averaged for the entire measuring period (2004 to 2008); N is number of years. The temporal variability of deviations was then compared to Nino3.4
BGD
12, 4405–4431, 2015Response of CO2and
H2O fluxes of a
mountainous tropical rain forest
A. Olchev et al.
Title Page
Abstract Introduction
Conclusions References
Tables Figures
◭ ◮
◭ ◮
Back Close
Full Screen / Esc
Printer-friendly Version
Interactive Discussion
Discussion
P
a
per
|
Discussion
P
a
per
|
Discussion
P
a
per
|
Discussion
P
a
per
|
and Nino4 indexes. Positive values in∆GPP,∆RE, and∆NEE indicate GPP, RE higher and NEE (carbon uptake) lower than average. In order to avoid any possible influ-ence of short-term month-to-month flux fluctuations, smoothed moving average (MA) curves of flux deviations were analysed. For the smoothing procedure, the 7 month (±3 months) running mean was used. Similar deviations were calculated also for mean
5
monthly air temperature (T), global solar radiation (G) and precipitation amount (P).
3 Results
During the measuring period, two El Niño (August 2004–March 2005 and Octo-ber 2006–January 2007) and one La Niña (NovemOcto-ber 2007–April 2008) phenomena were observed. All events had moderate intensity. Both warm events could be
classi-10
fied as the Central Pacific or Modoki type, according to Ashok et al. (2007), since the SST-anomalies were centred in Nino3.4 and Nino4 regions (Fig. 1).
Analysis of the annual pattern of CO2and H2O fluxes shows a relatively weak sea-sonal variability (Fig. 2). The maximal values of GPP were obtained during the sec-ond part of the drier season – from August to October (278±13 g C m−2month−1)
15
– which is also characterised by maximal values of incoming solar radiation. The mean monthly air temperature in the period varied from minimal values in August (19.2±0.2◦C) to maximal values in October (19.8±0.2◦C). The minimal GPP values
were obtained in transition periods between more wet and dry seasons – in May– June and November–December (240±15 and 249±21 g C m−2month−1, respectively).
20
These periods are also characterised by minimal amounts of incoming solar radiation (512±40 MJ m−2month−1). Maximal RE (206±10 g C m−2month−1) and values were
obtained in October, which corresponds to the period of maximal air temperature and insolation. The local maximum of RE in April–May (199±4 g C m−2month−1) is also well
correlated with a small increase of the air temperature in these months. The minimal RE
25
was observed in February and June–August (174±10 and 187±15 g C m−2month−1,
BGD
12, 4405–4431, 2015Response of CO2and
H2O fluxes of a
mountainous tropical rain forest
A. Olchev et al.
Title Page
Abstract Introduction
Conclusions References
Tables Figures
◭ ◮
◭ ◮
Back Close
Full Screen / Esc
Printer-friendly Version
Interactive Discussion
Discussion
P
a
per
|
Discussion
P
a
per
|
Discussion
P
a
per
|
Discussion
P
a
per
|
of GPP. The maximum values of ET were also observed in October (136±4 mm), in
the month of maximal incoming solar radiation and highest values of air temperature. In spite of a large amount of precipitation and a high air temperature during the period from March to June, ET in this period was much lower than in September and October (e.g. 105±8 mm in April).
5
Comparisons of monthly NEE, GPP, RE, ET and SST-anomalies in Nino4 and Nino3.4 regions (Nino4 and Nino3.4 indexes) indicate relatively low correlations. Changes of the Nino4 index can explain about 12 % of the observed variability in GPP (coefficient of determination,r2=0.12,p <0.05), 9 % of RE (r2=0.09,p <0.05), 9 % of NEE (r2=0.09, p >0.05), 6 % of ET (r2=0.06, p <0.05) and only about 1 %
10
of transpiration (TR) (r2=0.01, p >0.05). Similar values were obtained in correlation analysis for the Nino3.4 index. In the period of El Niño peak phases (September 2004– January 2005 and October 2006–January 2007) the values ET and GPP tend to in-crease in the study area. An inin-crease of RE was indicated only during the second El Niño event from October 2006 to January 2007. The effect of El Niño on NEE was
15
insignificant. The effect of La Niña on CO2 and H2O flux components was very small
and manifested only in a slight increase of NEE.
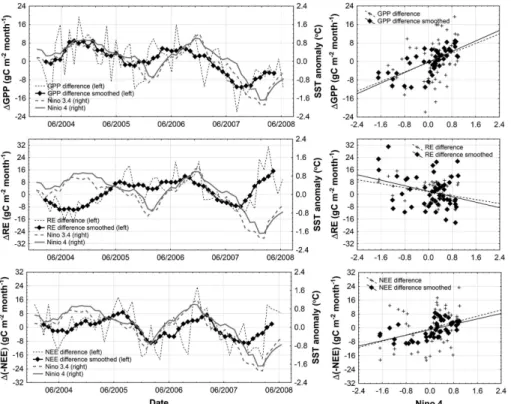
Analysis of the temporal variability of the moving average values of∆GPP (∆GPPMA)
(Fig. 3) indicates a relatively high correlation between∆GPPMA and both Nino4 (r 2
=
0.52, p <0.05) and Nino3.4 (r2=0.60, p <0.05) indexes. Close correlation between
20
the intensity of ENSO events and∆GPPMAcan be explained by the influence of ENSO on total cloud amount in the region and, as a result, on monthly sums of incoming
G (Fig. 4). Variability of G (∆GMA) is very closely correlated with Nino4 and Nino34
(r2=0.48, p <0.05 for both indexes) and it can explain 69 % of variability of GPP (r2=0.69,p <0.5). The maximal deviations of∆GMAfrom mean values (averaged for
25
the entire measuring period) are occurring a few months before the peak phase of the ENSO events. The effect of T changes on∆GPPMA is very low (r2=0.01, p >0.05). The correlation between∆TMAand Nino4, Nino3.4 indexes are also very low (r
2
=0.15,
BGD
12, 4405–4431, 2015Response of CO2and
H2O fluxes of a
mountainous tropical rain forest
A. Olchev et al.
Title Page
Abstract Introduction
Conclusions References
Tables Figures
◭ ◮
◭ ◮
Back Close
Full Screen / Esc
Printer-friendly Version
Interactive Discussion
Discussion
P
a
per
|
Discussion
P
a
per
|
Discussion
P
a
per
|
Discussion
P
a
per
|
correlations between ∆REMA and ENSO indexes (r 2
=0.10, p <0.05 for Nino4 and
r2=0.04,p >0.05 for Nino3.4) (Figs. 3 and 4).
Despite the relatively close dependence of∆GPPMAon ENSO intensity, the correla-tions between∆NEEMAand Nino4, Nino3.4 indexes are lower (r
2
=0.31, p <0.05 for Nino4 andr2=0.37, p <0.05 for Nino3.4), mainly because of their very low
correla-5
tion during the first part of the measuring period (before December 2005). During the second part of the considered period (from June 2006 to June 2008) with one strong El Niño (October 2006–January 2007) and one La Niña (November 2004–April 2008), events∆NEEMA and Nino4, Nino3.4 indexes are correlated much better. Such a trend
can be explained by the influence of∆REMAon∆NEEMA dynamics that is mainly
gov-10
erned by temperature variability and which is, as already mentioned, very poorly cor-related with Nino4/Nino3.4 indexes (Figs. 3 and 4).
ET (∆ETMA variability) showed a well response to ENSO activity as well: r2=0.72,
p <0.05 for Nino4 andr2=0.70, p <0.05 for Nino3.4 (Fig. 5) probably also triggered by the very high correlation between∆GMAand Nino4, Nino3.4 indexes and∆GMAand
15
∆ETMA. Interestingly, a small backward phase shift is observed between periods of
ex-treme∆ETMAvalues and maximal intensity of ENSO. Correlations between∆ETMAand
∆TMA, as well as between∆ETMAand∆PMA, are insignificant –r 2
=0.09 andr2=0.01, respectively. However, Fig. 4 clearly shows a manifested time delay in∆PMAoscillation,
relative to Nino4 and Nino3.4 patterns, when maximal positive or negative deviations
20
of∆PMA are indicated about five months after peak phases of ENSO. The best
corre-lation between the time-shifted time series of∆PMAfrom ENSO index patterns is much
higher (r2=0.32,p <0.05 for Nino4 andr2=0.28,p <0.05 for Nino3.4).
To explain a very low sensitivity of ET to P changes, we analysed the annual vari-ability of the ratio between ET and potential evaporation (PET), as well as between ET
25
BGD
12, 4405–4431, 2015Response of CO2and
H2O fluxes of a
mountainous tropical rain forest
A. Olchev et al.
Title Page
Abstract Introduction
Conclusions References
Tables Figures
◭ ◮
◭ ◮
Back Close
Full Screen / Esc
Printer-friendly Version
Interactive Discussion
Discussion
P
a
per
|
Discussion
P
a
per
|
Discussion
P
a
per
|
Discussion
P
a
per
|
The mean annual ET during the measuring period is considerably lower than P
(ET/P =0.742). Over the annual course, the ratio varied between 0.58 (in March and November) to 1.85 (in August and October). During dry periods before the positive phase of ENSO, the mean values of the ET/P ratio grow up to 1.9–2.1. During the periods of negative Nino4 and Nino3.4 anomalies the mean monthly ET/P ratio fell, in
5
some months, down to 0.3. Correlation analysis of temporal variability of∆(ET/P) and
∆(ET/P)MAratios and Nino4 and Nino3.4 indexes (Fig. 5) did not show any statistically
significant relationships. However, it should be mentioned that the temporal pattern of
∆(ET/P) and∆(ET/P)MAis characterised by two peaks that were observed in July of 2005 and April 2007, about 6–8 months prior to the El Niño culmination (Fig. 5).
10
The monthly mean ET/PET ratio has a feeble annual trend with maximum in June (0.93±0.03) and with minimum in February and October (0.84±0.06). The averaged
annual ET/PET ratio for the entire measuring period was 0.880±0.055. The minimal
values of∆(ET/PET)MA(∆(ET/PET)MA=0.81) were observed during the El Niño
cul-mination in 2005–2006, and the maximal values, during the period of maximal intensity
15
of La Niña in 2008 (∆(ET/PET)MA=0.93). Thus, monthly ET rates are relatively close
to PET values during the whole year including the periods of maximal ENSO activity. The relative soil water content of the upper 30 cm horizon calculated using the Mixfor-SVAT model during the entire period of the field measurements, including the periods with maximal values of the ET/P ratio, was always higher than 80 %. This, together with
20
the ET/PET ratio, is a clear indicator of permanently sufficient soil moisture conditions in the study area, including periods of El Niño and La Niña culminations, explaining the very low sensitivity of∆ET to∆P.
4 Discussion
The provided analysis of the temporal variability for the main components of carbon and
25
BGD
12, 4405–4431, 2015Response of CO2and
H2O fluxes of a
mountainous tropical rain forest
A. Olchev et al.
Title Page
Abstract Introduction
Conclusions References
Tables Figures
◭ ◮
◭ ◮
Back Close
Full Screen / Esc
Printer-friendly Version
Interactive Discussion
Discussion
P
a
per
|
Discussion
P
a
per
|
Discussion
P
a
per
|
Discussion
P
a
per
|
and∆ETMAdeviations from monthly averages over the entire measuring period. These relationships are mainly governed by the strong dependency of the incoming solar radiation on ENSO intensity and high correlation between monthly GPP and ET rates and solar radiation absorbed by the ground surface (Ibrom et al., 2008). The effects of monthly air temperature and precipitation changes on ∆GPP and ∆ET variability
5
are relatively poor, mainly due to the low correlations between∆TMA,∆PMAand ENSO
intensity. The maximal intensity of ENSO events is usually observed in the period of December to February. During the year, the intensity of ENSO associated anomalies changed drastically, including the change of anomaly sign. As a result, the effect of ENSO in annual values of both meteorological parameters and fluxes is very poorly
10
manifested.
The patterns of∆GPPMA,∆ETMA and ∆GMA have a clearly manifested 1–3 month
backward shift relative to the course of Nino4 SST, i.e. the maxima in GPP and ET occur earlier than ENSO culmination in the central Pacific (Nino4 SST anomaly). Such an effect of El Niño episodes on the seasonality ofGcan be explained by a decrease of
15
the cloud amount in the region of Indonesia, due to the El Niño-associated shift of the Walker circulation cell, and corresponding zone of deep convection, from the maritime continent of Indonesia toward the dateline following SST anomalies displacement. El Niño usually begins in April, and toward August-September the ascending branch of the Walker cell leaves Indonesia and migrates to the Pacific. Therefore, 3–4 months
20
before the El Niño culmination in December–January, a decrease in cloud amount is observed over Indonesia. Weakening of El Niño, in turn, leads to a backward shift of intensive convection zone westward. It can result in increasing precipitation amounts in the region during the second half of the wet period after passing the maximal El Niño activity, and also the gradual increase of the cloudiness and decrease of incoming solar
25
BGD
12, 4405–4431, 2015Response of CO2and
H2O fluxes of a
mountainous tropical rain forest
A. Olchev et al.
Title Page
Abstract Introduction
Conclusions References
Tables Figures
◭ ◮
◭ ◮
Back Close
Full Screen / Esc
Printer-friendly Version
Interactive Discussion
Discussion
P
a
per
|
Discussion
P
a
per
|
Discussion
P
a
per
|
Discussion
P
a
per
|
cloudiness and precipitation, being more pronounced as it falls into the dry period of the year.
A relatively poor correlation between ∆TMA patterns and ENSO activity and a
in-significant influence of∆T on ∆GPP and ∆ET can be mainly explained by the small annual amplitude of the air temperature in the study area not exceeding 1.0◦C, as
5
well as by the low dependence of the air temperature on incoming solar radiation. The mean monthly temperatures ranged in the annual course between 19.5 and 20.5◦C. Maximal air temperatures do not exceed 28.5◦C, even on sunny days. Such optimal thermal conditions with high precipitation amount provide sufficient soil moistening and relatively comfortable conditions for tree growth during the whole year.
10
The analysis of absolute and relative changes of GPP and ET during the periods of maximal El Niño and La Niña activity showed that GPP during the El Niño culmina-tions of 2005 and 2007 increased by about 20 g C m−2month−1(6–7 %).∆GPPMAwas
about 9 g C m−2month−1 (2–3 %), ∆ET – about 40 mm month−1 (30 %) and ∆ET MA –
about 10 mm month−1(6–7 %). Thus, the maximal∆GPP was two times lower than the
15
mean annual amplitude of GPP (Fig. 2). The maximal∆ET was equal to the annual amplitude of ET (Fig. 2). During the La Niña culmination of 2008 the maximal relative changes of GPP were higher than the relative changes observed during El Niño events:
∆GPP was about−22 g C m−2month−1 (8 %),∆GPPMA – about −12 g C m− 2
month−1 (4 %). The maximal decrease of∆ET in the period was relatively small:∆ET – about
20
−12 mm month−1 (10 %) and ∆ETMA – about −5 mm month−1 (4 %). ∆ET was about 3 times lower than the mean annual amplitude of ET. It can be expected that more intensive ENSO events can result in much larger changes of GPP and ET.
Additionally, we investigated the influence of other climatic anomalies in the region on CO2 and H2O fluxes of the tropical rain forest, such as the Madden–Julian
oscilla-25
BGD
12, 4405–4431, 2015Response of CO2and
H2O fluxes of a
mountainous tropical rain forest
A. Olchev et al.
Title Page
Abstract Introduction
Conclusions References
Tables Figures
◭ ◮
◭ ◮
Back Close
Full Screen / Esc
Printer-friendly Version
Interactive Discussion
Discussion
P
a
per
|
Discussion
P
a
per
|
Discussion
P
a
per
|
Discussion
P
a
per
|
estimation of deep convection intensity in the tropics, the outgoing long-wave radiation (OLR) measured at the top of the atmosphere is commonly used. It was recently shown that 6–12 months prior to the onset of an El Niño episode a drastic intensification of the MJO occurs in the Western Pacific (Zhang and Gottschalck, 2002; Lau, 2005; Hen-don et al., 2007; Gushchina and Dewitte, 2011). Furthermore, MJO behaviour varies
5
significantly during the ENSO cycle: it is significantly decreased during the maxima of conventional El Niño episodes, while it is still active during the peak phase of central Pacific events. MJO rarely occurs during La Niña episodes (Gushchina and Dewitte, 2012). As MJO is strongly responsible for intra-seasonal variation of precipitation in the study region, the occurrence of MJO events was compared to the significant anomalies
10
of ET/P ratio and of key meteorological variables. No evidence of MJO influence is ob-served: the positive and negative anomalies of ET/P ratio are associated to positive, negative and zero anomalies of OLR, filtered in the MJO interval. Also, no significant relation emerged from the correlation analysis.
Correlations between MJO index (Wheeler and Kiladis, 1999; Gushchina and
De-15
witte, 2011), and the deviations of key meteorological parameters from monthly av-erages during the study period were very low: r2=0.03 for T, r2=0.03 for P and
r2=0.01 forG(p >0.05, in both cases).
The Indian Ocean Dipole (IOD) is characterised by changes of the SST in the west-ern Indian Ocean, resulting in intensive rainfall in the westwest-ern part of Indonesia during
20
the positive phase and corresponding precipitation reduction during the negative phase (Saji et al., 1999). To find a possible influence of IOD events on temporal variability of meteorological parameters and CO2 and H2O fluxes, the monthly mean IOD index (Dipole Mode Index, DMI) was used. Results showed that with respect to the western part of Indonesia situated close to Indian Ocean the IOD phenomenon has no
signifi-25
BGD
12, 4405–4431, 2015Response of CO2and
H2O fluxes of a
mountainous tropical rain forest
A. Olchev et al.
Title Page
Abstract Introduction
Conclusions References
Tables Figures
◭ ◮
◭ ◮
Back Close
Full Screen / Esc
Printer-friendly Version
Interactive Discussion
Discussion
P
a
per
|
Discussion
P
a
per
|
Discussion
P
a
per
|
Discussion
P
a
per
|
5 Conclusions
CO2 and H2O fluxes, in the mountainous tropical rain forest in Central Sulawesi in
In-donesia, showed a very high sensitivity of monthly GPP and ET to ENSO intensity for the period from January 2004 to June 2008. It is mainly governed by a high sensitivity of incoming solar radiation to Nino4 and Nino3.4 SST changes and the influence of
5
incoming solar radiation on GPP and ET. In contrast, RE pattern is mainly influenced by air temperature variation, which is however not significantly influenced by ENSO activity. Thus, there is no significant relationship between Nino4 and Nino3.4 SST dy-namics and RE pattern. Correlation between ENSO intensity and variation of monthly mean NEE values is also relatively low. Precipitation variation has no influence on CO2
10
and H2O fluxes, mainly due to the permanently sufficient soil moisture condition in the
study area.
Other climatic anomalous events in the Western Pacific region, such as the Indian Ocean Dipole and the Madden–Julian oscillation, did not show any significant effect on meteorological conditions or CO2 and H2O fluxes in the tropical rain forest in Central
15
Sulawesi.
It is important to emphasise that the considered observation period does not cover the period with extreme El Niño events, such as, e.g., the 1982–1983 and 1997–1998 events, when the anomaly of Nino3.4 SST, during several months, exceeded 2.6 and more significant changes of surface moistening conditions could be observed. It can be
20
also expected that in lowland parts of Sulawesi, characterised by higher temperatures and lower precipitation, the response to ENSO events can be also more pronounced.
All observed ENSO events during the selected period are classified as Central Pacific type. Recently, Yeh et al. (2009) showed that under projected climate change the pro-portion of Central Pacific ENSO events might increase. Furthermore, Cai et al. (2014,
25
BGD
12, 4405–4431, 2015Response of CO2and
H2O fluxes of a
mountainous tropical rain forest
A. Olchev et al.
Title Page
Abstract Introduction
Conclusions References
Tables Figures
◭ ◮
◭ ◮
Back Close
Full Screen / Esc
Printer-friendly Version
Interactive Discussion
Discussion
P
a
per
|
Discussion
P
a
per
|
Discussion
P
a
per
|
Discussion
P
a
per
|
CO2and H2O exchange between atmosphere and the tropical rain forests in Indonesia under future climatic conditions.
Acknowledgement. The study was supported by the German Science Foundation under the projects “Stability of Rainforest Margins in Indonesia”, STORMA (SFB 552), “Ecological and Socioeconomic Functions of Tropical Lowland Rainforest Transformation Systems (Sumatra,
5
Indonesia)” (SFB 990) and KN 582/8-1. The Russian Science Foundation (grant RSCF 14-27-00065) supports A. Olchev in part of the model development.
This open-access publication is funded by the University of Göttingen.
References
10
Aiba, S. and Kitayama, K.: Effects of the 1997–98 El Niño drought on rain forests of Mount Kinabalu, Borneo, J. Trop. Ecol., 18, 215–230, 2002.
Ashok, K. and Yamagata, T.: The El Niño with a differenc, Nature, 461, 481–484, 2009.
Ashok, K., Behera, S. K., Rao, S. A., Weng, H., Yamagata, T.: El Nino Modoki and its possible teleconnection. J. Geophys. Res. 112, C11007, doi:10.1029/2006JC003798, 2007.
15
Aubinet, M., Vesala, T., and Papale, D. (Eds.): Eddy Covariance: a Practical Guide to Measure-ment and Data Analysis, Springer Atmospheric Sciences, Springer Verlag, Dordrecht, The Netherlands, 438 pp., 2012.
Cai, W., Borlace, S., Lengaigne, M., van Rensch, P., Collins, M., Vecchi, G., Timmermann, A., Santoso, A., McPhaden, M. J., Wu, L., England, M. H., Wang, G., Guilyardi, E., and Jin, F.-F.:
20
Increasing frequency of extreme El Niño events due to greenhouse warming, Nature Climate Change, 4, 111–116, 2014.
Cai, W., Wang, G., Santoso, A., McPhaden, M., Wu, L., Jin, F- F., Timmermann, A., Collins, M., Vecchi, G., Lengaigne, M., England, M., Dommenget, D., Takahashi, K., Guilyardi, E.: More frequent extreme La Niña events under greenhouse warming, Nature Climate Change, 5,
25
132–137, 2015.
BGD
12, 4405–4431, 2015Response of CO2and
H2O fluxes of a
mountainous tropical rain forest
A. Olchev et al.
Title Page
Abstract Introduction
Conclusions References
Tables Figures
◭ ◮
◭ ◮
Back Close
Full Screen / Esc
Printer-friendly Version
Interactive Discussion
Discussion
P
a
per
|
Discussion
P
a
per
|
Discussion
P
a
per
|
Discussion
P
a
per
|
Ciais, P., Piao, S.-L., Cadule, P., Friedlingstein, P., and Chédin, A.: Variability and recent trends in the African terrestrial carbon balance, Biogeosciences, 6, 1935–1948, doi:10.5194/bg-6-1935-2009, 2009.
Clark, D. A. and Clark, D. B.: Climate-induced variation in canopy tree growth in a Costa Rican tropical rain forest, J. Ecol., 82, 865–872, 1994.
5
Download Climate Timeseries: available at: http://www.esrl.noaa.gov/psd/gcos_wgsp/ Timeseries/ (last access: 24 April 2013), 2013.
Erasmi, S., Propastin, P., Kappas, M., and Panferov, O.: Patterns of NDVI variation over Indone-sia and its relationship to ENSO during the period 1982–2003, J. Climate, 22, 6612–6623, 2009.
10
Falge, E., Reth, S., Brüggemann, N., Butterbach-Bahl, K., Goldberg, V., Oltchev, A., Schaaf, S., Spindler, G., Stiller, B., Queck, R., Köstner, B., Bernhofer, C.: Comparison of surface energy exchange models with eddy flux data in forest and grassland ecosystems of Germany, J. Ecol. Model., 188, 174–216, 2005.
Falk, U., Ibrom, A., Kreilein, H., Oltchev, A., and Gravenhorst, G.: Energy and water fluxes
15
above a cacao agroforestry system in Central Sulawesi, Indonesia, indicate effects of land-use change on local climate, Meteorol. Z., 14, 219–225, 2005.
FAO: Global Forest Resources Assessment 2010: Main Report, FAO Forestry Paper 163, Rome, Italy, 340 pp., 2010.
Feely, R. A., Wanninkhof, R., Takahashi, T., and Tans, P.: Influence of El Niño on the equatorial
20
Pacific contribution to atmospheric CO2accumulation, Nature 398, 597–601, 1999.
Fisher, J. B., Sikka, M., Sitch, S., Ciais, P., Poulter, B., Galbraith, D., Lee, J.-E., Huntingford, C., Viovy, N., Zeng, N., Ahlstrom, A., Lomas, M. R., Levy, P. E., Frankenberg, C., Saatchi, S., and Malhi, Y.: African tropical rainforest net carbon dioxide fluxes in the twentieth century, Philos. T. R. Soc. B, 368, 20120376, doi:10.1098/rstb.2012.0376, 2013.
25
Gerold, G., Leemhuis, C.: Effects of “ENSO-events” and rainforest conversion on river dis-charge in Central Sulawesi (Indonesia), in: Tropical Rainforests and Agroforests under Global Change Environmental Science and Engineering, edited by: Tscharntke, T., Leuschner, C., Veldkamp, E., Faust, H., Guhardja, E., and Bidin, A., Springer-Verlag, Berlin, Heidelberg, Germany, 327–350, 2010.
30
undis-BGD
12, 4405–4431, 2015Response of CO2and
H2O fluxes of a
mountainous tropical rain forest
A. Olchev et al.
Title Page
Abstract Introduction
Conclusions References
Tables Figures
◭ ◮
◭ ◮
Back Close
Full Screen / Esc
Printer-friendly Version
Interactive Discussion
Discussion
P
a
per
|
Discussion
P
a
per
|
Discussion
P
a
per
|
Discussion
P
a
per
|
turbed tropical rain forest in south-west Amazonia, 1992 to 1993, Science, 270, 778–780, 1995.
Grace, J., Malhi, Y., Lloyd, J., McIntyre, J., Miranda, A. C., Meir, P., and Miranda, H. S.: The use of eddy covariance to infer the net carbon uptake of Brazilian rain forest, Glob. Change Biol., 2, 209–218, 1996.
5
Graf, H.-F. and Zanchettin, D.: Central Pacific El Niño, the “subtropical bridge,”and Eurasian climate, J. Geophys. Res., 117, D01102, doi:10.1029/2011JD016493, 2012.
Gushchina, D. and Dewitte, B.: The relationship between intraseasonal tropical variability and ENSO and its modulation at seasonal to decadal timescales, Cent. Eur. J. Geosci., 1, 175– 196, doi:10.2478/s13533-011-0017-3, 2011.
10
Gushchina, D. and Dewitte, B.: Intraseasonal tropical atmospheric variability associated to the two flavors of El Niño, Mon. Weather Rev., 140, 3669–3681, 2012.
Hansen, M. C., Potapov, P. V., Moore, R., Hancher, M., Turubanova, S. A., Tyukavina, A., Thau, D., Stehman, S. V., Goetz, S. J., Loveland, T. R., Komardeey, A. Egorov, A., Chini, L., Justice, C. O., and Townshend, J. R. G. High-resolution global maps of 21st-century forest
15
cover change, Science, 342, 850–853, 2013.
Hirano, T., Segah, H., Harada, T., Limin, S., June, T., Hirata, R., and Osaki, M.: Carbon dioxide balance of a tropical peat swamp forest in Kalimantan, Indonesia, Glob. Change Biol., 13, 412–425, doi:10.1111/j.1365-2486.2006.01301.x, 2007.
Ibrom, A., Olchev, A., June, T., Ross, T., Kreilein, H., Falk, U., Merklein, J., Twele, A.,
20
Rakkibu, G., Grote, S., Rauf, A., and Gravenhorst, G.: Effects of land-use change on matter and energy exchange between ecosystems in the rain forest margin and the atmosphere, in: The Stability of Tropical Rainforest Margins: Linking Ecological, Economic and Social Con-straints, edited by: Tscharntke, T., Leuschner, C., Zeller, M., Guhardja, E., and Bidin, A., Springer Verlag, Berlin, 463–492, 2007.
25
Ibrom, A., Oltchev, A., June, T., Kreilein, H., Rakkibu, G., Ross Th., Panferov, O., and Graven-horst, G.: Variation in photosynthetic light-use efficiency in a mountainous tropical rain forest in Indonesia, Tree Physiol., 28, 499–508, 2008.
Kug, J.-S., Jin, F.-F., and An, S.-I.: Two types of El Niño events: cold tongue El Niño and warm pool El Niño, J. Climate, 22, 1499–1515, 2009.
30
BGD
12, 4405–4431, 2015Response of CO2and
H2O fluxes of a
mountainous tropical rain forest
A. Olchev et al.
Title Page
Abstract Introduction
Conclusions References
Tables Figures
◭ ◮
◭ ◮
Back Close
Full Screen / Esc
Printer-friendly Version
Interactive Discussion
Discussion
P
a
per
|
Discussion
P
a
per
|
Discussion
P
a
per
|
Discussion
P
a
per
|
Lau, W. K. M.: El Niño Southern Oscillation Connection, in: Intraseasonal Variability of the Atmosphere-Ocean Climate System, edited by: Lau, W. K. M. and Waliser, D. E., Praxis Publishing,Chichester, UK, 271, 71–300, 2005.
Lewis, S. L., Lopez-Gonzalez, G., Sonke, B., Affum-Baffoe, K., Baker, T. R., Ojo, L. O., Phillips, O. L., Reitsma, J. M., White, L., Comiskey, J. A., Djuikouo, K. M.-N.,
5
Ewango, C. E. N., Feldpausch, T. R., Hamilton, A. C., Gloor, M., Hart, T., Hladik, A., Lloyd, J., Lovett, J. C., Makana, J.-R., Malhi, Y., Mbago, F. M., Ndangalasi, H. J., Peacock, J., Peh, K. S.-H., Sheil, D., Sunderland, T., Swaine, M. D., Taplin, J., Taylor, D., Thomas, S. C., Votere, R., and Woll, H.: Increasing carbon storage in intact African tropical forests, Nature, 457, 1003–1006, 2009.
10
Malhi, Y.: The carbon balance of tropical forest regions, 1990–2005, Current Opinion in Envi-ronmental Sustainability, 2, 237–244, 2010.
Malhi, Y., Baldocchi, D. D., and Jarvis, P. G.: The carbon balance of tropical, temperate and boreal forests, Plant Cell Environ., 22, 715–740, 1999.
Moser, G., Schuldt, B., Hertel, D., Horna, V., Coners, H., Barus, H., and Leuschner, C.:
Repli-15
cated throughfall exclusion experiment in an Indonesian perhumid rainforest: wood produc-tion, litter fall and fine root growth under simulated drought, Glob. Change Biol., 20, 1481– 1497, doi:10.1111/gcb.12424, 2014.
Oltchev, A., Cermak, J., Nadezhdina, N., Tatarinov, F., Tishenko, A., Ibrom, A., Gravenhorst, G.: Transpiration of a mixed forest stand: field measurements and simulation using SVAT
mod-20
els, J. Boreal Environmental Reserach, 7, 389–397, 2002.
Olchev, A., Ibrom, A., Ross, T., Falk, U., Rakkibu, G., Radler, K., Grote, S., Kreilein, H., and Gravenhorst, G.: A modelling approach for simulation of water and carbon dioxide exchange between multi-species tropical rain forest and the atmosphere, J. Ecol. Model., 212, 122– 130, 2008.
25
Panferov, O., Ibrom, I., Kreilein, H., Oltchev, A., Rauf, A., June, T., Gravenhorst, G., and Knohl, A.: Between deforestation and climate impact: the Bariri Flux tower site in the pri-mary montane rainforest of Central Sulawesi, Indonesia, The Newsletter of FLUXNET, 2, 17–19, 2009.
Phillips, O. L., Aragao, L., Lewis, S. L., Fisher, J. B., Lloyd, J., Lopez-Gonzalez, G., Malhi, Y.,
30
BGD
12, 4405–4431, 2015Response of CO2and
H2O fluxes of a
mountainous tropical rain forest
A. Olchev et al.
Title Page
Abstract Introduction
Conclusions References
Tables Figures
◭ ◮
◭ ◮
Back Close
Full Screen / Esc
Printer-friendly Version
Interactive Discussion
Discussion
P
a
per
|
Discussion
P
a
per
|
Discussion
P
a
per
|
Discussion
P
a
per
|
Higuchi, N., Jimenez, E., Lloyd, G., Meir, P., Mendoza, C., Morel, A., Neill, D. A., Nep-stad, D., Patino, S., Penuela, M. C., Prieto, A., Ramirez, F., Schwarz, M., Silva, J., Silveira, M., Thomas, A. S., ter Steege, H., Stropp, J., Vasquez, R., Zelazowski, P., Davila, E. A., An-delman, S., Andrade, A., Chao, K.-J., Erwin, T., Di Fiore, A., Honorio, C. E., Keeling, H., Killeen, T. J., Laurance, W. F., Cruz, A. P., Pitman, N. C. A., Vargas, P. N., Ramirez-Angulo, H.,
5
Rudas, A., Salamao, R., Silva, N., Terborgh, J., and Torres-Lezama, A.: Drought sensitivity of the Amazon rainforest, Science, 323, 1344–1347, 2009.
Priestley, C. H. B. and Taylor, R. J.: On the assessment of surface heat flux and evaporation using large-scale parameters, Mon. Weather Rev., 100, 81–92, 1972.
Rasmusson, E. M. and Carpenter, T. H.: Variations in tropical sea surface temperature and
10
surface wind fialds associated with the Southern Oscillation/El Nino, Mon. Weather Rev., 110, 354–384, 1982.
Rayner, P. J. and Law, R. M.: The relationship between tropical CO2 fluxes and the El Niño– Southern Oscillation, Geophys. Res. Lett., 26, 493–496, doi:10.1029/1999GL900008, 1999. Reichstein, M., Bahn, M., Ciais, P., Frank, D., Mahecha, M. D., Seneviratne, S. I.,
Zscheis-15
chler, J., Beer, C., Buchmann, N., Frank, D. C., Papale, D., Rammig, A., Smith, P., Thon-icke, K., van der Velde, M., Vicca, S., Walz, A., and Wattenbach, M.: Climate extremes and the carbon cycle, Nature, 500, 287–295, 2013.
Saji, N. H., Goswami, B. N., Vinayachandran, P. N., and Yamagata, T.: A dipole mode in the tropical Indian Ocean, Nature, 401, 360–363, 1999.
20
Wang, C.: Atmospheric circulation cells associated with the El Niño–Southern Oscillation, J. Climate, 15, 399–419, 2002.
Wheeler, M. C. and Kiladis, G. N.: Convectively coupled equatorial waves: analysis of clouds and temperature in the wavenumber–frequency domain, J. Atmos. Sci., 56, 374–399, 1999. Yeh, S.-W., Kug, J.-S., Dewitte, B., Kwon, M.-H., Kirtman, B., and Jin, F.-F.: El Niño in a changing
25
climate, Nature, 461, 511–514, 2009.
Zhang, C.: Madden–Julian oscillation, Rev. Geophys., 43, RG2003, doi:10.1029/2004RG000158, 2005.
Zhang, C. and Gottschalck, J.: SST Anomalies of ENSO and the Madden–Julian oscillation in the equatorial Pacific, J. Climate, 15, 2429–2445, 2002.
BGD
12, 4405–4431, 2015Response of CO2and
H2O fluxes of a
mountainous tropical rain forest
A. Olchev et al.
Title Page
Abstract Introduction
Conclusions References
Tables Figures
◭ ◮
◭ ◮
Back Close
Full Screen / Esc
Printer-friendly Version
Interactive Discussion
Discussion
P
a
per
|
Discussion
P
a
per
|
Discussion
P
a
per
|
Discussion
P
a
per
|