www.atmos-chem-phys.net/14/1299/2014/ doi:10.5194/acp-14-1299-2014
© Author(s) 2014. CC Attribution 3.0 License.
Atmospheric
Chemistry
and Physics
Radical chemistry at night: comparisons between observed and
modelled HO
x
, NO
3
and N
2
O
5
during the RONOCO project
D. Stone1, M. J. Evans2,3, H. Walker1, T. Ingham1,4, S. Vaughan1, B. Ouyang5, O. J. Kennedy5, M. W. McLeod5, R. L. Jones5, J. Hopkins2,3, S. Punjabi3, R. Lidster3, J. F. Hamilton2,3, J. D. Lee2,3, A. C. Lewis2,3, L. J. Carpenter2,3, G. Forster6, D. E. Oram6,7, C. E. Reeves6,7, S. Bauguitte8, W. Morgan9,10, H. Coe9,10, E. Aruffo11,12,
C. Dari-Salisburgo11, F. Giammaria12, P. Di Carlo11,12, and D. E. Heard1,4
1School of Chemistry, University of Leeds, Leeds, UK
2National Centre for Atmospheric Science, University of York, York, UK 3Department of Chemistry, University of York, York, UK
4National Centre for Atmospheric Science, University of Leeds, Leeds, UK 5Department of Chemistry, University of Cambridge, Cambridgeshire, UK 6School of Environmental Sciences, University of East Anglia, Norwich, UK 7National Centre for Atmospheric Science, University of East Anglia, Norwich, UK 8Facility for Airborne Atmospheric Measurements, Bedfordshire, UK
9School of Earth Atmospheric and Environmental Science, University of Manchester, Manchester, UK 10National Centre for Atmospheric Science, University of Manchester, Manchester, UK
11Center of Excellence CETEMPS Universita’ degli studi di L’Aquila, L’Aquila, Italy 12Dipartimento di Fisica, Universita’ degli studi di L’Aquila, L’Aquila, Italy
Correspondence to:D. Stone ([email protected])
Received: 26 March 2013 – Published in Atmos. Chem. Phys. Discuss.: 11 April 2013 Revised: 9 December 2013 – Accepted: 10 December 2013 – Published: 5 February 2014
Abstract.The RONOCO (ROle of Nighttime chemistry in controlling the Oxidising Capacity of the AtmOsphere) air-craft campaign during July 2010 and January 2011 made ob-servations of OH, HO2, NO3, N2O5 and a number of
sup-porting measurements at night over the UK, and reflects the first simultaneous airborne measurements of these species. We compare the observed concentrations of these short-lived species with those calculated by a box model constrained by the concentrations of the longer lived species using a detailed chemical scheme. OH concentrations were below the limit of detection, consistent with model predictions. The model systematically underpredicts HO2by∼200 % and
overpre-dicts NO3 and N2O5by around 80 and 50 %, respectively.
Cycling between NO3 and N2O5 is fast and thus we
de-fine the NO3x(NO3x =NO3+N2O5)family. Production of
NO3x is overwhelmingly dominated by the reaction of NO2
with O3, whereas its loss is dominated by aerosol uptake of
N2O5, with NO3+VOCs (volatile organic compounds) and
NO3+RO2 playing smaller roles. The production of HOx
and ROxradicals is mainly due to the reaction of NO3with
VOCs. The loss of these radicals occurs through a combina-tion of HO2+RO2 reactions, heterogeneous processes and
production of HNO3from OH+NO2, with radical
propaga-tion primarily achieved through reacpropaga-tions of NO3with
per-oxy radicals. Thus NO3at night plays a similar role to both
OH and NO during the day in that it both initiates ROxradical
production and acts to propagate the tropospheric oxidation chain. Model sensitivity to the N2O5aerosol uptake
coeffi-cient (γN2O5)is discussed and we find that a value ofγN2O5 = 0.05 improves model simulations for NO3and N2O5, but that
these improvements are at the expense of model success for HO2. Improvements to model simulations for HO2, NO3and
N2O5 can be realised simultaneously on inclusion of
1 Introduction
Fundamentally the troposphere acts to oxidise emitted com-pounds through multiple steps until their volatility or solubil-ity drops sufficiently for them to condense to form aerosol, be removed through contact with the ground or by clouds, or be absorbed by the biosphere or oceans. This oxidation chem-istry is of fundamental importance for air quality, climate, food security and ecosystem services. Primary pollutants, such as CH4, volatile organic compounds (VOCs), oxides of
nitrogen and SO2, are removed by oxidation while secondary
pollutants such as O3and secondary organic aerosol (SOA)
are produced as part of the oxidation chain.
During the day, atmospheric oxidation is initiated by pho-tochemical processes, notably the solar photolysis of O3 to
produce electronically excited oxygen atoms (O(1D)) that subsequently react with water vapour to produce OH. Over the last few decades there has been extensive research into the processes producing these oxidants and their subsequent chemistry (see for example Stone et al., 2012 and references therein). Much less emphasis has been placed on understand-ing nighttime oxidation chemistry and the role of radical species at night.
When primary production of OH by solar photolysis can-not occur, other oxidants dominate, can-notably O3and NO3
(Mi-helcic et al., 1993; Carslaw et al., 1997; Salisbury et al., 2001; Fleming et al., 2006; Warneke et al., 2004; Brown et al., 2009, 2011).
Ozone-initiated oxidation of gas phase compounds is pri-marily limited to alkenes, where ozonolysis of the C=C dou-ble bond initiates the oxidation. Ozonolysis has been inves-tigated in a range of studies in laboratory, chamber and field studies (Salisbury et al., 2001; Fleming et al., 2006; Som-mariva et al., 2007; Kanaya et al., 1999, 2002, 2007a; Geyer et al., 2003; Malkin et al., 2010; Johnson and Marston, 2008), and has been shown to be responsible for production of OH and HO2radicals at night (Salisbury et al., 2001; Fleming et
al., 2006; Sommariva et al., 2007; Kanaya et al., 1999, 2002, 2007a; Emmerson and Carslaw, 2009; Ren et al., 2003, 2006; Volkamer et al., 2010).
The nitrate radical (NO3)is produced by the reaction
be-tween O3and NO2. During the day, NO3is rapidly
photol-ysed, leading to low daytime concentrations (Wayne et al., 1991; Brown and Stutz, 2012). However, during the night, NO3can accumulate, and a rapid equilibrium with N2O5is
established through the production of N2O5via NO3+NO2
followed by rapid thermal decomposition of N2O5 back to
NO3and NO2(Wayne et al., 1991; Brown and Stutz, 2012).
Losses of N2O5are primarily due to reactions on aerosol
sur-faces, and there is thus much interest in determination of the aerosol uptake coefficient for N2O5on atmospheric aerosols
(Brown et al., 2006, 2009, 2011; Escoreia et al., 2010; Tang et al., 2010; Badger et al., 2006; Thornton and Abbatt, 2005; Hallquist et al., 2003; Thornton et al., 2003; Kane et al., 2001; Hu and Abbatt, 1997; Fried et al., 1994; Van Doren
et al., 1991; Hanson and Ravishankara, 1991; Mozurkewich and Calvert, 1998). NO3 radicals can react with a range
of species, including alkenes, aldehydes and ROx radicals
(Wayne et al., 1991; Brown and Stutz, 2012).
Although the initiation of nighttime chemistry by the reac-tions between NO3and O3with a range of VOCs is relatively
well characterised, the subsequent chemistry has received relatively little attention. Measurements of NO3 have been
overestimated by model calculations in several studies (Mi-helcic et al., 1993; Sommariva et al., 2006, 2007), with those of nighttime OH and HO2radicals typically underestimated,
indicating poor understanding of nighttime tropospheric ox-idation processes (Kanaya et al., 1999, 2002, 2007a, b; Em-merson and Carslaw, 2009; Geyer et al., 2003; Faloona et al., 2001; Martinez et al., 2003; Ren et al., 2006).
While a number of nighttime studies at ground level close to local sources of NO have observed a limited role of NO3
in nighttime radical production owing to surface losses of NO3and the rapid reaction between NO3and NO (Salisbury
et al., 2001; Fleming et al., 2006; Sommariva et al., 2007; Kanaya et al., 1999, 2002, 2007a, b; Emmerson and Carslaw, 2009; Faloona et al., 2001; Martinez et al., 2003; Ren et al., 2003, 2005, 2006; Volkamer et al., 2010), several studies of NO3 and N2O5 above ground level and in more remote
re-gions have indicated a more significant role for NO3in
night-time radical production and tropospheric oxidation (Platt et al., 1980; Povey et al., 1998; South et al., 1998; Aliwell et al., 1998; Allan et al., 2002; Stutz et al., 2004; Warneke et al., 2004; Brown et al., 2003, 2004, 2006, 2007, 2009, 2011; Aldener et al., 2006; Sommariva et al., 2009; Stutz et al., 2010).
Measurements of NO3 and N2O5 were made downwind
of New York City during the New England Air Quality Study (NEAQS) by cavity ringdown spectroscopy (CRDS) onboard the National Oceanic and Atmospheric Administra-tion (NOAA) research vessel (R/V)Ronald H. Brownin sum-mers 2002 (Warneke et al., 2004; Brown et al., 2004; Aldener et al., 2006) and 2004 (Sommariva et al., 2009). While mea-surements of nighttime composition in New York City led to the conclusion that O3-initiated oxidation processes were
dominant at night (Ren et al., 2003, 2006), those made dur-ing NEAQS indicated little influence of O3-initiated VOC
oxidation at night, with oxidation of biogenic VOCs dom-inated by NO3 (Warneke et al., 2004). Although OH was
not measured during NEAQS, the total VOC loss rate ow-ing to reaction with OH over a 24 h period was expected to be 1.7×106cm−3s−1, compared to the measured value
of 1×106cm−3s−1for NO
3 (Warneke et al., 2004).
Con-version of NOx to HNO3 at night through NO3 and N2O5
was also found to occur at a comparable rate to that observed during daytime through the OH+NO2 reaction,
emphasis-ing the importance of nighttime chemistry for determination of NOx budgets and O3 production (Warneke et al., 2004;
Modelling of NEAQS 2004 shipborne data using the Mas-ter Chemical Mechanism (MCM) (http://mcm.leeds.ac.uk/ MCM/home.htt) (Jenkin et al., 2003; Saunders et al., 2003) demonstrated the importance of peroxy radicals for NO3
loss, with NO3+RO2 reactions representing a median of
15 % of the total calculated NO3gas phase loss, and at times
up to 60 % of the total NO3 loss (Sommariva et al., 2006).
However, the total sinks for NO3and N2O5were still
under-predicted, leading to overpredictions of 30–50 % of observed NO3and N2O5concentrations (Sommariva et al., 2006).
The NEAQS 2004 aircraft measurements of NO3 and
N2O5were significantly higher than the few ppt typically
re-ported at the surface, with the aircraft observations reaching 400 ppt NO3and 3.1 ppb N2O5 (Brown et al., 2006, 2007,
2009). The high NO3 concentrations aloft during NEAQS
2004 resulted in significant nighttime oxidation of isoprene emissions, with ∼20 % of isoprene emissions oxidised at night, with over 90 % initiated by NO3(Brown et al., 2009).
It was suggested that NO3-initiated oxidation of isoprene
could easily dominate isoprene loss on a regional scale, and it was found that isoprene secondary organic aerosol (SOA) mass derived from NO3oxidation was 50 % higher than that
from OH oxidation (Brown et al., 2009). These observations of NO3and N2O5loss processes over a wide range of
condi-tions also demonstrated that the uptake coefficient for N2O5
(γN2O5) on aerosol particles displays a strong dependence on aerosol composition (Brown et al., 2006). A steady state analysis of NO3and N2O5sinks (Brown et al., 2003; Brown
et al., 2006) indicated that theγN2O5 can vary by over an or-der of magnitude, largely dependent on the sulfate mass or sulfate to organic ratio of the aerosol (Brown et al., 2006).
High mixing ratios of NO3and N2O5(up to 400 ppt and
2 ppb, respectively) were also reported in a subsequent air-craft study using the NOAA P-3 airair-craft during the Texas Air Quality Study (TexAQS) in 2006 (Brown et al., 2011). Bud-get analyses for the campaign indicated that VOC oxidation at night was rapid, with the total rate of NO3-initiated
oxi-dation typically 3 to 5 times that initiated by O3, and NO3
reactivity indicating the presence of unmeasured plumes of highly reactive VOCs (Brown et al., 2011). Loss of NO3
was dominated by its chemistry with unsaturated VOCs, with only 14 to 28 % of NO3 loss occurring indirectly through
heterogeneous chemistry of N2O5, although significant
un-certainties in the N2O5aerosol uptake coefficient were noted
(Brown et al., 2011). Reactions of NO3with peroxy radicals
were estimated as contributing between 1 and 4 % of the to-tal NO3loss, although no direct measurements of RO2were
available, with measurements of PAN (peroxy acetyl nitrate) used to estimate RO2 concentrations as being equal to the
acetylperoxy (CH3C(O)O2)radical concentration produced
by thermal decomposition of PAN (Brown et al., 2011). Shipborne measurements of NO3 and total peroxy
radi-cals (HO2+6RO2)were also made during the TexAQS 2006
campaign onboard the R/VRonald H. Brownalong the US Gulf Coast (Sommariva et al., 2011). Detailed box modelling
of the observations using the MCM showed that NO3+RO2
reactions represented, on average, 12–28 % of the total NO3
sink in relatively unpolluted regions, but that the model un-derestimated NO3and showed high variability in its ability to
reproduce observed nighttime concentrations of peroxy radi-cals (Sommariva et al., 2011).
Previous studies have shown that nighttime chemistry plays a significant role in defining the chemistry of the tro-posphere. However, there are significant uncertainties in the chemistry of the atmosphere at night. Many of these uncer-tainties are due to the lack of simultaneous observations of OH, HO2, NO3 and N2O5. Those observations that do
ex-ist often occur within the centres of cities where NO emis-sions are high, with NO3concentrations thus kept low. These
“inner city” conditions are not representative of most of the planet and thus do not offer suitable conditions for an evalu-ation of our understanding of nighttime chemistry.
In this paper we take advantage of simultaneous aircraft measurements of the short-lived species OH, HO2, NO3and
N2O5, together with the concentrations of long-lived
compo-nents made away from recent emissions to analyse our un-derstanding of nighttime chemistry as manifested by a con-strained box model. Observations of the short-lived species enable assessment of the chemical schemes used in atmo-spheric models since their concentrations are relatively un-affected by transport processes and are controlled by lo-cal chemistry alone (Heard and Pilling, 2003; Stone et al., 2012). Comparison of observed concentrations of short-lived species with calculated concentrations, particularly from de-tailed box model simulations, thus enables evaluation of our understanding of chemical processes occurring in the atmo-sphere, making the short-lived species ideal model targets (Heard and Pilling, 2003; Stone et al., 2012).
We provide a brief overview of the campaign in Sect. 2 and measurement techniques in Sect. 3, followed by a descrip-tion of the model approach in Sect. 4. In Sect. 5 we describe comparisons between modelled and observed concentrations and in Sect. 6 examine the processes controlling atmospheric composition at night. Potential sources of model uncertainty are discussed in Sect. 7, with suggestions for future work in Sect. 8 and conclusions drawn in Sect. 9.
2 The RONOCO Campaign
atmospheric chemistry at night, and ultimately to facilitate assessment of the regional and global impacts of nighttime chemistry on air quality and climate change.
Measurements of HOxwere made on 16 flights throughout
the campaign (7 flights in July 2010 and 9 flights in January 2011), while measurements of NO3 and N2O5 were made
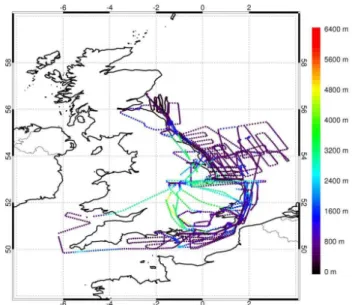
on 17 flights (9 flights in July 2010 and 8 flights in January 2011). In our analysis we combine all of these flights into a single data set. Figure 1 shows the locations of HOx, NO3
and N2O5measurements made during RONOCO. We focus
here on the analysis of measurements made at night, defined as periods when the solar zenith angle was greater than 99◦, and thus do not include data from flights made in daylight hours or during dawn or dusk periods. Data from flight B537 (20 July 2010) has also been excluded from our analysis ow-ing to a number of atypical observations durow-ing this flight which are discussed elsewhere (Kennedy et al., 2011; Walker et al., 2014).
3 Measurements during RONOCO
3.1 Detection of OH and HO2
OH and HO2radicals were measured by laser-induced
rescence (LIF) spectroscopy at low pressure using the fluo-rescence assay by gas expansion (FAGE) technique (Heard and Pilling, 2003). The instrument has been described in de-tail elsewhere (Commane et al., 2010; Stone et al., 2011), and only a brief description is given here.
Ambient air from the aircraft exterior is drawn into a fluo-rescence cell maintained at pressures ranging from 1.9 Torr at sea level to 1.2 Torr at 6 km altitude. The fluorescence cell has two excitation axes, with excess NO added at the second axis to titrate HO2 to OH, enabling simultaneous
detection of OH and HO2. OH radicals in both excitation
axes are excited by laser light atλ∼308 nm, generated by
a solid state Nd:YAG (neodymium yttrium aluminum gar-net) pumped Ti:sapphire laser system which is frequency tripled (Bloss et al., 2003). Channel photomultiplier tubes coupled to gated photon counters were used to detect the A26+−X25i OH fluorescence signal atλ∼308 nm.
Calibration of the instrument is achieved by measure-ment of the fluorescence signal from known concentra-tions of OH and HO2, produced by the photolysis of
wa-ter vapour, and was performed over a range of condi-tions before and after the RONOCO campaign. The in-strument sensitivity to OH (COH) was determined to be
(2.9±0.45)×10−8s−1cm3mW−1 for the summer
cam-paign and (4.3±0.7)×10−8s−1cm3mW−1 for the winter
campaign. The instrument sensitivity to HO2 (CHO2) was determined to be (0.9±1.5)×10−7s−1cm3mW−1 for the
summer campaign and (1.2±0.21)×10−7s−1cm3mW−1
for the winter campaign. Calibration uncertainties (1σ) are on the order of 15 to 20 % for OH and HO2. For OH,
Fig. 1.Locations of the BAe 146 aircraft during the RONOCO cam-paign for which measurements of HO2* and NO3 or N2O5 are
available, coloured by altitude.
the 1σ limit of detection (LOD) was 1.8×106cm−3 for a
5 min averaging period during the summer campaign and 6.4×105cm−3 during the winter campaign. The HO2 1σ
LOD was 6.9×105cm−3for a 4 min averaging period
dur-ing the summer and 6.0×105cm−3 during the winter, and
is better than that for OH owing to lower losses on the walls of the sampling tube following the supersonic expan-sion. While instrument sensitivity does vary with the pressure in the detection cells, and thus with altitude, the cell pres-sures during RONOCO varied by less than 0.7 Torr (in the range 1.2–1.9 Torr). As discussed in detail by Commane et al. (2010), pressure dependent calibrations of the instrument are achieved by varying cell pressure using different sized pinholes through which ambient air is drawn into the instru-ment to control the flow of gas in the cell. Over the range of cell pressures encountered during RONOCO, there is little variation ofCOH orCHO2 (Commane et al., 2010), and val-ues reported here are thus the mean valval-ues determined during calibrations in this pressure range. Uncertainties associated with measurements of OH and HO2are 28–35 % (1σ) and
include the calibration uncertainites. Further details regard-ing the FAGE instrument and calibration procedures will be provided by Walker et al. (2014).
3.2 Detection of NO3and N2O5
NO3and N2O5were detected by broadband cavity enhanced
light source. Each cavity is coupled to a spectrometer inter-faced to a charge coupled device (CCD) detector by fibre op-tic bundles, where the wavelength dependent light intensity transmitted through the cavity is recorded.
NO3is identified and measured via its strongB2E′−X2A′2
electronic transition centred around 662 nm, with light pro-vided by a red light emitting diode (LED). N2O5is measured
in a separate cavity maintained at 80◦C following its thermal dissociation to NO3and NO2at 120◦C in a heater situated
prior to the cavity entrance, and thus measured as the sum of ambient NO3and thermally dissociated N2O5. The third
cav-ity enables detection of NO2using light provided by a blue
LED with output centred around 460 nm.
A crystalline source of N2O5, stabilised at temperatures
between −80 and −77◦C, was used to provide known amounts of NO3and N2O5to facilitate calibration of the
in-strument in the laboratory. The in-flight 1σLOD (determined at a pressure of 0.7 bar) for NO3was found to be 1.1 ppt for
a 1 s integration time, with a corresponding LOD of 2.4 ppt for the sum of NO3+N2O5.
3.3 Supporting measurements
Measurements from several other instruments onboard the BAe 146 during the RONOCO campaign have been used in the analysis presented here. Details of these supporting mea-surements are summarised in Table 1.
4 Model approach
Observations of OH, HO2, NO3 and N2O5 have been
in-terpreted using the Dynamically Simple Model of Atmo-spheric Chemical Complexity (DSMACC), which is de-scribed in detail by Emmerson and Evans (2009) and Stone et al. (2010). DSMACC is a zero-dimensional model using the kinetic pre-processor (KPP) (Sandu and Sander, 2006), and in this work uses a chemistry scheme described by the MCM v3.2 (http://mcm.leeds.ac.uk/MCM/home.htt) (Jenkin et al., 2003; Saunders et al., 2003). The full MCM contains near explicit degradation schemes for 143 primary species, resulting in 6700 species in approximately 17 000 reactions and representing the most detailed and comprehensive chem-istry scheme available for modelling tropospheric composi-tion. Simulations reported here use degradation chemistry for ethane, propane, iso-butane, n-butane, iso-pentane, n-pentane, sum of 2+3-methylpentane, n-hexane, n-heptane, n-octane, ethene, propene, acetylene, trans-2-butene, 1-butene, cis-2-butene, iso-butene, 1,3-butadiene, trans -2-pentene, 1--2-pentene, isoprene, benzene, toluene, ethylben-zene, xylene, methacrolein and acetone. The scheme used contains∼2000 species in∼8000 reactions.
Heterogeneous loss of several species (OH, HO2, CH3O2,
NO3, N2O5and HNO3)to aerosol surfaces was represented
in the model by parameterisation of a first-order loss process to the aerosol surface (Schwarz, 1986):
k′=
r
Dg + 4
γxcg
−1
A, (1)
wherek′is the first-order rate coefficient for heterogeneous loss,r is the aerosol particle effective radius,Dg is the gas
phase diffusion coefficient (Eq. 2),γxis the uptake
coeffi-cient for species X,cgis the mean molecular speed (Eq. 3),
andAis the aerosol surface area per unit volume.Dgis given
by
Dg=
3 NAdg2ρair
s
RT mair
2π
m
g+mair
mg
, (2)
whereNAis Avogadro’s number,dgis the diameter of the gas
molecule,ρairis the density of air,Ris the gas constant, and
mgandmairare the molar masses of gas and air, respectively.
cgis given by
cg=
8RT π Mw
1/2
, (3)
whereT is the temperature andMwis the molecular weight
of the gas. For HO2,γHO2=0.028 is used based on the mean value reported by the parameterisation by Macintyre and Evans (2011). For NO3, a value ofγNO3=0.001 is used. For N2O5,γN2O5=0.02 is used in our base simulations, based on the mean value reported from the parameterisation by Evans and Jacob (2005). Model sensitivity toγN2O5 is discussed in Sect. 7.2.
An additional first-order loss process for each species in the model is also included to represent deposition processes, with the first-order rate set to be equivalent to a lifetime of ap-proximately 24 h. Model sensitivity to this parameter is dis-cussed in Sect. 7.1.
All aircraft measurements are merged onto a 60 s time-base. Time points with observations of OH or HO2 are
modelled if observations of physical state (latitude, longi-tude, pressure, temperature and water vapour concentration), aerosol surface area and concentrations of CO, O3, NO2,
NO3and VOCs are available. We perform 1648 simulations
in total. For each 60 s time period, we use the observed con-centrations of the constrained species, appropriately aver-aged over that time period, to run the simulation. We then compare with the appropriately averaged values of HO2,
NO3and N2O5over that time period. A summary of species
used to constrain the model is given in Table 2. Observed concentrations of CO, O3, H2O, VOCs and aerosol surface
area for each 60 s time point are fixed and held constant throughout the corresponding model run, with concentra-tions of CH4and H2kept constant at values of 1770 (NOAA
Table 1.Supporting measurements made onboard the BAe 146 aircraft during the RONOCO project and used in the model analysis presented here.aThe NO2measurements used to constrain the model were made by the LIF instrument (Dari-Salisburgo et al., 2009; Di Carlo et al.,
2013).6ANs – sum of alkyl nitrates;6PNs – sum of peroxy nitrates; PAN – peroxy acetyl nitrate; VOCs – volatile organic compounds.
bAerosol surface area is estimated for ambient relative humidity based on the measured dry size distribution and composition.cThe total
surface area SMPS+PCASP is within 10 % of the total using the SMPS data alone. Note that the aerosol measurements do not show any evidence for enhanced coarse model aerosol at low altitudes, indicating the aircraft did not enter the marine boundary layer.
Species measured
Technique Time resolution and limit of detection
(LOD)
Reference
OH, HO2 Detection of OH by LIF using FAGE;
conversion of HO2to OH in excess NO,
detection of OH by LIF-FAGE.
For OH, 1.8×106cm−3 LOD for a 5 min averaging period during sum-mer; 6.4×105cm−3 during winter. For HO2, 6.9×105cm−3 LOD for a
4 min averaging period during summer; 6.0×105cm−3during winter.
Commane et al. (2010)
NO3,
N2O5
BBCEAS of NO3; thermal dissociation
of N2O5 to NO3+NO2, detection of NO3by BBCEAS.
1 s resolution; 1.1 ppt LOD for NO3;
2.4 ppt LOD for NO3+N2O5.
Kennedy et al. (2011)
CO Aero Laser AL5002 Fast Carbon Monoxide Monitor.
3.5 ppb LOD at 1 s resolution. Gerbig et al. (1999)
O3 TECO 49C UV absorption. 1 s resolution; 0.6 ppb LOD. Hewitt et al. (2010)
NO, NO2a FAAM fast NOx instrument; TECO
42C analyser using heated molybde-num filament to convert NO2 to NO
with detection of NO by chemilumines-cence.
10 s resolution; 3 ppt LOD for NO, 15 ppt LOD for NO2.
Brough et al. (2003)
NO2a, 6ANs, 6PNs
Thermal decomposition of6ANs and 6PNs to NO2; detection of NO2 by
LIF.
1 s resolution; LODs 9.8 ppt for NO2,
28.1 ppt for6ANs, 18.4 ppt for6PNs.
Dari-Salisburgo et al. (2009); Di Carlo et al. (2013)
PAN Gas chromatography with electron cap-ture detection.
90 s resolution; 5 ppt LOD. Whalley et al. (2004)
VOCs Gas chromatography with flame ionisa-tion detecionisa-tion (GC-FID).
Variable. Hopkins et al. (2003)
Aerosol surface areab
SMPS for particles of diameter 20– 350 nm and passive cavity aerosol spec-trometer probe (PCASP) for particles with diameter > 350 nmc.
60 s resolution; uncertainty of±30 %. Hewitt et al. (2010); Wiedensohler et al. (2012)
550 ppb (Ehhalt and Rohrer, 2009; Novelli et al., 1999) re-spectively. Species which were not observed are set initially to zero in the model.
Constraints on nitrogen oxides (NO, NO2, NO3, N2O5,
HONO and HO2NO2) were applied using the method
de-scribed by Stone et al. (2010), with the primary constraint placed on NO2. Thus, the initial concentration of NO2in the
model is set to its observed value and the concentrations of all nitrogen oxide species, including NO2, are permitted to
vary according to their photochemistry as the model runs forwards. At the end of each 24 h period in the model, the calculated concentration of NO2is compared to its observed
concentration, and the concentrations of all nitrogen oxide species are fractionally increased or decreased such that the
modelled and observed concentrations of NO2are the same.
The model is integrated forwards in time with diurnally vary-ing photolysis rates until a diurnal steady state is reached, typically requiring between 5 and 10 days. Thus at the point of comparison between the model and observations we have a modelled NO2concentration equal to the observed
concen-tration, together with concentrations of the other NOxspecies
(NO, NO3, N2O5, HONO, HO2NO2) consistent with that
NO2concentration, the concentration of the other measured
species, and the time since darkness fell.
Following the work of Fuchs et al. (2011), model cal-culations described in this work include representation of potential RO2 interferences in LIF measurements of HO2.
–
–
–
–
Error bars are the 1σ calibration uncertainties.
Fig. 2.Comparison of modelled and observed concentrations of(a)HO2* (all data), [HO2*]mod={(0.5±0.1)×[HO2*]obs}+(3.0±2.2)
× 106cm−3 (r2=0.1); (b) HO2* (summer data), [HO2*]mod= {(0.5±0.1)×[HO2*]obs}+(0.3±3.1)×106 cm−3 (r2=0.1); (c) HO2* (winter data), [HO2*]mod = {(0.4±0.2)×[HO2*]obs}+(7.5±4.4)×106 cm−3 (r2=0.02);(d) NO3 (all data), [NO3]mod=
{(1.8±0.2)×[NO3]obs}– (2.3±3.6) ppt (r2=0.3); (e) NO3 (summer data), [NO3]mod= {(2.0 ± 0.3)×[NO3]obs}– (9.9±6.0) ppt (r2=0.2);(f)NO3(winter data), [NO3]mod={(2.2±0.4)×[NO3]obs}+(1.3±4.1) ppt (r2=0.3);(g)N2O5(all data), [N2O5]mod=
{(1.5±0.1)×[N2O5]mod} – (42.4±19.7) ppt (r2=0.6); (h) N2O5 (summer data), [N2O5]mod = {(1.6±0.2)×[N2O5]mod}–
(0.2±18.1) ppt (r2=0.3);(i)N2O5(winter data), [N2O5]mod={(1.4±0.2)×[N2O5]mod}+(52.4±43.2) ppt (r2=0.8). In each plot,
the solid red line indicates the 1:1 line, with 50 % limits given by the broken red lines. The best fit lines are shown in blue. Errors bars are 1σ.
HO2*, where HO2* =HO2+fRO2, with the factorf
de-rived from a combination of experimental parameters and MCM chemistry, as described in the appendix. For the RONOCO campaign, potential interferences in HO2
mea-surements are expected to be small on average, with HO2* =[1.15×HO2]+2×105cm−3.
5 Model performance
Figures 2 and 3 show the model performance for HO2*, NO3
and N2O5. Modelled concentrations of OH were on the
or-der of 104cm−3(mean=(2.4±2.3)×104cm−3; median=
1.7×104cm−3)and were consistently below the 1σ
instru-mental limits of detection of 1.8×106cm−3in summer and
6.4×105cm−3in winter (for 5 min averaging periods). We
do not consider the model performance for OH in any more detail.
The model displays a tendency to underpredict HO2* and
overpredict NO3and N2O5, as shown in Fig. 2. For HO2*,
the line of best fit for the campaign average is given by [HO2*]mod={(0.5±0.1)×[HO2*]obs}+(3.0±2.2)×106
cm−3(r2=0.1), with the campaign average for NO3given
by [NO3]mod= {(1.8±0.2)×[NO3]obs} – (2.3±3.6) ppt
(r2=0.3) and the campaign average best fit line for N2O5
described by [N2O5]mod= {(1.5±0.1)×[N2O5]mod} –
(42.4±19.7) ppt (r2=0.6). As shown in Fig. 2,
Figure 3: Time series of observed (black) and modelled (red) concentrations of (a) HO * during
campaign. Error bars are the 1σ calibration uncertainties.
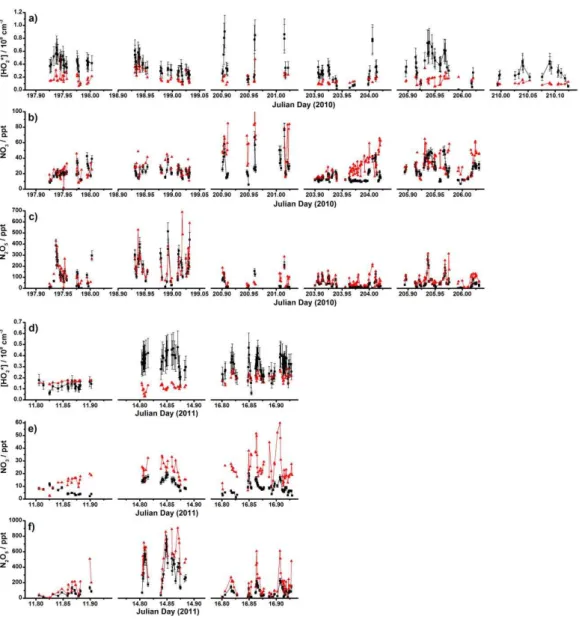
Fig. 3.Time series of observed (black) and modelled (red) concentrations of(a)HO2* during the summer campaign,(b)NO3during the
summer campaign,(c)N2O5during the summer campaign,(d)HO2* during the winter campaign,(e)NO3during the winter campaign, and
(f)N2O5during the winter campaign. Errors bars are 1σ. Data for NO3and N2O5above 100 and 1000 ppt, respectively, are not shown for
clarity (< 6 data points in total).
summer campaigns. The modelled lifetime of HO2* was
(209±52) s−1on average for the entire data set (median=
209 s−1), (198±52) s−1 (median = 200 s−1)for the sum-mer campaign, and (223±49) s−1(median =216 s−1)for the winter campaign. For NO3, the modelled lifetime was
(51±59) s−1 on average for the entire data set (median = 35 s−1), (46±40) s−1 (median = 36 s−1) for the sum-mer campaign, and (60±88) s−1 (median = 30 s−1) for the winter campaign. For N2O5, the modelled lifetime was
(147±124) s−1on average for the entire data set (median=
101 s−1), (88±29) s−1 (median=85 s−1)for the summer
campaign, and (284±148) s−1(median=221 s−1)for the
winter campaign.
Figure 4 shows the modelled to observed ratios for HO2*,
NO3and N2O5as a function of altitude. Since the majority
of data were recorded over a small altitude range, there is little evidence of any relationship between model success and altitude. The relationships between the modelled to observed ratios for N2O5and NO3, HO2and NO3, and HO2and N2O5,
are given in Fig. 5.
Model underpredictions for nighttime HO2 of a similar
magnitude have been observed in a number of previous stud-ies, and, where observations are available, model underpre-dictions of HO2 tend to coincide with underpredictions of
RO2 and overpredictions of NO3. Measurements of peroxy
Table 2.Summary of observations used to constrain the model in this work and, in the case of HO2*, NO3and N2O5, to compare
with model calculations. Zero values indicate measurements below the instrumental limits of detection.
Species Mean±1σ Median Range
O3/ppb 37.0±8.1 35.5 11–63 CO/ppb 110.4±27.1 99.9 71–250 H2O/ppm 10 418±2425 10 491 178–15 509 NO2/ ppt 1614.4±1749.2 946.7 66–14 570
NO/ppt 24.6±278.9 0 0–4501
ethane/ppt 1109.5±882.0 940.8 0–3208 propane/ppt 414.0±416.5 235.9 0–1770
iso-butane/ppt 94.4±91.3 73.0 0–372
n-butane/ppt 171.7±162.2 140.8 0–726
iso-pentane/ppt 80.9±139.6 70.5 0–2176
n-pentane/ppt 50.4±57.1 38.4 0–455 methylpentanes/ppt 28.3±31.2 21.3 0–224
n-hexane/ppt 17.0±18.3 11.9 0–135
n-heptane/ppt 6.9±10.1 5.7 0–146
n-octane/ppt 2.6±4.5 0 0–45 ethene/ppt 130.5±121.2 117.6 0–590 propene/ppt 30.9±45.4 12.0 0–239 acetylene/ppt 158.9±161.0 96.8 0–516
trans-2-butene/ppt 3.2±2.1 3.8 0–10 1-butene/ppt 6.7±7.7 5.5 0–75
iso-butene/ppt 5.4±8.4 4.9 0–137
cis-2-butene/ppt 0.1±0.6 0 0–7 1,3-butadiene/ppt 2.8±17.1 0 0–230
trans-2-pentene/ppt 0.1±0.7 0 0–11 1-pentene/ppt 0.9±2.5 0 0–24 isoprene/ppt 0.9±3.2 0 0–40 benzene/ppt 47.9±58.7 21.1 0–458 toluene/ppt 40.5±57.1 34.0 0–773 ethylbenzene/ppt 8.5±13.3 6.0 0–178
m-xylene/ppt 18.1±42.1 6.4 0–693
o-xylene/ppt 6.1±17.2 0 0–268 methacrolein/ppt 7.3±27.9 0 0–325 acetone/ppt 444.0±616.0 257.9 0–8073 PAN/ppt 31.2±44.2 19.0 0–234 HO2*/108cm−3 0.33±0.16 0.32 0.001–0.91 NO3/ppt 18.9±12.0 16.16 0.29–76.85 N2O5/ppt 119.87±131.02 72.0 6.35–726.353
by a factor of ∼2, with discrepancies for both NO3 and
peroxy radicals reconciled by consideration of the impact of unmeasured monoterpenes (Mihelcic et al., 1993). Ob-servations of HO2 at night on Rishiri Island, Japan, were
strongly correlated with monoterpene emissions (Kanaya et al., 2002, 2007a) and were also generally underestimated by model calculations (Kanaya et al., 1999, 2002, 2007). Model calculations for the Southern Oxidant Study (SOS) in Nashville, USA, underpredicted nighttime observations of HO2 by factors of 2–8, partly owing to the limited
NO3+VOC and NO3+RO2chemistry in the model
(Mar-tinez et al., 2003). Model underpredictions for nighttime HO2 have also been reported for campaigns near London
(Emmerson and Carslaw, 2009), in New York (Ren et al., 2003, 2006) and Tokyo (Kanaya et al., 2007b), with
inves-re 4: Modelled to observed ratios as a function of altitude for (a) HO , (b) NO and
– –
Fig. 4.Modelled to observed ratios as a function of altitude for(a) HO2*,(b)NO3and(c)N2O5. There are limited data above
alti-tudes of 2000 m, and data above 2000 m are not shown for clarity.
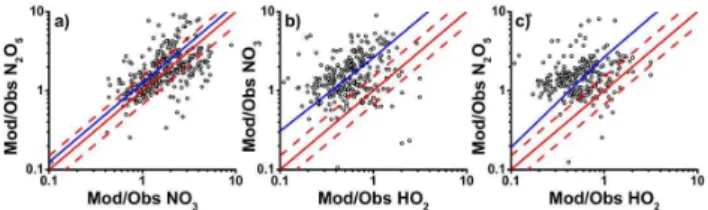
: Relationships between modelled to observed ratios for (a) NO and N O , (b) HO *
– –
Fig. 5.Relationships between modelled to observed ratios for(a) NO3 and N2O5, (b) HO2* and NO3, and (c)HO2* and N2O5
for summer and winter data combined. In each plot, the solid red line indicates the 1:1 line, with 50 % limits given by the broken red lines. The best fit lines are given in blue, and are described by (a)y=(1.3±0.2)x– (0.4±0.3),r2=0.2;(b)y=(2.6±0.5)x+ (0.3±0.1),r2=0.1; and(c)y=(2.8±0.7)x – (0.1±0.5),r2= 0.02.
tigation of the model discrepancy for the Tokyo campaign indicating the presence of unmeasured VOCs which, if in-cluded in the model, could reconcile the modelled HO2with
the observations (Kanaya et al., 2007). The presence of un-measured VOCs was also thought to be responsible for dis-crepancies between observed concentrations of NO3and
cal-culations of NO3reactivity from measured sources and sinks
during the TexAQS campaign (Brown et al., 2011).
In order to show the important processes occurring within the model and to thus provide insights into improving model fidelity we now diagnose the chemical processes occurring within the model. We start our analysis with the budgets of NO3and N2O5, we then turn our attention to the wider ROx
family and finally to HOx, HO2and OH.
6 Budget analyses
6.1 NO3and N2O5budgets
NO3 and N2O5rapidly interconvert through the reaction of
NO3with NO2and thermal decomposition of N2O5, with the
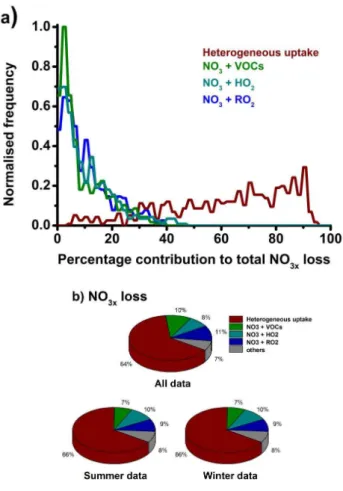
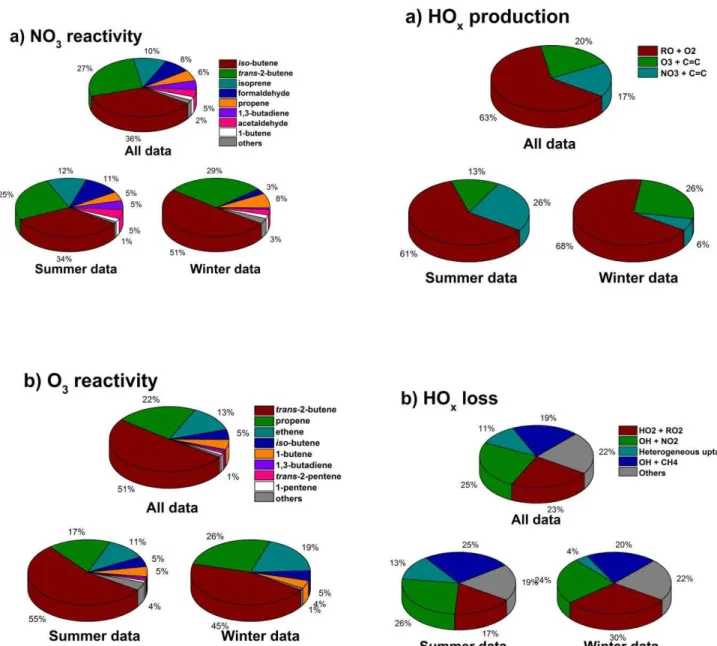
Fig. 6.Processes controlling losses of NO3x (i.e. NO3+N2O5)
in the model, displayed as (a) the probability distribution func-tions for the percentage contribufunc-tions to the total loss for hetero-geneous uptake of NO3x to aerosol surfaces (red), NO3+VOCs
(green), NO3+HO2 (light blue) and NO3+ RO2 (all organic
peroxy radicals) (dark blue); and (b) the summer and win-ter campaign means combined (upper panel), summer campaign mean (lower panel, left hand side) and winter campaign mean (lower panel, right hand side). The average total loss rate of NO3xwas (7.8±6.9)×105cm−3s−1(median=5.5×105cm−3
s−1) for the entire data set, (7.6±6.6)×105 cm−3s−1 (me-dian = 5.5×105cm−3s−1) for the summer campaign and (8.2±7.7)×105cm−3 s−1 (median = 6.0×105cm−3s−1) for the winter campaign.
on average during RONOCO, with a range of 1.0×10⁵ to
9.3×108cm−3s−1and median of 2.2×107cm−3s−1)than
the conversion between OH and HO2 (4.5×104cm−3s−1
on average during RONOCO, with a range of 2.9×10³ to 4.6×105cm−3s−1 and median of 4.0×104cm−3s−1).
This leads us to define the NO3x family, where NO3x=
NO3+N2O5. Production of NO3xoccurs almost exclusively
through the production of NO3 by O3+NO2, with minor
production channels (< 0.01 %) including OH+HNO3 and
reactions of Criegee biradicals with NO2.
Figure 6 shows the loss pathways for NO3x at night,
dis-played as the probability distribution functions for the
per-centage contribution of each process to the total NO3xloss.
The largest loss of NO3x is typically due to heterogeneous
processes, through the uptake and hydrolysis of N2O5 on
aerosol surfaces, representing 64 % of the total NO3xloss
av-eraged over all simulated data points. However, there is high variability in the fraction of the total loss through heteroge-neous processes, as displayed in Fig. 6. Reactions of NO3
with VOCs comprise 10 % of the total NO3xloss on average,
with a maximum value of 40 % when VOC concentrations are high and aerosol loadings low. Loss of NO3xthrough
re-actions of NO3with peroxy radicals represents 19 % of the
total (11 % from organic RO2and 8 % from HO2)on average,
but there are data points where the loss of NO3xthrough such
reactions reaches 71 %, with separate budget analyses for the winter and summer campaigns resulting in similar conclu-sions to the campaign average. Thus, although in a mean sense the loss of NO3x from the atmosphere is dominated
by the heterogeneous uptake of N2O5onto aerosol, there are
significant other processes which can dominate under certain conditions.
These results are consistent with previous studies. Mod-elling of the NEAQS 2004 shipborne campaign using the MCM revealed similar losses of NO3to RO2in the marine
boundary layer to those presented here, with a mean contri-bution of 19 % to the total gas phase NO3loss and a
max-imum of up to 60 % (Sommariva et al., 2009). In contrast, analysis of NO3budgets for the airborne TexAQS 2006
cam-paign suggested that only 1–4 % of the total NO3x loss
oc-curred as a result of reactions of NO3 with peroxy radicals
(Brown et al., 2011). However, no peroxy radical measure-ments were made during TexAQS, and RO2concentrations
were estimated using observations of PAN and its thermal de-composition rate, and were thus almost certainly a significant underestimate, as noted in the analysis (Brown et al., 2011). Model calculations in this work indicate that the peroxy rad-ical derived from thermal decomposition of PAN represents a maximum of 15 % of the total organic peroxy radical con-centration during RONOCO, with a median value of 0.3 %.
6.2 ROxradical budgets
ROx(RO2+RO+HO2+OH) radicals play a central role in
the nighttime chemistry of the troposphere. Figure 7 shows the production and loss processes for ROxradicals at night
during RONOCO (note that the discussion in this section concerns HO2and not HO2*). Initiation of radicals at night,
and thus of nighttime oxidation chemistry, is dominated by reactions of NO3with unsaturated VOCs, with a mean
cam-paign contribution of 80 % compared to 18 % for radical production by alkene ozonolysis reactions. Figure 8 shows that of the VOCs measured during the campaign (Table 2), the dominant species in terms of NO3 reactivity are iso
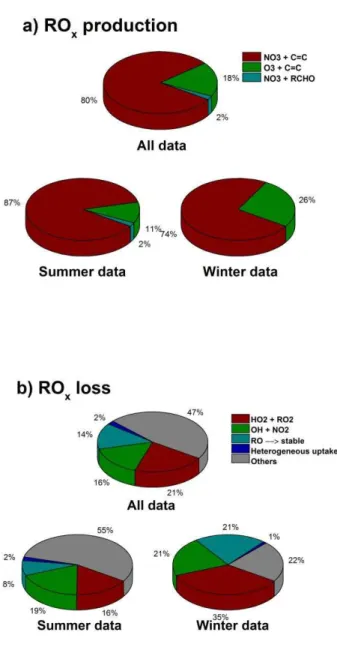
Fig. 7. Processes controlling the instantaneous production (a) and loss (b) of ROx (= RO+RO2+OH+HO2) radicals at
night. The upper panels show the summer and winter campaign means combined, with the lower panels showing the summer campaign means (left hand side) and winter campaign means (right hand side). The average total production rate of ROx was
(1.3±1.1)×105cm−3s−1 (median = 1.0×105cm−3s−1) for the entire data set, (1.6±1.4)×105cm−3s−1 (median = 1.2 × 105cm−3s−1) for the summer campaign and (1.0 ± 0.4)×105cm−3s−1 (median = 0.9 × 105cm−3s−1) for the winter campaign. The average total loss rate of ROx was
(1.6±1.2)×105 cm−3s−1 (median = 1.2×105cm−3s−1) for the entire data set, (1.9±1.4)×105cm−3s−1 (me-dian = 1.6×105cm−3s−1) for the summer campaign and (1.0±0.3)×105cm−3s−1 (median = 0.9×105cm−3s−1) for the winter campaign.
withtrans-2-butene (51 %), propene (22 %), ethene (13 %) andiso-butene (5 %). Reactions of NO3with aldehydes also
result in radical production at night, particularly during the winter campaign, with NO3+HCHO contributing the
great-est influence from aldehyde species.
Figure 7 shows that radical loss is controlled by a number of processes. Production of peroxides, through RO2+HO2
and HO2+HO2, represents 21 % of the ROx radical loss,
on average, followed by production of HNO3by OH+NO2
(16 %), decomposition reactions of RO radicals to produce stable products (14 %) and heterogeneous losses (2 %). The large fraction of remaining loss processes (47 % of the total) is comprised largely of a myriad of RONO2 and RO2NO2
production routes.
Overall, reactions of NO3with VOCs typically control the
production of radicals during the campaign, with the unsat-urated C4 compounds dominating. There are a significant
number of radical loss processes which produce organic ni-trogen compounds, peroxides and nitric acid.
6.3 HOxradical budgets
The processes controlling production and loss of nighttime HOx (HOx= OH+HO2) radicals during RONOCO are
shown in Fig. 9. Alkoxy radicals (RO), produced primarily following production of RO2 from NO3+alkene reactions
and the subsequent reactions of RO2with NO3, are a major
source of HOx, producing HO2through RO+O2reactions
and on average representing 63 % of the total HOx
produc-tion. Specifically, the reaction of methoxy radicals (CH3O)
with O2 dominates the HOx production from RO radicals
(31 % of the total HOx production), with CH3O primarily
produced at night by CH3O2+NO3, and nighttime CH3O2
production primarily occurring through OH-initiated oxida-tion of CH4(48 %) and alkene ozonolysis reactions (37 %).
Alkene ozonolysis reactions also produce OH and HO2
rad-icals directly through the decomposition of Criegee interme-diates, and are responsible for 20 % of the total HOx
produc-tion, although there is still much uncertainty regarding radi-cal yields from ozonolysis reactions (Johnson and Marston, 2008). A further 17 % of HOxradicals are generated as a
re-sult of direct HO2production by NO3+HCHO, using model
calculated HCHO concentrations.
Reactions of HO2 producing peroxides (HO2+RO2 and
HO2+HO2)and formation of HNO3by the reaction of OH
with NO2represent major sinks for HOxradicals,
compris-ing 23 and 25 % of the total loss, respectively. Heterogeneous loss of OH and HO2, primarily through aerosol uptake of
HO2, represents 11 % of the total HOxsink, and is more
sig-nificant during winter (contributing 13 % to the total HOx
loss) compared to summer (contributing 4 % to the total HOx
loss). The remainder of HOx loss occurs primarily through
reactions of OH with VOCs, with OH+CH4alone
Fig. 8.Reactivity of(a)NO3and(b)O3towards observed VOCs at night during the RONOCO project. The upper panels show the summer and winter campaign means combined, with the lower panels showing the summer campaign means (left hand side) and winter campaign means (right hand side). The average NO3
re-activity towards VOCs was 6.6×104cm−3s−1 (median = 5.3 × 104cm−3s−1) for the entire data set, 6.8 × 104cm−3s−1 (median = 4.6×104 cm−3s−1) for the summer campaign and 6.2×104cm−3s−1(median=6.0×104cm−3s−1)for the win-ter campaign. The average O3 reactivity towards VOCs was 2.1
× 104cm−3s−1 (median = 2.1×104 cm−3s−1) for the en-tire data set, 1.8×104cm−3s−1(median=1.7×104cm−3s−1) for the summer campaign and 2.9×104cm−3s−1 (median = 2.6×104cm−3s−1)for the winter campaign.
Fig. 9.Processes controlling the instantaneous production(a)and loss (b) of HOx (i.e. OH+HO2) radicals at night. The upper
panels show the summer and winter campaign means combined, with the lower panels showing the summer campaign means (left hand side) and winter campaign means (right hand side). The aver-age total production rate of HOxwas (6.7±4.7)×104cm−3s−1
(median = 5.7 × 104cm−3s−1) for the entire data set, (7.4±5.7)×104cm−3s−1 (median = 5.7×104cm−3s−1) for the summer campaign and (5.7±2.1) × 104cm−3s−1 (me-dian = 5.6×104 cm−3s−1) for the winter campaign. The av-erage total loss rate of HOx was (7.1±4.9)×104cm−3s−1
Fig. 10.Processes controlling the instantaneous production(a)and loss(b)of HO2radicals at night. The upper panels show the
sum-mer and winter campaign means combined, with the lower panels showing the summer campaign means (left hand side) and winter campaign means (right hand side). The average total production rate of HO2was (9.3±5.6)×104cm−3s−1(median=7.9×104 cm−3s−1) for the entire data set, (9.8±6.7)×104cm−3s−1 (median = 7.9×104cm−3 s−1) for the summer campaign and (8.5±3.1)×104 cm−3s−1 (median = 7.9×104cm−3s−1) for the winter campaign. The average total loss rate of HO2 was
(9.4 ± 5.8)×104cm−3s−1 (median = 8.1 × 104cm−3s−1) for the entire data set, (9.9±7.0)×104cm−3s−1 (median = 8.0×104cm−3s−1)for the summer campaign and (8.8±3.2)× 104cm−3s−1(median=8.2×104cm−3s−1)for the winter cam-paign.
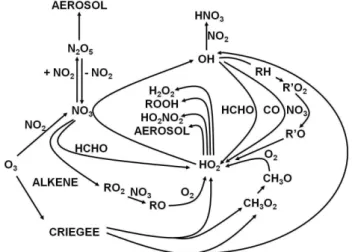
Fig. 11.Schematic summarising the dominant chemical pathways occurring during tropospheric oxidation at night during RONOCO.
Figure 10 shows the processes controlling modelled night-time HO2concentrations during the campaign. Production of
HO2 is dominated by RO+O2 reactions, comprising 42 %
of the total on inclusion of CH3O+O2. Despite the low OH
concentrations at night, there is also significant HO2
produc-tion via OH+CO (31 %). Alkene ozonolysis reactions
rep-resent 5 % of the total HO2production, on average, with
re-actions of HCHO with NO3and OH contributing 8 and 6 %
to the total HO2production, respectively.
The dominant loss pathways for HO2are through reaction
with NO3 (45 % of the total) and O3(27 %), with both
re-actions representing radical propagation routes. Rere-actions of HO2with other peroxy radicals (both HO2and RO2)
consti-tute 17 % of the HO2loss, while uptake onto aerosols
con-tributes only 7 % to the total HO2loss.
Production of OH at night occurred primarily through the reactions of HO2with NO3(53 %) and O3(33 %), with OH
loss processes dominated by its reactions with CO (35 %), NO2(21 %), and CH4(12 %).
6.4 Summary of budget analyses
Figure 11 shows a summary of the processes controlling nighttime composition during RONOCO. In general we see a significant coupling between the NO3x and ROx families,
with similar chemistry controlling the composition in sum-mer and winter. The NO3x family is primarily controlled
by the balance between its production from the reaction of NO2 and O3 and its loss predominantly to aerosols through
N2O5. However, the component of the loss not through this
path (36 %, on average) is responsible for a dynamic or-ganic chemistry. The reactions of NO3 with alkenes, and
of NO3 with C4-alkenes in particular, represent the
decomposition of alkoxy radicals and formation of HNO3
through the reaction of OH with NO2. The propagation of
the radical oxidation chemistry, which during the day would be controlled by NO is, at night, controlled by NO3. Thus the
NO3radical acts both as a chain initiator (like OH during the
day) and the chain propagator (like NO during the day). Production of HOxradicals is typically dominated by
re-actions of RO radicals with O2, with a minor contribution
from alkene ozonolysis reactions. Loss of HOx is largely
controlled by HO2+RO2 reactions and OH+NO2, while
the loss of HO2is typically dominated by the radical
propa-gation reactions HO2+NO3and HO2+O3.
Now that the chemistry occurring in the model during the night has been described, the model sensitivity to various uncertainties can be evaluated so that the reasons for the model’s overprediction of NO3xand underprediction of HO2
can be investigated.
7 Sources of model uncertainties
Model calculations for RONOCO display a tendency to un-derpredict HO2* whilst overpredicting NO3 and N2O5. In
this section we investigate the impact of potential sources of uncertainty on models of nighttime chemistry and composi-tion. First we consider the impact of the timescale adopted in the model to describe physical losses of long-lived species in the model. Secondly, given the role of heterogenous up-take of N2O5 in determining NO3x loss processes and the
significant uncertainty in uptake coefficients in the literature (Brown et al., 2006, 2009, 2011; Escoreia et al., 2010; Tang et al., 2010; Badger et al., 2006; Thornton and Abbatt, 2005; Hallquist et al., 2003; Thornton et al., 2003; Kane et al., 2001; Hu and Abbatt, 1997; Fried et al., 1994; Van Doren et al., 1991; Hanson and Ravishankara, 1991; Mozurkewich and Calvert, 1998) we investigate the model sensitivity to γN2O5 and to the model description of heterogeneous uptake on aerosol surfaces. We then focus on model uncertainties which have the potential to rectify both the model underpre-diction of HO2* and overprediction of NO3x, i.e. parameters
which are simultaneously sinks of NO3xand sources of HOx
such as the reaction rate between NO3and RO2and the
im-pact of missing VOCs.
7.1 Impact of timescale for physical loss
As described in Sect. 4, model calculations reported here include a first-order loss process to represent continuous physical loss processes to prevent the build-up of unmea-sured species in the model. In our previous work as part of the African Monsoon Multidisciplinary Analyses (AMMA) campaign we investigated the impact of the rate of physi-cal loss on HOxsimulations (Stone et al., 2010). Results of
model simulations for daytime chemistry during AMMA in-dicated little impact of the physical loss rate on modelled
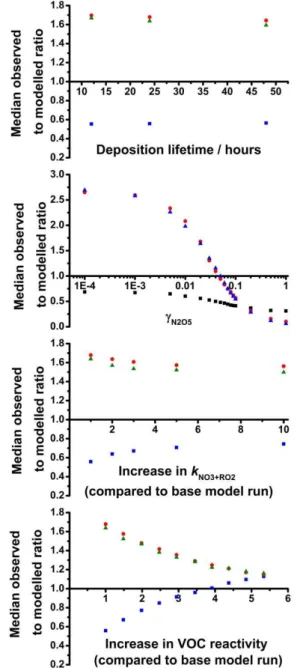
γ Fig. 12.Sensitivity of median modelled to observed ratios of HO2*
(blue), NO3 (red) and N2O5 (green) towards(a) the deposition
lifetime adopted in the model,(b) γN2O5,(c)rate coefficients for NO3+RO2 (kNO3+RO2)adopted in the model, and (d) concen-trations of unsaturated VOCs in the model. Changes tokNO3+RO2 and unsaturated VOC concentrations are represented as the factor by whichkNO3+RO2and total unsaturated VOC concentration have been increased compared to the base run.
HO2concentrations, with the lifetimes with respect to
phys-ical loss varied between 1 h and 5 days (Stone et al., 2010). Figure 12a shows the impact of the modelled timescale for physical loss on the nighttime RONOCO simulations for HO2 and NO3x. There is little impact on modelled HO2
or NO3x on variation of the lifetime for physical loss from
re 13: Normalised probability distribution function for optimised values of γ .
Fig. 13.Normalised probability distribution function for optimised values ofγN2O5.
treatment of deposition or mixing processes considered in the model is able to explain the overall performance of the model.
7.2 Impact ofγN2O5and model descriptions of
heterogeneous uptake on aerosols
Both laboratory and field studies of the value ofγN2O5 are highly variable (Wagner et al., 2013; Riedel et al., 2012; Brown et al., 2011; Escoreia et al., 2010; Tang et al., 2010; Macintyre and Evans, 2010; Bertram and Thornton, 2009; Brown et al., 2006, 2009; Badger et al., 2006; Thornton and Abbatt, 2005; Hallquist et al., 2003; Thornton et al., 2003; Kane et al., 2001; Hu and Abbatt, 1997; Fried et al., 1994; Van Doren et al., 1991; Hanson and Ravishankara, 1991; Mozurkewich and Calvert, 1998) with values varying over an order of magnitude (10−4–1). The base model uses a fixed
value ofγN2O5=0.02, based on a global mean value (Evans and Jacob, 2005).
In order to investigate the sensitivity of the model we re-peat all the simulations with a range of γN2O5 values (0, 1×10⁻⁶, 1×10⁻⁵, 1×10⁻⁴, 1×10⁻³, 5×10⁻³, 0.01–0.1
(in 0.01 steps), 0.2, 0.5 and 1). For each model point we then select the value of gamma which gives the best fit between the modelled and observed concentrations of N2O5(i.e.
mod-elled to observed ratio closest to unity).
Figure 13 shows the normalised probability distribution function for the optimised values of γN2O5, indicating the greatest probability atγN2O5=0.02 and a second peak in the probability distribution function atγN2O5=0.2. The median value for the optimised γN2O5 is 0.05. The broad distribu-tion of optimised values forγN2O5 observed in this work is supported by the large range ofγN2O5 values reported in lab-oratory and field studies of N2O5uptake, and highlights the
difficulty in providing a full parameterisation ofγN2O5 for use in atmospheric models.
Figure 14 shows the mean of the fractional aerosol compo-sition (measured by the aerodyne mass spectrometer (AMS) onboard the BAe 146), temperature and humidity for data points within each optimised value forγN2O5. The optimised γN2O5 can be seen to display a general increase with
increas-ing sulfate content of the aerosol, and with increasincreas-ing sul-fate to organic ratio, humidity and temperature, withγN2O5 increasing exponentially with each parameter. Despite the low chloride content of the aerosol, chloride reacts rapidly with dissolved N2O5and can significantly affect the rate of
N2O5uptake even at low concentrations (Behnke et al., 1997;
Bertram and Thornton, 2009; Roberts et al., 2009), with the optimised values forγN2O5 displaying an increase with the increasing chloride content of the aerosol. Decreases in the optimised values forγN2O5 are found with increasing nitrate fraction of the aerosol and ammonium to sulfate ratio, with smaller decreases observed with increasing ammonium and organic fractions. Such behaviour has been observed previ-ously in a number of laboratory and field studies (see, for example, Brown et al., 2006; Bertram and Thornton, 2009; Chang et al., 2011; Brown and Stutz, 2012; Riedel et al., 2012, 2013; Wagner et al., 2013; Bertram et al., 2009; and Gaston et al., 2013), and optimisation ofγN2O5 through use of model simulations to reach agreement between ambient gas phase measured and modelled N2O5has been reported
in previous work (Wagner et al., 2013).
However, while optimisation ofγN2O5, by definition, gives model success for NO3and N2O5, the modelled
concentra-tions of HO2 are not improved by optimising γN2O5, with the median modelled to observed ratio for HO2* decreasing
from 0.56 for the base model run (γN2O5=0.02) to 0.52 for the model run using optimised values forγN2O5. The opti-mised values forγN2O5 result in lower modelled HO2 con-centrations since the lower concon-centrations of NO3x lead to
decreased rates of radical production from NO3-initiated
ox-idation processes. Thus, although there are large uncertain-ties associated withγN2O5, and evidence for a dependence of γN2O5on aerosol composition, humidity and temperature, the uncertainties inγN2O5 cannot fully explain the model uncer-tainty observed during RONOCO.
While a range of aerosol uptake coefficients for HO2have
been reported in the literature (see, for example, George et al., 2013), heterogeneous uptake of HO2was found to
consti-tute a relatively minor loss process for HO2(7 % of the total)
and ROxradicals (< 2 % of the total), as discussed in Sect. 6.
There is thus little model sensitivity toγHO2.
We now investigate model sensitivity to other parameters in the model which are able to simultaneously reduce the modelled concentrations of NO3xwhilst also increasing the
modelled concentrations of HO2.
7.3 Impact ofkNO3+RO2
The reaction between peroxy (RO2)radicals and NO3 are
central for the production of HO2at night and play an
impor-tant role in removing NO3. There have been, however, very
γ
Fig. 14.Relationships between the optimised values forγN2O5and the corresponding(a)fractional contribution of sulfate aerosol to the to-tal aerosol mass,(b)fractional contribution of ammonium aerosol to the total aerosol mass,(c)fractional contribution of organic aerosol to the total aerosol mass, (d)fractional contribution of nitrate aerosol to the total aerosol mass, (e)fractional contribution of chloride aerosol to the total aerosol mass,(f) ratio of sulfate aerosol mass to organic aerosol mass,(g)ratio of ammonium aerosol mass to sul-fate aerosol mass,(h)water vapour concentration, and(i)temperature. The best fit lines are shown in blue, and are described by(a)y= 1.8×10⁻³exp(7.8x),(b)y=0.8exp(−18.2x),(c)y=4.2exp(−14.8x),(d)y=6.3×10⁻²exp(−3.8x),(e)y=9.9×10⁻²exp(−49.5x), (f)y=4.3×10⁻³exp(1.7x),(g)y=0.5exp(−6.0x),(h)y=4.4×10⁻⁵exp(2.7×10⁻¹⁷x), and(i)y=1.6×10⁻³⁰exp(0.2x).
–
– Error bars are the 1σ calibration
Fig. 15.Comparison between modelled and observed concentrations of(a)HO2*,(b)NO3and(c)N2O5for a model run including summer
and winter data in which alkene concentrations are set to zero. In each plot, the solid red line indicates the 1:1 line, with 50 % limits given by the broken red lines. The best fit lines are shown in blue, and are described by [HO2*]mod={(0.2±0.1)×[HO2*]obs}– (1.8±2.6) ×106cm−3(r2< 0.01), [NO3]mod={(1.8±0.2)×[NO3]obs}+(2.1±3.8) ppt (r2=0.3) and [N2O5]mod={(1.6±0.1)×[N2O5]mod}–
(39.2±22.2) ppt (r2=0.6). Errors bars are 1σ.
RC(O)O2and one for all other RO2, with no temperature
de-pendence considered and all reaction products assumed to be analogous to the corresponding reaction of the RO2radical
with NO.
Figure 12c shows the sensitivity of the mean modelled to observed ratios of HO2 and NO3x on kNO3+RO2, where
all kNO3+RO2 have been increased by the same factor. We find that increases in kNO3+RO2 lead to increases in mod-elled HO2* and decreases in modelled NO3x, but large (> 10)
-initiated oxidation, which are significant at night, and there may be significant differences in the behaviour of peroxy radicals derived from OH- and O3-initiated oxidation, which
are used to estimatekNO3+RO2 in the model, and those de-rived from NO3-initiated oxidation. The presence of
un-known VOCs (Sect. 7.4), and thus of unun-known RO2
radi-cals, leads to further uncertainties inkNO3+RO2. The available database of laboratory data concerning radical processing in nighttime atmospheres is extremely limited.
7.4 Impact of VOC concentrations
Reactions of NO3 with VOCs are important for both NO3
loss and ROxradical production. Previous studies have
in-voked unmeasured VOCs to explain both model overpredic-tions of NO3and underpredictions of HO2.
The presence of unmeasured unsaturated VOCs also leads to uncertainty in the model. Figure 15 displays the compari-son between modelled and observed concentrations of HO2,
NO3and N2O5for a model run in which the concentrations
of all species containing C=C were set to zero. Compared
to the base model run (Fig. 2), the run with no unsaturated hydrocarbons shows a marked increase in modelled concen-trations of NO3xand very little HO2production,
demonstrat-ing the significance of unsaturated VOCs as both a sink of NO3x and a source of HO2. The presence of unquantified or
unmeasured VOCs thus has the potential to improve model simulations for both HO2and NO3x.
Figure 12d shows the impact of increasing the concentra-tion of unsaturated VOCs on the mean modelled to measured ratios of HO2, NO3and N2O5, represented as the increase
in reactivity towards NO3, where the reactivity is given by
6kNO3+VOC[VOC]. An increase of approximately 4 times the total observed C=C reactivity results in significant
im-provements to model simulations for HO2*, and
simultane-ously improves the modelled NO3x. The percentage
interfer-ences in HO2* owing to alkene-derived RO2radicals are
sim-ilar for the base model run (17.0 %) and the model run with increased C=C reactivity (16.8 %).
Thus significant concentrations of unmeasured VOCs dur-ing RONOCO may explain the model measurement discrep-ancy. Previous work using two-dimensional gas chromatog-raphy (2-D-GC) in urban environments isolated and classi-fied over 500 different VOCs not routinely measured, with significant impacts on atmospheric chemistry (Lewis et al., 2000). 2-D-GC analyses of the whole air samples (WAS) col-lected during the RONOCO campaign have also revealed the presence of a large number of VOCs which are not routinely measured (Lidster et al., 2013). Although the 2-D-GC anal-yses identify the presence of additional species, and, based on expected relationships between polarity and boiling point, can identify the presence of additional unsaturated VOCs, the current absence of readily available calibration standards for long-chain alkenes and other unsaturated VOCs makes full identification and quantification of such species impractical.
Biogenic compounds such as monoterpenes have the po-tential to significantly impact on the nighttime chemistry. A model run in whichα-pinene was included at a concentration equivalent to the limit of detection (131–280 ppt) for the pro-ton transfer mass spectrometer (PTR-MS) onboard the BAe 146 during RONOCO, decreased the median modelled to ob-served ratios for NO3and N2O5from 1.68 and 1.64,
respec-tively, for the base model run to 0.76 and 0.82, respectively. Thus total monoterpenes in the 100 ppt range would signifi-cantly improve the fidelity of the NO3and N2O5simulation.
However, the median modelled to observed ratio for HO2*
was reduced from 0.56 for the base model run to 0.34 on in-clusion ofα-pinene. This reduction is predominantly due to α-pinene derived RO radicals undergoing internal rearrange-ments to produce carbonyl compounds and NO2, in
prefer-ence to reaction with O2 to produce carbonyl compounds
and HO2as exhibited by other unsaturated VOCs. Similarly,
inclusion of styrene in the model at concentrations equiva-lent to those observed for ethylbenzene (median∼8 ppt)
re-duced the median modelled to observed ratios for NO3and
N2O5to 1.31 and 1.11, respectively, but also reduced the
me-dian modelled to observed ratio for HO2* to 0.29 owing to
similar behaviour of styrene-derived RO2 radicals to those
derived from monoterpenes. Low concentrations of species such as monoterpenes and styrene which display high re-activity towards NO3can thus have a significant impact on
NO3x concentrations, and the presence of such compounds
may reduce the N2O5aerosol uptake coefficient required to
achieve model success for NO3x, but the larger hydrocarbons
appear to be less efficient at generating HO2and cannot fully
explain the model discrepancies observed for this work. Other biogenic compounds such as dimethyl sulfide (DMS) have the potential to impact the nighttime radical chemistry. DMS is a potential sink for NO3 and source of
ROx radicals, with previous measurements at ground level
in marine and coastal regions showing DMS to be a signifi-cant sink for NO3(Carslaw et al., 1997; Allan et al., 1999).
DMS concentrations reported over the North Sea and at the Weybourne Atmospheric Observatory on the North Sea coast have indicated high variability at ground level, varying from < 10 to over 300 ppt (Allan et al., 1999; Burgermeister and Georgii, 1991; Carslaw et al., 1997) and typically decreasing rapidly with altitude (Blake et al., 1999; Lunden et al., 2010; Spicer et al., 1996; Andreae et al., 1985). However, DMS was not observed above its 3 ppt limit of detection during the RONOCO campaign. A model run including 3 ppt of DMS did result in improved model success for HO2* and NO3x,
increasing the median modelled to observed ratio for HO2*
from 0.56 for the base model run to 0.68 for the model run including 3 ppt DMS and decreasing the median modelled ra-tios for NO3and N2O5from 1.68 and 1.64 to 1.36 and 1.39,
respectively. The improvements were thus not sufficient to fully explain the discrepancies.

![Fig. 2. Comparison of modelled and observed concentrations of (a) HO 2 * (all data), [HO 2 *] mod = {(0.5 ± 0.1) × [HO 2 *] obs } + (3.0 ± 2.2)](https://thumb-eu.123doks.com/thumbv2/123dok_br/18309135.348551/7.892.94.808.91.621/fig-comparison-modelled-observed-concentrations-ho-data-ho.webp)