www.atmos-chem-phys.net/12/3393/2012/ doi:10.5194/acp-12-3393-2012
© Author(s) 2012. CC Attribution 3.0 License.
Chemistry
and Physics
Influence of aerosols and thin cirrus clouds on the GOSAT-observed
CO
2
: a case study over Tsukuba
O. Uchino1, N. Kikuchi1, T. Sakai2, I. Morino1, Y. Yoshida1, T. Nagai2, A. Shimizu1, T. Shibata3, A. Yamazaki2, A. Uchiyama2, N. Kikuchi1, S. Oshchepkov1, A. Bril1, and T. Yokota1
1National Institute for Environmental Studies, 16-2 Onogawa, Tsukuba, Ibaraki 305-8506, Japan 2Meteorological Research Institute, 1-1 Nagamine, Tsukuba, Ibaraki 305-0052, Japan
3Graduate School of Environmental Studies, Nagoya University, D2-1(510) Furo-cho, Chikusa-ku, Nagoya 464-8601, Japan
Correspondence to:O. Uchino ([email protected])
Received: 12 October 2011 – Published in Atmos. Chem. Phys. Discuss.: 8 November 2011 Revised: 24 February 2012 – Accepted: 19 March 2012 – Published: 10 April 2012
Abstract. Lidar observations of vertical profiles of aerosols and thin cirrus clouds were made at Tsukuba (36.05◦N, 140.12◦E), Japan, to investigate the influence of aerosols and thin cirrus clouds on the column-averaged dry-air mole frac-tion of carbon dioxide (XCO2) retrieved from observation data of the Thermal And Near-infrared Sensor for carbon Ob-servation Fourier Transform Spectrometer, measured in the Short-Wavelength InfraRed band (TANSO-FTS SWIR), on-board the Greenhouse gases Observing SATellite (GOSAT). The lidar system measured the backscattering ratio, depolar-ization ratio, and/or the wavelength exponent of atmospheric particles. The lidar observations and ground-based high-resolution FTS measurements at the Tsukuba Total Carbon Column Observing Network (Tsukuba TCCON) site were recorded simultaneously during passages of GOSAT over Tsukuba.
GOSAT SWIR XCO2data (Version 01.xx) released in Au-gust 2010 were compared with the lidar and Tsukuba TC-CON data. High-altitude aerosols and thin cirrus clouds had a large impact on the GOSAT SWIR XCO2results. By tak-ing into account the observed aerosol/cirrus vertical profiles and using a more adequate solar irradiance database in the GOSAT SWIR retrieval, the difference between the GOSAT SWIR XCO2 data and the Tsukuba TCCON data was re-duced. The 3-band retrieval approach where the aerosol and cirrus profiles were retrieved gave us the best results and the retrieved XCO2data followed the seasonal cycle of∼8 ppm observed at Tsukuba TCCON site.
1 Introduction
The concentration of carbon dioxide (CO2)increased from about 280 ppm in pre-industrial times (before 1750) to 386.8 ppm in 2009, primarily because of emissions from combustion of fossil fuels and land-use changes (IPCC, 2007; WMO, 2010). Because CO2absorbs infrared radiation from the earth’s surface, increased CO2concentrations lead to a rise in the earth’s surface temperature. These changes in temperature influence the biosphere, and the biosphere changes can have a feedback effect on CO2concentrations (Cox et al., 2000). To accurately predict future atmospheric CO2concentrations and their impacts on climate, it is neces-sary to accurately quantify the global distribution and varia-tions of CO2sources and sinks.
Current CO2 flux estimates obtained by inverse model-ing rely mainly on ground-based observation data. Errors in the estimated regional fluxes in Siberia, Africa, Australia, and South America are particularly large because ground-based monitoring stations are sparse in those regions (WMO, 2010). Spectroscopic remote sensing from space is capable of acquiring data that cover the globe and if those data are ac-curate and precise enough, it is expected to reduce errors in the CO2flux estimation obtained by using inverse modeling (Rayner and O’Brien, 2001; Chevallier et al., 2009; Hunger-shoefer et al., 2010).
(XCO2and XCH4)are retrieved from the Short-Wavelength InfraRed (SWIR) observation data of the Thermal And Near-infrared Sensor for carbon Observation Fourier Transform Spectrometer (TANSO-FTS) onboard GOSAT (Yoshida et al., 2011). Morino et al. (2011) preliminarily validated the GOSAT SWIR XCO2 and XCH4 results by compar-ing them with reference data obtained by a ground-based high-resolution FTS of the Total Carbon Column Observ-ing Network (TCCON; Wunch et al., 2011a). They found that the GOSAT SWIR XCO2and XCH4(Ver. 01.xx) val-ues were systematically underestimated by 8.85±4.75 ppm and 20.4±18.9 ppb, respectively. To improve the accuracy of the retrieval results, the causes of these biases (systematic errors) need to be investigated.
Houweling et al. (2005) demonstrated that systematic er-rors in CO2satellite remote sensing data can be caused by aerosols by performing model calculations that showed large sensitivity of the CO2column to the vertical aerosol profile. To minimize the errors due to aerosols in SWIR CO2 mea-surements from space, Butz et al. (2009) proposed that the amount, vertical distribution, and microphysical properties of aerosol particles should be parameterized and retrieved si-multaneously with the total CO2column. Also, some sensi-tivity studies of aerosols and/or thin cirrus clouds on XCO2 measured from space have been made (Kuang et al., 2002; Connor et al., 2008; Reuter et al., 2010; Boesch et al., 2011). The GOSAT SWIR retrieval algorithm in Ver. 01.xx as-sumes that aerosols are uniformly distributed below 2 km of altitude and that no cirrus clouds are present. These as-sumptions are too simple; therefore, a forward spectrum er-ror due to these assumptions may be one of the major sources of error in GOSAT SWIR XCO2 and XCH4 data. In this study, we investigated the impact of vertical aerosol profiles and thin cirrus clouds observed by lidar and sky radiome-ter on the GOSAT SWIR retrieval results, focusing on the GOSAT SWIR XCO2results. First, we compare the GOSAT SWIR XCO2data with reference data obtained by a ground-based high-resolution FTS at the National Institute for Envi-ronmental Studies (NIES) in Tsukuba, which is part of TC-CON (hereafter Tsukuba TCTC-CON FTS). Next, we show that GOSAT SWIR XCO2 data are greatly influenced by high-altitude aerosols and thin cirrus clouds observed by lidar. Fi-nally, we demonstrate that by taking into account the ver-tical aerosol profiles and thin cirrus clouds observed by li-dar and sky radiometer, and by using Toon’s solar irradiance database (G. C. Toon, personal communication, 2011; Toon et al., 1999) instead of Kurucz’s database, the difference be-tween the GOSAT SWIR XCO2data and the Tsukuba TC-CON data becomes much less.
2 Comparison of GOSAT SWIR and Tsukuba TCCON XCO2data
2.1 GOSAT SWIR XCO2
We used GOSAT SWIR XCO2 Ver. 01.xx products. The Ver. 01.xx retrieval algorithm uses TANSO-FTS Band 1 (12 900–13 200 cm−1)and Band 2 (5800–6400 cm−1)to si-multaneously derive XCO2 and XCH4. To reduce biases, auxiliary parameters such as surface pressure and aerosol optical thickness (AOT) are retrieved together with XCO2 and XCH4. The GOSAT SWIR Ver. 01.xx algorithm fo-cuses on those data obtained under cloud-free conditions, and cloud-contaminated data detected by the TANSO Cloud and Aerosol Imager (TANSO-CAI) onboard GOSAT and TANSO-FTS Band 3 (4800–5200 cm−1)data are excluded from the retrieval analysis. After the retrieval calculations, the quality of the retrieved state is checked from the view-points of the convergence (number of iterations, chi-squared, and mean square of the residual spectra for each retrieval sub-band), available information (degrees of freedom for sig-nals and the signal-to-noise ratio, SNR), and the range of the retrieved AOT values. Details are described by Yoshida et al. (2011).
2.2 Tsukuba TCCON FTS
Solar absorption spectra are measured with a Bruker IFS 120 HR FTS at NIES (36.05◦N, 140.12◦E, 31 m a.s.l.) in Tsukuba, Japan. Direct solar light is introduced into the FTS with a solar tracker and five gold-coated flat mirrors. The solar tracker is mounted inside a dome on the roof of the building where the FTS is housed. Measurements with the high-resolution FTS are performed according to the TCCON data protocol. A CaF2 beam splitter and an InGaAs detec-tor are used for the 5500–10 500 cm−1 spectral region. A spectral resolution of 0.02 cm−1 (defined as 0.9/maximum optical path difference), an aperture size of 0.5 mm, and a scanner velocity of 10 kHz are used as standard parameters for the TCCON measurements. The pressure in the FTS is kept at∼0.03 Torr by an oil-free scroll vacuum pump. The forward and backward scanned interferograms are separately integrated over a period of about 70 s. A weather station also observes meteorological data, recording surface pres-sure, surface temperature, relative humidity, wind direction and speed, rainfall, and solar radiation intensity at the same site. Table 1 lists the characteristics of the Tsukuba TCCON FTS. Each measured spectrum was obtained by Fourier trans-form of the interferogram.
Spectra measured with the Tsukuba TCCON FTS were an-alyzed by using the GFIT nonlinear least-squares spectral fit-ting algorithm, which is used for retrievals across all TCCON stations (Wunch et al., 2011a).
Table 1.Characteristics of the Tsukuba TCCON FTS.
Instrument type Bruker IFS 120 HR
Beam splitter CaF2
Aperture size 0.5 mm
Detector InGaAs (5500–10 500 cm−1), Si diode (9200–14 000 cm−1)
Spectral resolution 0.02 cm−1
Single-scan observation time 70 s
the dry-air column amount, the GFIT algorithm uses the measured O2column amount divided by the known dry-air mole fraction of O2(0.2095). The O2and CO2columns are measured simultaneously using the 7751–8000 cm−1(1250– 1290 nm) and 6180–6260 and 6297–6382 cm−1(1567–1588 and 1597–1618 nm) spectral bands, respectively. XCO2 is then obtained as follows:
XCO2=0.2095·(CO2column/O2column) (1) By using the CO2to O2ratio, systematic and correlated er-rors present in both retrieved columns are minimized.
The precision of the FTS measurement of XCO2 is bet-ter than 0.2 % under clear sky conditions (Washenfelder et al., 2006; Ohyama et al., 2009; Messerschmidt et al., 2010; Wunch et al., 2011a). All TCCON XCO2data are corrected for airmass-dependent artifacts (Wunch et al., 2010). Aircraft profiles obtained over many of these sites are used to empir-ically scale the TCCON data according to the WMO stan-dard reference scale. The scaling factor of TCCON XCO2 is 1.011. The uncertainty of TCCON XCO2associated with the FTS measurement after scaling by 1.011 has been esti-mated to be 0.8 ppm (2σ )by comparing TCCON retrievals with many different aircraft-measured profiles (Wunch et al., 2010).
In 2010, Tsukuba TCCON FTS data were calibrated against data from three aircraft flights and tower measure-ments of CO2 concentrations, and an additional bias of 1.32±0.46 ppm (1σ )was added after airmass-dependent ar-tifact correction and 1.011 scaling (Tanaka et al., 2012). This bias correction was reasonable (Wunch et al., 2011b). Here we use these bias-corrected Tsukuba TCCON XCO2 data. About 0.3 ppm and 1 ppm is thought to be due to ghost (laser sampling error of FTS) and instrumental line shape (ILS) of Tsukuba TCCON FTS, respectively.
2.3 Comparison
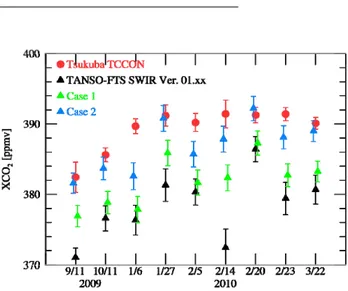
We compared GOSAT SWIR XCO2 data obtained over Tsukuba on 9 days between September 2009 and March 2010 with Tsukuba TCCON data, using the mean values mea-sured at Tsukuba within 30 min of the GOSAT overpass time (around 12:54 LT) (Fig. 1; Table 2). The small number of comparison is due to severe co-location criterion. The dis-tance from the center of the GOSAT field-of-view to the
TC-Fig. 1. Comparison of TANSO-FTS SWIR XCO2 (Ver. 01.xx) data with the Tsukuba TCCON, Case 1 and Case 2 XCO2results. The Case 1 and Case 2 XCO2 are retrieved using Kurucz’s and Toon’s solar irradiance data, respectively. Both cases are taking into account the vertical profiles of two types of aerosols and cirrus clouds determined from lidar and sky radiometer (Table 5). The er-ror bars for the Tsukuba TCCON data and the retrieved XCO2are also shown.
CON station was very small (less than 3 km) since we used the GOSAT data observed over Tsukuba TCCON site. The distance of lidar and Tsukuba TCCON site is 513 m. The se-vere co-location criterion is to exclude the spatial difference of aerosols and cirrus clouds of which variations are compar-atively large.
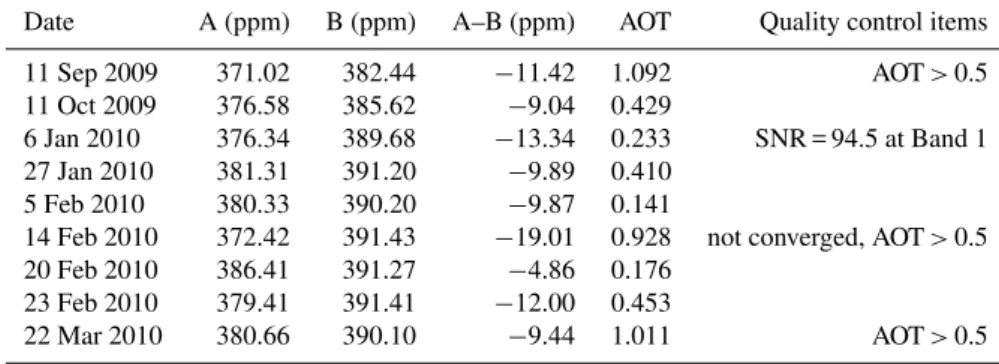
Table 2.Comparison of GOSAT SWIR XCO2(A) with Tsukuba TCCON XCO2(B) and the quality control items not satisfactory for data release. Aerosol optical thickness (AOT) was retrieved at the wavelength of 1600 nm. SNR is signal-to-noise ratio.
Date A (ppm) B (ppm) A–B (ppm) AOT Quality control items
11 Sep 2009 371.02 382.44 −11.42 1.092 AOT>0.5
11 Oct 2009 376.58 385.62 −9.04 0.429
6 Jan 2010 376.34 389.68 −13.34 0.233 SNR = 94.5 at Band 1
27 Jan 2010 381.31 391.20 −9.89 0.410
5 Feb 2010 380.33 390.20 −9.87 0.141
14 Feb 2010 372.42 391.43 −19.01 0.928 not converged, AOT>0.5
20 Feb 2010 386.41 391.27 −4.86 0.176
23 Feb 2010 379.41 391.41 −12.00 0.453
22 Mar 2010 380.66 390.10 −9.44 1.011 AOT>0.5
Table 3.Characteristics of the two-wavelength polarization lidar.
Transmitter
Laser Nd:YAG
Wavelength 532 nm 1064 nm
Pulse energy 150 mJ 150 mJ
Pulse repetition rate 10 Hz
Beam divergence 0.2 mrad
Receiver
Telescope type Ritchy-Chretien (advanced)
Telescope diameter 30.5 cm
Field of view (full angle) 1.0 mrad
Interference filter (FWHM) 0.28 nm 0.38 nm
Transmission 58 % 58 %
Polarization measurement Yes No
Number of receiving channel 3 (P:2, S:1) 1
Detector PMT (R3234-01) APD (Silicon)
Transient recorder 12bit A/D + PC 12 bit A/D
Minimum time resolution 1 min
Minimum altitude resolution 7.5 m
3 Lidar observations of aerosols and thin cirrus clouds over Tsukuba and the influence of high-altitude particles on GOSAT SWIR XCO2
A compact lidar, based on a Nd:YAG laser, was devel-oped to observe vertical distributions of thin cirrus clouds and aerosols and evaluate the influence of these particles on GOSAT SWIR XCO2 data. Two laser wavelengths of 1064 nm (λ1) and 532 nm (λ2) are transmitted into the at-mosphere through a beam expander. The backscattered light from the upper atmosphere is collected by a telescope and then divided intoλ1 andλ2 by a dichroic mirror, andλ2 is further divided into a parallel (P) and a perpendicular com-ponent (S) by a polarizer. λ1 is detected by an avalanche photodiode (APD) andλ2 by photomultiplier tubes (PMTs). The output signals are processed by transient recorders with an analog/digital converter (A/D) and a photon counter (PC).
Table 3 summarizes the characteristics of the lidar (Uchino et al., 2010).
The backscattering ratioRis defined as
R=(BR +BA)/BR (2)
whereBR andBAare the Rayleigh and Mie backscattering coefficients, respectively. Backscattering ratio profiles are derived by the inversion method (Fernald, 1984). We as-sumed the lidar ratio (extinction to backscatter ratio) to be 50 sr for aerosols (Sakai et al., 2003; Cattrall et al., 2005) and 20 sr for cirrus clouds (Sakai et al., 2003). To calcu-late BR, we used the atmospheric molecular density pro-files obtained by operational radiosondes at the Aerologi-cal Observatory of the Japan MeteorologiAerologi-cal Agency (JMA) (36.06◦N, 140.13◦E) in Tsukuba.
The total depolarization ratio (Dep) is defined as
whereP and S are the parallel and perpendicular compo-nents of the backscattered signals. Dep indicates whether the particles are spherical or non-spherical, with large val-ues indicating non-spherical particles. The wavelength expo-nent, Alp, which shows whether the Mie particles are small or large, is defined by
BA(λ)∝λ−Alp (4)
Larger values of Alp indicate smaller particles.
Figure 2 shows vertical profiles ofR, Dep, and Alp ob-served on 14, 20, and 23 February 2010. The lidar observa-tions were made during a period of about 10 min as GOSAT passed over Tsukuba. The vertical resolution used for the analysis was 150 m. On 14 February 2010, there were thin cirrus clouds at altitudes of 6.1–10.9 km and aerosols below 3 km. The partial optical thickness at altitudes of 0.4–30 km, Tau (0.4–30 km), was 0.24 at 532 nm (Fig. 2). The opti-cal thickness from the surface to the top of the atmosphere could not be obtained below 0.4 km because the beam over-lap between the lidar transmitter and receiver was not perfect. Lidar measurements of stratospheric aerosols above 15 km were observed at night (Uchino et al., 2010). In contrast to 14 February, 20 February 2010 was a comparatively clear day with aerosols in the boundary layer, and Tau (0.4–30 km) was estimated to be 0.1. On 23 February, the high-altitude aerosols observed at altitudes of 1–5 km were likely dust par-ticles, because Dep was large, indicating non-spherical parti-cles. Tau (0.4–30 km) was 0.16.
The difference between GOSAT SWIR XCO2 and Tsukuba TCCON XCO2 values was the largest (−19.01 ppm) on 14 February 2010 (Table 2). The dif-ference was small (−4.86 ppm) on 20 February, and it was somewhat large (−12.00 ppm) on 23 February. The cirrus clouds on 14 February 2010 might have influenced the GOSAT retrieval. There were also thin cirrus clouds around 10.9–11.2 km altitude on 11 September 2009, when the difference was also relatively large (−11.42 ppm). Our results indicate that the retrieval of GOSAT SWIR XCO2 data is greatly influenced by high-altitude aerosols and thin cirrus clouds and their optical thickness.
The current version of the retrieval algorithm (Ver. 01.xx) assumes that atmospheric aerosols are uniformly distributed from the ground surface to 2 km altitude. Next we show that GOSAT SWIR XCO2 data were improved when the verti-cal distribution of the optiverti-cal thicknesses of aerosols and the thin cirrus clouds observed by lidar and sky radiometer were taken into account.
4 Improvement of GOSAT SWIR XCO2retrieval
4.1 Vertical profiles of aerosol species and cirrus clouds
Vertical profiles and optical properties of aerosols and cir-rus clouds used in the retrieval analysis were prepared based
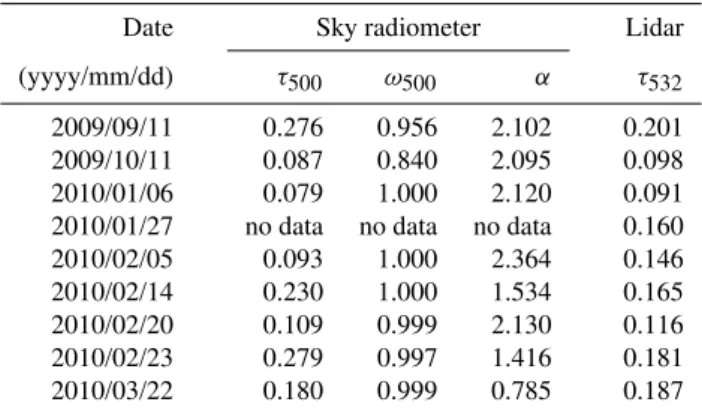
Table 4. Optical thickness at 500 nm (τ500), single-scattering albedo at 500 nm (ω500), and Angstrom exponent (α)observed by sky radiometer, and aerosol optical thickness at 532 nm (τ532) de-termined by lidar at Tsukuba.
Date Sky radiometer Lidar
(yyyy/mm/dd) τ500 ω500 α τ532
2009/09/11 0.276 0.956 2.102 0.201
2009/10/11 0.087 0.840 2.095 0.098
2010/01/06 0.079 1.000 2.120 0.091
2010/01/27 no data no data no data 0.160
2010/02/05 0.093 1.000 2.364 0.146
2010/02/14 0.230 1.000 1.534 0.165
2010/02/20 0.109 0.999 2.130 0.116
2010/02/23 0.279 0.997 1.416 0.181
2010/03/22 0.180 0.999 0.785 0.187
on the lidar and sky radiometer measurements. The sky ra-diometer can measure aerosol optical thickness and single scattering albedo at four wavelengths (400, 500, 675, and 870 nm), and the Angstrom exponent can be estimated from the optical thickness at these four wavelengths (Shiobara et al., 1991; Kobayashi et al., 2006). A large value of the Angstrom exponent indicates small particles. Table 4 sum-marizes the aerosol optical thickness at 500 nm (τ500), the single scattering albedo at 500 nm (ω500), and the Angstrom exponent (α)at the GOSAT overpass times; the optical thick-ness at 532 nm (τ532), calculated from the lidar measure-ment by extrapolating the value ofBAat 0.4 km down to the ground surface, is also shown. The optical thickness of cir-rus clouds is not included in τ532, and it is approximately the same asτ500. The Angstrom exponent of aerosols over Tsukuba was large except on 14 February, 23 February, and 22 March 2010 (Table 4). In addition, the values ofω500were close to unity, indicating that the aerosol particles were small and non-absorbing (Table 4). The relatively small value of
αon 14 February 2010 might reflect contamination by cir-rus clouds, because the Dep value of the lidar measurement does not indicate the presence of large, non-spherical aerosol particles. We therefore assumed that, except on 23 February and 22 March 2010, the aerosols over Tsukuba were sulfate because the particles were small and non-absorbing.
0 5 10 15
0 5 10
R, Dep (%), Alp
A
lti
tu
d
e
(
k
m
)
R Dep. Alp 12:49:29-12:59:43 2010/2/14
0.24 Tau(0.4-30 km)
0 5 10 15
0 5
R, Dep (%), Alp
A
lti
tu
d
e
(
k
m
)
10 R Dep. Alp 12:49:38-12:59:52 2010/2/20
0.10 Tau(0.4-30 km)
1
0 5 10 15
0 5
R, Dep (%), Alp
A
lti
tu
d
e
(
k
m
)
10 R Dep. Alp 12:49:52-13:00:06 2010/2/23
0.16 Tau(0.4-30 km)
2
Fig. 2.Vertical profiles of the backscattering ratioR, total depolarization ratio Dep, and wavelength exponent Alp, observed by lidar on 14, 20, and 23 February 2010. Tau (0.4–30 km) is the partial optical thickness at altitudes of 0.4–30 km at 532 nm.
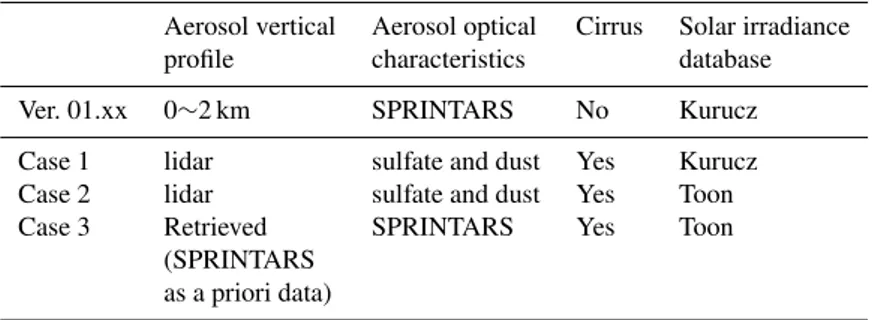
Table 5. Physical parameters currently used for retrieval (Ver. 01.xx) and three case studies showing decreased biases of GOSAT SWIR XCO2data.
Aerosol vertical Aerosol optical Cirrus Solar irradiance
profile characteristics database
Ver. 01.xx 0∼2 km SPRINTARS No Kurucz
Case 1 lidar sulfate and dust Yes Kurucz
Case 2 lidar sulfate and dust Yes Toon
Case 3 Retrieved SPRINTARS Yes Toon
(SPRINTARS as a priori data)
mixture agreed with that derived from the sky radiometer ob-servations.
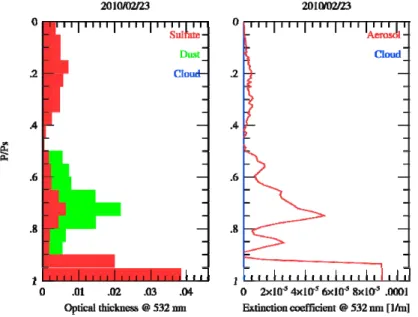
The vertical profiles of the extinction coefficient and the optical thicknesses of sulfate particles and cirrus clouds on 14 February 2010 are shown in Fig. 3, and those of sulfate and dust particles on 23 February 2010 are shown in Fig. 4. Similarly, we obtained vertical profiles of aerosols and cirrus clouds for the other days by using lidar and sky radiometer data observed at Tsukuba.
4.2 Case 1 XCO2retrieved using the vertical profiles of
particles observed by lidar and sky radiometer
Fig. 3.Vertical profiles of the optical thicknesses (left panel) and extinction coefficients (right panel) of sulfate and cirrus cloud particles at 532 nm on 14 February 2010. The vertical scale is pressure normalized to surface pressure. The values of 0.5 and 0.1 correspond to altitudes of about 5.5 and 16 km, respectively.
Fig. 4.Vertical profiles of optical thicknesses (left panel) and extinction coefficients (right panel) of sulfate and dust particles at 532 nm on 23 February 2010.
the vertical profile. Then we used Mie theory to derive the aerosol optical properties by assuming a mixture of sulfate and dust; for the operational algorithm we adopted aerosol optical properties estimated by the aerosol transport model SPRINTARS (Ver. 3.54) (Takemura et al., 2000). In addi-tion, cirrus clouds were included in the forward model on 11 September 2009 and 14 February 2010, when lidar mea-surements showed that they were present. The optical
thick-ness of the cirrus clouds was retrieved by scaling the vertical profile observed by lidar. To estimate the optical properties of ice crystals in the cirrus clouds, we adopted the Cirrus 3 model of Hess et al. (1998).
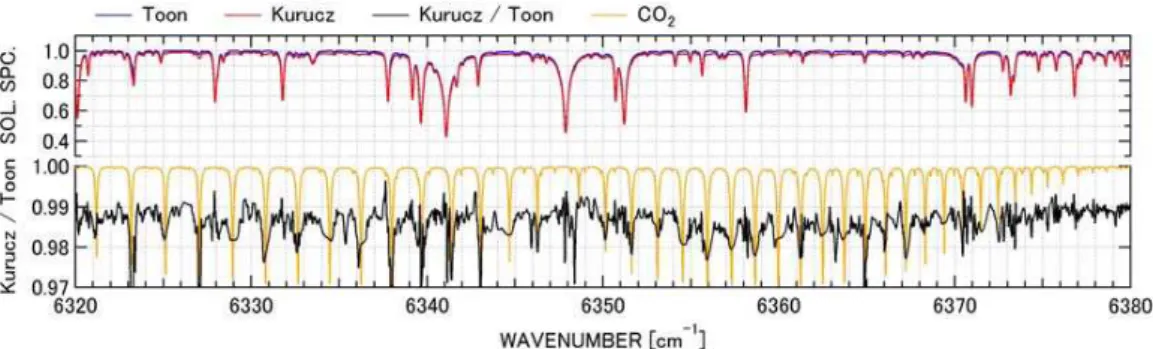
Fig. 5.The Kurucz’s and Toon’s solar spectrum and the ratio are plotted with CO2absorption lines.
Fig. 6.Comparison of retrieved optical thickness at 532 nm (Case 1 and Case 2) with a priori values estimated from lidar measurements. The error bars of the retrieved values are also shown.
data are closer to the TCCON data than the SWIR Ver. 01.xx results shown in Fig. 1. In particular, the data for 11 Septem-ber 2009 and 14 February 2010, when aerosol optical thick-ness was large (Table 4) and cirrus clouds were present, and on 23 February and 22 March 2010, when aerosol op-tical thickness was large, were greatly improved. Never-theless, although the negative bias in XCO2 was reduced to two thirds that obtained with the operational algorithm, it was not eliminated. For the models of Cirrus 1, 2 and 3 by Hess et al. (1998), the differences of the retrieved XCO2, surface pressure, and AOT were 0.3 ppm, 0.5 hPa, and 0.01 respectively, and the above-mentioned result was rather sta-ble. However, it is better to obtain more examples of thin cirrus clouds before reaching a general conclusion.
4.3 Solar irradiance database
Although a high-resolution solar irradiance database is needed to simulate a TANSO-FTS measured spectrum, few such solar irradiance databases are available. The GOSAT SWIR retrieval analysis used the high-resolution solar
irra-diance database (0.004 to 0.01 cm−1)of R. Kurucz (http:// kurucz.harvard.edu/sun/irradiance2008/). This database was created from spectra measured with a ground-based high-resolution FTS at Kitt Peak National Observatory (Arizona, USA) by removing the absorption structure due to the earth’s atmosphere. However, as shown in Fig. 5, we noticed a CO2absorption structure in the spectral residual between the measured spectrum and the spectrum simulated by the for-ward spectral model, whereas when we used a solar spec-trum database provided by G. C. Toon (personal commu-nication, 2011; Toon et al., 1999), we confirmed no CO2 absorption structure in the spectral residuals. We thus de-cided to use Toon’s solar irradiance database. We also ap-plied the low-frequency baseline correction in the current Ver. 01.xx retrieval to Toon’s solar irradiance database. The low-frequency baseline correction is to fit the baseline of the solar irradiance spectra to calibration data of the solar irradi-ance by a diffuser installed on the TANSO-FTS.
4.4 Case 2
We retrieved XCO2(Case 2 XCO2)data by using Toon’s so-lar irradiance data instead of Kurucz’s data and by taking into account the vertical profiles of the two types of aerosols and cirrus clouds determined by lidar and sky radiometer (Ta-ble 5, Case 2 ), and plotted these Case 2 XCO2values against the Tsukuba TCCON data (Fig. 1). The difference between the Case 2 XCO2 and Tsukuba TCCON XCO2 data was −2.43±2.45 ppm. Thus, the Case 2 XCO2data were much closer to the Tsukuba TCCON XCO2data than the GOSAT SWIR (Ver. 01.xx) data (Fig. 1). A lidar point measurement is not always representative for a GOSAT pixel with 10 km in diameter when aerosols and thin cirrus clouds vary rapidly in space and time. This is one of the reasons of remaining dis-crepancies in Case 2. For example, thin cirrus clouds were variable in time on 14 February.
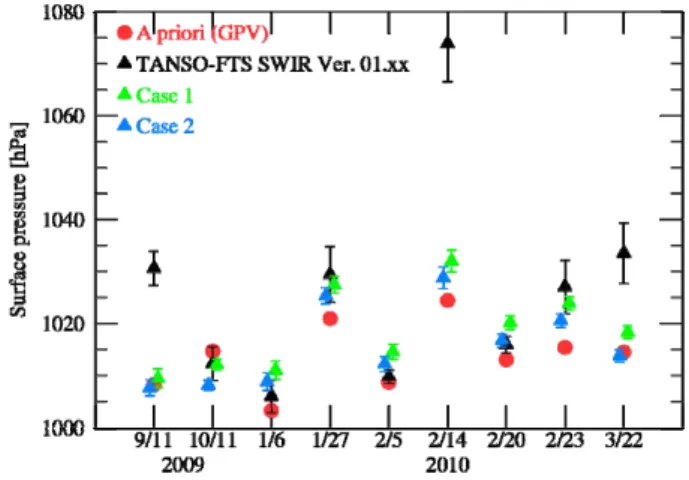
AOT for Case 1 and Case 2. In spite of longer wavelength, AOT of Ver. 01.xx in Table 2 is larger than that in Case 1 and Case 2. We also compared the a priori surface pressure, obtained by interpolating in both time and space the Objec-tive Analysis Data (the gridded meteorological data analyzed from the global observational data) of JMA to obtain values for Tsukuba, with the retrieved values (Fig. 7). The differ-ence between the a priori and the Case 2 retrieved surface pressure was small except on 11 October 2009 compared with that for the Case 1. Therefore, it is reasonable to in-fer that the Case 2 XCO2 data are reliable. However, the retrieved surface pressures improved largely compared with those of Ver. 01.xx. The vertical distributions of aerosol and cirrus clouds contribute to a large change in surface pressure, and the aerosol type next with moderate change. If we take into account of the aerosol vertical distribution, the spectral residual (chi-squared) improved in Band 1. There is no large difference of the spectral residuals in Band 1 and Band 2 be-tween Case 1and Case 2.
Apart from modeling of aerosols and solar irradiance database, the forward model of the present analysis is the same as that of Ver. 01.xx algorithm described in Yoshida et al. (2011). Line mixing and collision-induced absorption are included in the calculation of O2 A Band absorption. Flu-orescence is not included in the forward model. Retrievals of surface pressure and aerosols can also be affected by a zero-level offset, which is observed in Band 1 spectra and is thought to be caused by the instrument’s non-linearity (Butz et al., 2011). To address this issue, we made additional cal-culations in which a zero-level offset was simultaneously re-trieved. We found that there is little effect of a zero-level off-set for 6 data from 6 January to 23 February since the signal levels were sufficiently low. For 6 data, the retrieved surface pressures are higher (∼5 hPa) than the a priori values, and it could be due to the spectroscopic line parameter database in the O2A band.
4.5 Improved 3-band retrieval (Case 3)
In this study, we demonstrated that the negative bias of 10.99±3.83 ppm for all GOSAT SWIR XCO2 data in Ta-ble 2 at the Tsukuba TCCON site could be reduced to 7.40±2.39 ppm by taking into account the vertical profiles of aerosols and cirrus clouds observed by lidar and sky ra-diometer. The negative bias in XCO2 was then further re-duced to 2.43±2.45 ppm by using Toon’s solar irradiance data instead of Kurucz’s data.
These results show that vertical profiles of aerosol species and cirrus clouds must be considered in the retrieval al-gorithm in order to improve the data quality of the global GOSAT SWIR XCO2when lidar observations are not avail-able. One of the simplest ways to improve the treatment of aerosols would be to incorporate vertical profiles of aerosols obtained from SPRINTARS in the forward model. Aerosol vertical profiles simulated by SPRINTARS, however, are not
Fig. 7. Comparison of retrieved surface pressure (Case 1 and Case 2) with a priori pressure. The error bars of the retrieved values are also shown.
sufficient, as shown by comparing the SPRINTARS aerosol profile with that observed by lidar (Fig. 8). Therefore, as the first step, we simultaneously retrieved XCO2 (Case 3 XCO2; Table 5, Case 3) and the vertical profile of aerosol optical thickness based on the a priori aerosol optical thick-ness profile calculated by SPRINTARS. In Case 3, the op-tical thickness and cloud-top pressure of the cirrus clouds were also retrieved simultaneously. The cloud-bottom sure was modeled as a linear function of the cloud-top pres-sure, as suggested by N. Eguchi (personal communication, 2011; Eguchi et al., 2007), and the cirrus clouds were as-sumed to be distributed uniformly in the vertical direction. In addition, Band 3 spectra (4790–4910 cm−1)were also uti-lized in Case 3 for higher retrieval accuracy of the vertical aerosol profiles.
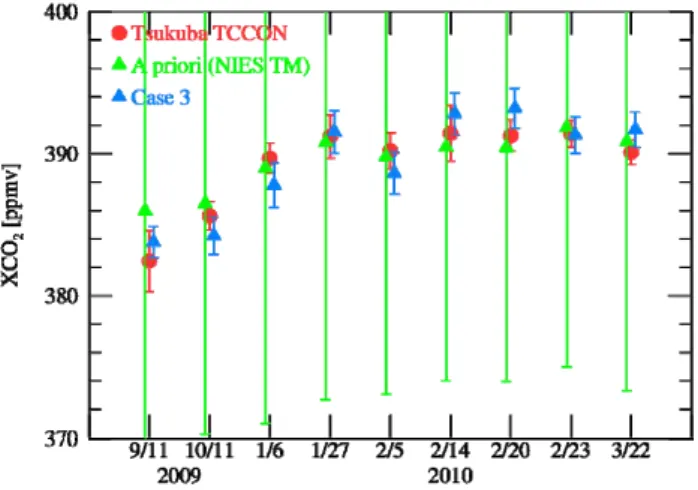
The Case 3 and Tsukuba TCCON XCO2values are shown in Fig. 9. We also plot the a priori XCO2values calculated by the National Institute for Environmental Studies Trans-port Model (NIES TM) and their errors which were assumed to be the 100 times of the original CO2variance-covariance matrix (refer to Yoshida et al., 2011). The difference between the Case 3 XCO2and the Tsukuba TCCON XCO2data was 0.17±1.49 ppm. The standard deviation of 1.49 ppm (1σ )
Fig. 8.Vertical profiles of aerosol optical thickness measured by li-dar and simulated by SPRINTARS at 532 nm on 23 February 2010.
to be spectroscopy. Both collisional narrowing and speed de-pendence of collisional broadening and shifting play a signif-icant role near 1600 nm over a pressure range of 330–67 hPa (Long et al., 2011), where we do not take into account those effects.
Aerosol optical properties derived from SPRINTARS were used in both Case 3 and the current operational algorithm. The Case 3 XCO2 results shown in Fig. 9 are promising. We know this study is only based on the performance for one site and we would need to carry out validation for other sites. An improved SPRINTARS might further improve the results. Therefore, it would be better to use a new SPRINT-ARS model in which AERONET observations are assimi-lated (Schutgens et al., 2010). Furthermore, SPRINTARS is being further improved by assimilation of lidar network and CALIOP data (Shimizu et al., 2004; Winker et al., 2007; Sekiyama et al., 2010).
5 Concluding remarks
Version 01.xx GOSAT SWIR XCO2data, released in August 2010, were compared with Tsukuba TCCON data. Compari-son of lidar and sky radiometer observations with the GOSAT SWIR XCO2data clearly showed that high-altitude aerosols
Fig. 9.Comparison of Case 3 XCO2data, obtained by retrieving the aerosol profile based on the a priori vertical profile and fixed aerosol optical characteristics given by the SPRINTARS model, with the Tsukuba TCCON XCO2data (Table 5, Case 3). The used a priori values and their error bars are also shown.
and thin cirrus clouds had a large impact on GOSAT SWIR XCO2. The current retrieval algorithm (Ver. 01.xx) for XCO2 and XCH4 from the GOSAT TANSO-FTS SWIR observa-tion data assumes that atmospheric aerosols are uniformly distributed from the ground surface to 2 km altitude. By tak-ing into account the actual vertical distributions of aerosols determined by lidar and sky radiometer over Tsukuba, and by using Toon’s solar irradiance database instead of Kurucz’s database, the difference between GOSAT SWIR XCO2data and the Tsukuba TCCON XCO2found in the Ver. 01.xx re-sults was reduced. The 3-band retrieval approach where the aerosol and cirrus profiles were retrieved gave us the best re-sults and the retrieved XCO2data followed the seasonal cycle of∼8 ppm observed at Tsukuba TCCON site of which value was consistent to the result by Ohyama et al. (2009).
In this paper we concentrated our attention on resolving the large bias of the Ver. 01.xx results shown by Morino et al. (2011). However, it is important to reduce the regional biases due to distinct regional patterns of aerosols and cirrus clouds for application of inverse modeling. The 3-band trieval method where the aerosol and cirrus profiles are re-trieved has a possibility of reducing the standard deviations of the biases and the regional biases. Recently the NASA Atmospheric CO2 Observations from Space (ACOS) team applied this 3-band retrieval to GOSAT data (O’Dell et al., 2012; Crisp et al., 2012). In the near future, we plan to incor-porate the vertical distributions of aerosols at altitudes above 2 km in the GOSAT SWIR retrieval algorithm.
the Japan Meteorological Agency. This research was supported in part by the Environment Research and Technology Development Fund (A-1102) of the Ministry of the Environment, Japan.
Edited by: M. K. Dubey
References
Boesch, H., Baker, D., Connor, B., Crisp, D., and Miller, C.: Global characterization of CO2 column retrievals from shortwave-infrared satellite observations of the Orbiting Car-bon Observatory-2 Mission, Remote Sens., 3, 270–304, doi:10.3390/rs3020270, 2011.
Butz, A., Hasekamp, O. P., Frankenberg, C., and Aben, I.: Re-trievals of atmospheric CO2 from simulated space-borne mea-surements of backscattered near-infrared sunlight: accounting for aerosol effects, Appl. Optics, 48, 3322–3336, 2009. Butz, A., Guerlet, S., Hasekamp, O., Schepers, D., Galli, A.,
Aben, I., Frankenberg, C., Hartmann, J. -M., Tran, H., Kuze, A., Keppel-Aleks, G., Toon, G., Wunch, D., Wennberg, P., Deutscher, N., Griffith, D., Macatangay, R., Messerschmidt, J., Notholt, J., and Warneke, T.: Toward accurate CO2and CH4 observations from GOSAT, Geophys. Res. Lett., 38, L14812, doi:10.1029/2011GL047888, 2011.
Cattrall, C., Reagan, J., Thome, K., and Dubovik, O.: Variabil-ity of aerosol and spectral lidar and backscatter and extinc-tion ratios of key aerosol types derived from selected Aerosol Robotic Network locatios, J. Geophys. Res., 110, D10S11, doi:10.1029/2004JD005124, 2005.
Chevallier, F., Maksyutov, S., Bousquet, P., Br´eon, F.-M., Saito, R., Yoshida, Y., and Yokota, T.: On the accuracy of the CO2surface fluxes to be estimated from the GOSAT observations, Geophys. Res. Lett., 36, L19807, doi:10.1029/2009GL040108, 2009. Connor, B., Boesch, H., Toon, G., Sen, B., Miller, C., and
Crisp, D.: Orbiting Carbon Observatory: Inverse method and prospective error analysis, J. Geophys. Res., 113, D05305, doi:10.1029/2006JD008336, 2008.
Cox, P. M., Betts, R. A., Jones, C. D., Spall, S. A., and Totterdell, I. J.: Acceleration of global warming due to carbon-cycle feed-backs in a coupled climate model, Nature, 408, 184–187, 2000. Crisp, D., Fisher, B. M., O’Dell, C., Frankenberg, C., Basilio, R.,
Bsch, H., Brown, L. R., Castano, R., Connor, B., Deutscher, N. M., Eldering, A., Griffith, D., Gunson, M., Kuze, A., Mandrake, L., McDuffie, J., Messerschmidt, J., Miller, C. E., Morino, I., Natraj, V., Notholt, J., O’Brien, D. M., Oyafuso, F., Polonsky, I., Robinson, J., Salawitch, R., Sherlock, V., Smyth, M., Suto, H., Taylor, T. E., Thompson, D. R., Wennberg, P. O., Wunch, D., and Yung, Y. L.: The ACOS CO2retrieval algorithm – Part II: Global XCO2 data characterization, Atmos. Meas. Tech., 5,
687–707, doi:10.5194/amt-5-687-2012, 2012.
Eguchi, N., Yokota, T., and Inoue, G.: Characteristics of cirrus clouds from ICESat/GLAS observations, Geophys. Res. Lett., 34, L09810, doi:10.1029/2007GL029529, 2007.
Fernald, F. G.: Analysis of atmospheric lidar observations: some comments, Appl. Optics, 23, 652–653, 1984.
Hess, M., Koepke, P., and Schult, I.: Optical properties of aerosols and clouds: the software package OPAC, B. Am. Meteorol. Soc., 79, 831–844, 1998.
Houweling, S., Hartmann, W., Aben, I., Schrijver, H., Skidmore, J., Roelofs, G.-J., and Breon, F.-M.: Evidence of systematic errors in SCIAMACHY-observed CO2due to aerosols, Atmos. Chem. Phys., 5, 3003–3013, doi:10.5194/acp-5-3003-2005, 2005. Hungershoefer, K., Br´eon, F.-M., Peylin, P., Chevallier, F., Rayner,
P., Klonecki, A., Houweling, S., and Marshall, J.: Evalua-tion of various observing systems for the global monitoring of CO2 surface fluxes, Atmos. Chem. Phys., 10, 10503–10520, doi:10.5194/acp-10-10503-2010, 2010.
Intergovernmental Panel on Climate Change (IPCC), Climate change 2007: The Physical Science Basis: Contribution of Work-ing Group I to the Fourth Assessment Report of the Intergovern-mental Panel on Climate Change, edited by: Solomon, S., Qin, D., Manning, M., Chen, Z., Marquis, M., Averyt, K. B., Tignor, M., and Miller, H. L., Cambridge University Press, Cambridge, UK and New York, NY, USA, 996 pp. 2007.
Kobayashi, E., Uchiyama, A., Yamazaki, A., and Matsuse, K.: Ap-plication of the maximum likelihood method to the inversion al-gorithm for analyzing aerosol optical properties from sun and sky radiance measurements, J. Meteorol. Soc. Jpn., 84, 1047–1062, 2006.
Kuang, Z., Margolis, J., Toon, G., Crisp, D., and Yung, Y.: Space-borne measurements of atmospheric CO2by high-resolution NIR spectrometry of reflected sunlight: An introductory study, Geo-phys. Res. Lett., 29, 1716, doi:10.1029/2001GL014298, 2002. Kuze, A., Suto, H., Nakajima, M., and Hamazaki, T.: Thermal and
near infrared sensor for carbon observation Fourier-transform spectrometer on the Greenhouse Gases Observing Satellite for greenhouse gases monitoring, Appl. Optics, 48, 6716–6733, 2009.
Long, D. A., Bielska, K., Lisak, D., Havey, D. K., Okumura, M., Miller, C. E., and Hodges, J. T.: The air-broadened, near-infrared CO2line shape in the spectrally isolated regime: Evidence of simultaneous Dicke narrowing and speed dependence, J. Chem. Phys., 135, 064308-1–064308-7, 2011.
Messerschmidt, J., Macatangay, R., Notholt, J., Petri, C., Warneke, T., and Weinzierl, C.: Side by side measurements of CO2 by ground-based Fourier transform spectrometry (FTS), Tellus, 62B, 749–758, 2010.
Morino, I., Uchino, O., Inoue, M., Yoshida, Y., Yokota, T., Wennberg, P. O., Toon, G. C., Wunch, D., Roehl, C. M., Notholt, J., Warneke, T., Messerschmidt, J., Griffith, D. W. T., Deutscher, N. M., Sherlock, V., Connor, B., Robinson, J., Sussmann, R., and Rettinger, M.: Preliminary validation of column-averaged volume mixing ratios of carbon dioxide and methane retrieved from GOSAT short-wavelength infrared spectra, Atmos. Meas. Tech., 4, 1061–1076, doi:10.5194/amt-4-1061-2011, 2011. O’Dell, C. W., Connor, B., B¨osch, H., O’Brien, D., Frankenberg,
C., Castano, R., Christi, M., Eldering, D., Fisher, B., Gunson, M., McDuffie, J., Miller, C. E., Natraj, V., Oyafuso, F., Polonsky, I., Smyth, M., Taylor, T., Toon, G. C., Wennberg, P. O., and Wunch, D.: The ACOS CO2retrieval algorithm – Part 1: Description and validation against synthetic observations, Atmos. Meas. Tech., 5, 99–121, doi:10.5194/amt-5-99-2012, 2012.
doi:10.1029/2008JD011465, 2009.
Rayner, P. J. and O’Brien, D. M.: The utility of remotely sensed CO2concentration data in surface source inversions, Geophys. Res. Lett., 28, 175–178, 2001.
Reuter, M., Buchwitz, M., Schneising, O., Heymann, J., Bovens-mann, H., and Burrows, J. P.: A method for improved SCIA-MACHY CO2retrieval in the presence of optically thin clouds, Atmos. Meas. Tech., 3, 209–232, doi:10.5194/amt-3-209-2010, 2010.
Sakai, T., Nagai, T., Nakazato, M., Mano, Y., and Matsumura, T.: Ice clouds and Asian dust studied with lidar measurements of particle extinction-to-backscatter ratio, particle depolarization, and water-vapor mixing ratio over Tsukuba, Appl. Optics, 42, 7103–7116, 2003.
Schutgens, N. A. J., Miyoshi, T., Takemura, T., and Nakajima, T.: Applying an ensemble Kalman filter to the assimilation of AERONET observations in a global aerosol transport model, At-mos. Chem. Phys., 10, 2561–2576, doi:10.5194/acp-10-2561-2010, 2010.
Sekiyama, T. T., Tanaka, T. Y., Shimizu, A., and Miyoshi, T.: Data assimilation of CALIPSO aerosol observations, Atmos. Chem. Phys., 10, 39–49, doi:10.5194/acp-10-39-2010, 2010.
Shimizu, A., Sugimoto, N., Matsui, I., Arao, K., Uno, I., Mu-rayama, T., Kagawa, N., Aoki, K., Uchiyama, A., and Yamazaki, A.: Continuous observations of Asian dust and other aerosols by polarization lidars in China and Japan during ACE-Asia, J. Geo-phys. Res., 109, D19S17, doi:10.1029/2002JD003253, 2004. Shiobara, M., Hayasaka, T., Nakajima, T., and Tanaka, M.: Aerosol
monitoring using a scanning spectral radiometer in Sendai, Japan, J. Meteorol. Soc. Jpn., 69, 57–70, 1991.
Takemura, T., Okamoto, H., Maruyama, Y., Numaguti, A., Hig-urashi, A., and Nakajima, T.: Global three-dimensional simula-tion of aerosol optical thickness distribusimula-tion of various origins, J. Geophys. Res., 105, 17853–17873, 2000.
Takemura, T., Nakajima, T., Dubovik, O., Holben, B. N., and Kinne, S.: Single-scattering albedo and radiative forcing of var-ious aerosol species with a global three-dimensional model, J. Climate, 15, 333–352, 2002.
Tanaka, T., Miyamoto, Y., Morino, I., Machida, T., Nagahama, T., Sawa, Y., Matsueda, H., Wunch, D., Kawakami, S., and Uchino, O.: Aircraft measurements of carbon dioxide and methane for the calibration of ground-based high-resolution Fourier Transform Spectrometers and a comparison to GOSAT data measured over Tsukuba and Moshiri, Atmos. Meas. Tech. Discuss., 5, 1843– 1871, doi:10.5194/amtd-5-1843-2012, 2012.
Toon, G. C., Blavier, J.-F., Sen, B., Salawitch, R. J., Osterman, G. B., Notholt, J., Rex, M., McElroy, C. T., and Russell III, J. M.: Ground-based observations of Arctic O3loss during spring and summer 1997, J. Geophys. Res., 104, 26497–26510, 1999.
Uchino, O., Sakai, T., Nagai, T., Sakashita, T., Suzuki, K., Shi-bata, T., Morino, I., and Yokota, T.: Lidar observation of stratospheric aerosols increased from the 2009 Mount Sarychev volcanic eruption, J. Remote Sens. Soc. Japan, 30, 149–155, 2010 (in Japanese).
Washenfelder, R. A., Toon, G. C., Blavier, J.-F., Yang, Z., Allen, N. T., Wennberg, P. O., Vay, S. A., Matross, D. M., and Daube, B. C.: Carbon dioxide column abundances at the Wisconsin Tall Tower site, J. Geophys. Res., 111, D22305, doi:10.1029/2006JD007154, 2006.
Winker, D. M., Hunt, W. H., and McGill, M. J.: Initial perfor-mance assessment of CALIOP, Geophys. Res. Lett., 34, L19803, doi:10.1029/2007GL030135, 2007.
WMO: The state of greenhouse gases in the atmosphere based on global observations through 2009, WMO Greenhouse Gas Bul-letin, No. 6, 2010.
Wunch, D., Toon, G. C., Wennberg, P. O., Wofsy, S. C., Stephens, B. B., Fisher, M. L., Uchino, O., Abshire, J. B., Bernath, P., Bi-raud, S. C., Blavier, J.-F. L., Boone, C., Bowman, K. P., Browell, E. V., Campos, T., Connor, B. J., Daube, B. C., Deutscher, N. M., Diao, M., Elkins, J. W., Gerbig, C., Gottlieb, E., Griffith, D. W. T., Hurst, D. F., Jim`enez, R., Keppel-Aleks, G., Kort, E. A., Macatangay, R., Machida, T., Matsueda, H., Moore, F., Morino, I., Park, S., Robinson, J., Roehl, C. M., Sawa, Y., Sherlock, V., Sweeney, C., Tanaka, T., and Zondlo, M. A.: Calibration of the Total Carbon Column Observing Network using aircraft pro-file data, Atmos. Meas. Tech., 3, 1351–1362, doi:10.5194/amt-3-1351-2010, 2010.
Wunch, D., Toon, G. C., Blavier, J.-F. L., Washenfelder, R. A., Notholt, J., Connor, B. J., Griffith, D. W. T., Sherlock, V., and Wennberg, P. O.: The Total Carbon Column Observing Network (TCCON), Phil. Trans. R. Soc. A., 369, 2087–2112, doi:10.1098/rsta.2010.0240, 2011a.
Wunch, D., Wennberg, P. O., Toon, G. C., Connor, B. J., Fisher, B., Osterman, G. B., Frankenberg, C., Mandrake, L., O’Dell, C., Ahonen, P., Biraud, S. C., Castano, R., Cressie, N., Crisp, D., Deutscher, N. M., Eldering, A., Fisher, M. L., Griffith, D. W. T., Gunson, M., Heikkinen, P., Keppel-Aleks, G., Kyr, E., Lindenmaier, R., Macatangay, R., Mendonca, J., Messerschmidt, J., Miller, C. E., Morino, I., Notholt, J., Oyafuso, F. A., Ret-tinger, M., Robinson, J., Roehl, C. M., Salawitch, R. J., Sher-lock, V., Strong, K., Sussmann, R., Tanaka, T., Thompson, D. R., Uchino, O., Warneke, T., and Wofsy, S. C.: A method for eval-uating bias in global measurements of CO2total columns from space, Atmos. Chem. Phys., 11, 12317–12337, doi:10.5194/acp-11-12317-2011, 2011.