1
MeÂteÂo-France, CNRM/GAME, URA CNRS 1357, 31057 Toulouse Cedex 1, France
2LTHE, UMR CNRS 5564, INPG, ORSTOM, UJF, BP53 38041 Grenoble Cedex 9, France 3
INRA Bioclimatologie, 84914 Avignon Cedex 9, France
4
Laboratoire d'Ecologie Terrestre, UMR CNRS 5552, 31405 Toulouse Cedex 4, France
5CESBIO, UMR CNRS 141, 31401 Toulouse Cedex 4, France
Received: 9 September 1998 / Revised: 25 February 1999 / Accepted: 26 February 1999
Abstract. The MUREX (monitoring the usable soil reservoir experimentally) experiment was designed to provide continuous time series of ®eld data over a long period, in order to improve and validate the Soil-vegetation-Atmosphere Transfer (SVAT) parameterisat-ions employed in meteorological models. Intensive measurements were performed for more than three years over fallow farmland in southwestern France. To capture the main processes controlling land-atmosphere exchanges, the local climate was fully characterised, and surface water and energy ¯uxes, vegetation biomass, soil moisture pro®les, surface soil moisture and surface and soil temperature were monitored. Additional physiolog-ical measurements were carried out during selected periods to describe the biological control of the ¯uxes. The MUREX data of 1995, 1996, and 1997 are presented. Four SVAT models are applied to the annual cycle of 1995. In general, they succeed in simulating the main features of the fallow functioning, although some shortcomings are revealed.
Key words. Hydrology (evapotranspiration; soil moisture; water-energy interactions).
1 Introduction
The MUREX (monitoring the usable soil reservoir experimentally) experiment (Bessemoulin et al., 1996; Calvetet al., 1998a) was initiated in 1994. At that time, a number of large-scale ®eld experiments focused on land surface-atmosphere interactions had already been
carried out, e.g. HAPEX-MOBILHY (Andre et al., 1986), FIFE (Sellerset al., 1992), EFEDA (Bolle et al., 1993), and HAPEX-Sahel (Goutorbeet al., 1997). These campaigns allowed successful calibration and validation of several soil-vegetation-atmosphere transfer models (hereafter denoted as SVATs), e.g. the ISBA (interaction between soil, biosphere, and atmosphere) scheme devel-oped by Noilhan and Planton (1989) suitable for coupling with meteorological or climate models, or the detailed SiSPAT scheme (simple soil-plant-atmosphere transfer model) designed by Braud et al. (1995). The development and implementation of SVATs in general circulation models (GCM) or climate models clearly demonstrated the positive impact of good representa-tions of vegetation in atmospheric models, particularly its ability to modify turbulent and radiative exchanges, and to modulate the extraction of soil water.
However, the limited duration of such campaigns (no more than two months for most intensive ®eld cam-paigns) prevented testing the model's ability to reproduce the annual or inter-annual water cycle, for which longer validation datasets are required. The motivation for a long-term ®eld documentation of relevant processes was con®rmed by the Project for Intercomparison of Land Surface Parametrisation Schemes (PILPS). In PILPS phase II (Chen et al., 1997), 23 schemes were run to compare the various predicted components of the energy balance with experimental data collected over a meadow at Cabauw, the Netherlands. It was found that even for this relatively simple type of surface, signi®cant dieren-ces occurred between models and observations, and models themselves. For example, the modelled annual mean evaporation ranged between 32 W m)2 (about
400 mm y)1) and 56 Wm)2 (about 710 mm y)1), while
the measured value was 42 Wm)2 (530 mm y)1). Such
large errors of energy ¯ux estimates in atmospheric models may have a powerful impact on predicted soil moisture and surface runo, with a possible feedback on cloud amount and precipitations. Koster and Milly (1997) showed that the large scatter in PILPS ¯ux calculations was related to the modelling of the interplay Correspondence to:J.-C. Calvet
MeÂteÂo-France/CNRM, 42 Av. Coriolis, 31057 Toulouse Cedex 1, France
tial for understanding hydrologic systems, are only accessible from long-term measurements (annual or seasonal cycles).
The resulting MUREX ®eld experiment presented is a joint eort of MeÂteÂo-France/CNRM (Centre National de Recherches MeÂteÂorologiques, Toulouse, France), CESBIO (Centre d'Etudes Spatiales de la BiospheÁre, Toulouse, France) and LTHE (Laboratoire d'Etude des Transferts en Hydrologie et Environnement, Grenoble, France). The site is described and a summary of the database is presented over three annual cycles (1995 to 1997). Finally, dierent modelling approaches are applied to the data of 1995.
2 Main characteristics of the site
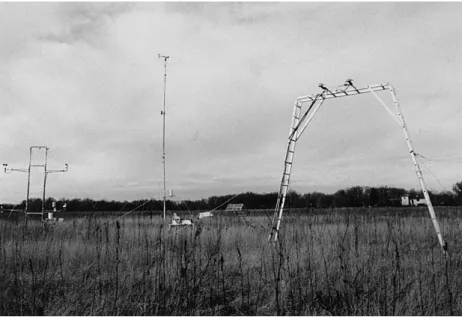
The diculties in maintaining numerous automatic measurements for a long period and in conducting frequent investigations of the soil and vegetation at an isolated site lead to the choice of a site close to CNRM, 30 km away from the city of Toulouse (France). Since the aim of MUREX is to characterise the natural interactions between surface ¯uxes, soil water content, and vegetation functionning, it was intended to:
the valley of the Touch river, 30 m below. The vegeta-tion canopy of the MUREX site consisted of a dense herbaceous agricultural fallow. The main plant species were:Brachypodium spandPotentilla reptans, especially, and also Geranium rotundifolium, Erigeron canadensis, and Rumex acetosa, as observed on day of year (DoY) 293 in 1995. The canopy height ranged from 1 m when vegetation was fully developed, to 0.1 m in winter. The soil was a typical hydromorphic deep `boulbeÁne': the mean texture of the 1 m surface soil layer was that of a silt-loam (the sand and clay fractions were 14 and 28%, respectively). However, strong vertical texture gradients were observed: the proportion of clay increased from 17% at the surface to 40% at 1 m depth. On this type of soil, at about 1 m, a local subsurface soil water convergence might sometimes occur, caused by a tem-porary perched water table over the clay bedrock.
The meteorological variables (precipitation, air tem-perature and humidity, wind speed and direction) at the site were monitored on a 30-min basis together with surface temperature, solar radiation, and the surface ¯uxes: net radiation (Rn), sensible heat ¯ux (H), ground heat ¯ux (G), and by dierence the latent heat ¯ux
LE= Rn)H)G. The other routine surface
measure-ments consisted of weekly pro®les of the deep soil
November of each annual cycle; (4) the CO2¯uxes were
characterised from the summer 1997 to the spring of 1998; (5) the leaf stomatal conductance to water vapour was measured on selected days throughout the studied period, together with the leaf water potential; and (6) the soil hydraulic properties (hydraulic and thermal con-ductivities) were characterised. The latter measurements were particularly useful to run the SiSPAT model (see Sect. 6.3).
3 Routine soil and atmospheric measurements
The soil and atmospheric measurements of MUREX were obtained using methods very similar to those of HAPEX-MOBILHY (Andre et al., 1986): classical me-teorological observations were combined with surface energy and water budget measurements.
3.1 Atmospheric measurements
The equipment employed was similar to the SAMER station described in Goutorbe (1991). Air temperature and humidity were measured at screen-level (2 m). The wind speed (U) and direction were measured by a propeller anemometer at 10 m above the soil surface. The atmospheric pressure was measured and recorded automatically. The station was also able to document the surface energy balance: the net radiation was measured together with the ground heat ¯ux, and the sensible heat was calculated from two-level measure-ments (1.5 m apart) of air temperature and wind speed. The accuracy of the two-level measurements (air tem-perature and wind speed vertical gradients) was one order of magnitude better than the original design: the sensors were changed and thoroughly intercompared at the same level, under very distinct atmospheric condi-tions (i.e. dierent diurnal cycles, strong and low winds, rain/no rain, etc.). However, other uncertainties (e.g. concerning the canopy height estimation) may aect the obtained ¯uxes at short time scales, and the expected accuracy was about 20% (Goutorbe, 1991).
Rainfall (P) was recorded automatically using a tipping bucket rain gauge. Also, shortwave and total (0.3±60 lm), upward and downward radiations were measured. The MUREX station was very reliable for the entire period studied. During 1995 for example less than 6% of surface ¯ux data are missing, 1 to 3% of the radiation (the solar incident radiation Rg and the
missing data in the original dataset were completed by the following formulation, adapted from Staley and Jurica (1972):
Rabb0 frc 1ÿrc 0:67
1670qa0:08g rTa4 1
whereris the Stefan-Boltzmann constant,Ta andqathe air temperature and speci®c humidity (respectively), at screen-level, and rc is the cloud coverage rc2 0;1. The rc parameter was measured at Francazal. The regression coecientsbandb0were determined from the available values ofRaat the MUREX site and from the cloud coveragerc at Francazal. The regression param-eters obtained (for 1995) are b11:3 Wm)2 and b00:9685, with a square correlation coecient r2
of 73% and a standard error of 25 Wm)2. When cloud
coverage observations were not available, Eq. (1) was applied with rc0, and b43:9 Wm)2 and
b01:0056. In this case, the value of r2 is 70% and the standard error is 25 Wm)2. The same method was
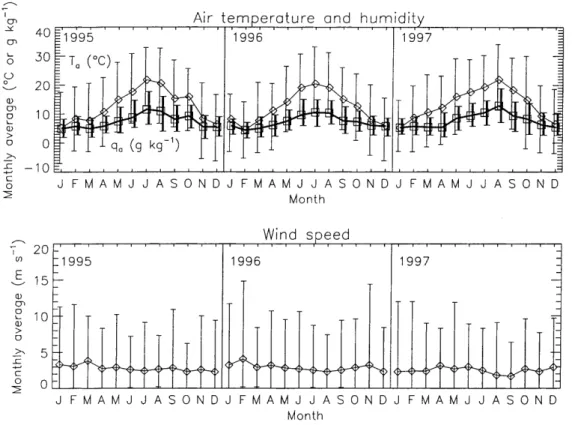
applied to the 1996 and 1997 datasets, with similar results. The 3-y measurements of the atmospheric forcing data P;Rg;Ra;Ta;qa;U, surface ¯uxes (Rn;H;LE;G), and soil moisture, are summarised in Figs. 2, 3, and 4.
The main dierences between the three years are related to changes in the rainfall regime: 1995 was characterised by evenly distributed precipitation (770 mm); 1996 was the wettest year (860 mm), and 1997 was a dry year (540 mm) marked by a spring and an autumn drought (Fig. 2). The droughts of 1997 had a signi®cant impact on the measured surface ¯uxes (Fig. 4): the sensible heat ¯ux exceeded evapotranspira-tion during the autumn 1997 (i.e. from September onward), and the monthly evapotranspiration never exceeded 300 MJ m)2, contrary to that which occurred
in 1995 and 1996. Note that the reduced maximum monthly evapotranspiration in 1997 was also related to lower values of incoming solar radiation (Fig. 2).
3.2 Deep soil moisture measurements
and at 0.2 m intervals below, down to 1.3 m. The measurements were performed at three positions within the fallow site. They were selected after a preliminary gravimetric water contents survey according to the method proposed by Vachaud et al. (1985). In this study, the average value is considered. Once properly calibrated, the neutron probe technique allows accurate measurements of the soil water content. The average volumetric soil moisture measurements of the three
years are displayed in Fig. 4. Again, the three annual cycles contrast sharply: soil water extraction never reached the 1 m depth in 1996, whereas water was extracted over the whole pro®le (i.e. as deep as 1.35 m) in 1995 from July to September. In 1997, water was extracted below 1.35 m, from August onwards. It is interesting to note that the precipitation occurring during the autumn 1997 was not large enough to re®ll the soil reservoir by the end of the year.
Fig. 3. As in Fig. 2, except for air temperature and humidity, Taandqaand wind speed. Air
temperature, humidity, and wind speed are displayed as monthly means with maximum and minimum values indicated withbars. Air temperature and humidity are represented by diamondswithsolid lines, and byboxeswithsolid thick lines, respectively
Using the estimated soil moisture content change together with the measured precipitation and cumulated evaporation and cumulated evaporation, it is possible to assess the water balance on a weekly basis.
3.3 Water balance
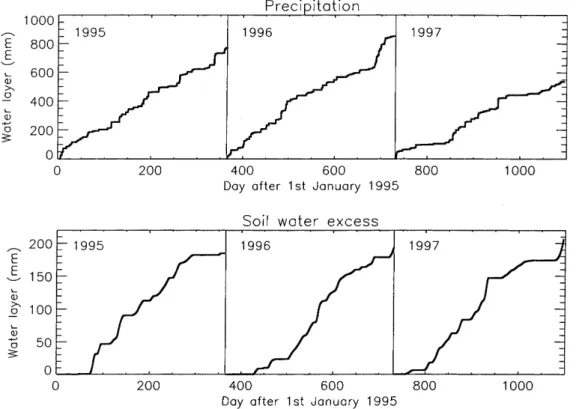
According to the available measurements, the water balance of the MUREX fallow is rather unrepresenta-tive of the climatic or large-scale evaporation over southwestern France. For example, the cumulated estimated evapotranspiration is about 800 mm for 1995, whereas the value of the cumulated precipitation for the same period is 770 mm. The evaporation excess can be explained by a local subsurface soil water convergence which is likely to occur in this kind of terrain. The in situ measurements of bulk soil moisture, precipitation and evapotranspiration can be employed to estimate the weekly water excess Xs (Calvet et al., 1998a):
XsDSRLEÿRP 2
where DS is the change in the soil water storage (S) between two consecutive measurements, from the sur-face to a depth of 1.35 m, and RLE and RP are the cumulated values of evapotranspiration and precipita-tion over the period considered, respectively. The cumulated positive values of Xs are presented in Fig. 5, together with the cumulated precipitation. In general, winter is a period of runo displaying negative values of Xs. Conversely, the in¯ow episodes (positive peak values of Xs) are observed from the beginning of spring to the middle of the autumn. Their sum over any
of the studied annual cycles represents a deep water gain of about 200 mm. The in¯ow can be due to lateral movements of water and (to a lesser extent) to capillarity rises from soil layers deeper than 1.35 m. It produces a signi®cant contribution to the local water balance, especially during the drying periods.
Simple calculations based on tensiometric measure-ments at the bottom of the pro®le indicate that capillarity rises from below 1.35 m do not exceed 4 mm in 1995 (Calvet et al., 1998a). Therefore, most of the water excess seems to be due to lateral movements of water. In the case of the MUREX fallow, part of the in¯ow may be supplied by upstream rain and irrigation drained water (a large proportion of the uphill ®elds consists of irrigated maize).
4 Vegetation dynamics and the water and carbon dioxide ¯uxes
Fallow vegetation resulting from set-aside cultivated ®elds is currently widespread in western Europe. The vegetation of the MUREX fallow consists of many C3
herbaceous plant species whose growing cycles overlap, contributing to maintain a rather dense, evergreen canopy. In order to characterise the fallow, the speci®c contribution of each species was determined using a simpli®ed point quadrats method (Daget and Poissonet, 1971), and the spatial heterogeneity of the vegetation was investigated. Over a total number of 81 species identi®ed on the site, the plants making up the canopy at a given time represented 38 to 55 dierent species. However, the fallow was dominated by a few species only: Brachypodium sp (45% of the plants), and
Potentilla reptans (22%) were the main dominant species, together with Erigeron canadensis, Epilobium tetragonum, and Rumex acetosa. This kind of herba-ceous canopy represents the ®rst stage of a plant succession (once cultivation has stopped) leading to a
Quercus pubescens forest climax. Despite the wide area covered by this type of fallow, they have not been intensively investigated until now, especially concerning their primary production, seasonal dynamics, and the role they play in land-atmosphere exchanges.
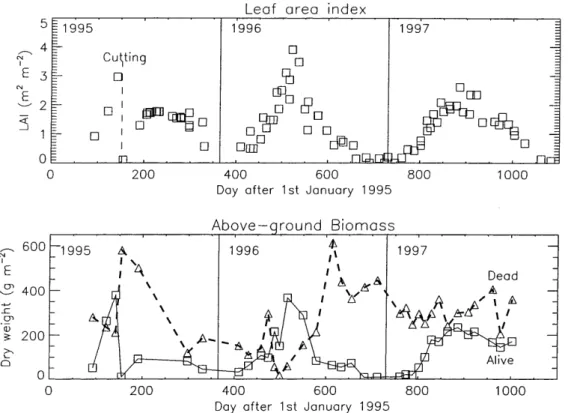
In this section, speci®c biomass and ecophysiological measurements performed with in the framework of MUREX are presented. Green leaf area index (LAI) and biomass measurements were performed by destructive planimetric measurements by CESBIO and CNRM. Figure 6 shows the measured values of LAI together with the dead and living above-ground biomass over the three annual cycles. The dead vegetation residues tend to form a rather dense vegetal mulch at the soil surface. In 1995, the fallow was mown on DoY 152, thus increasing the mulch dead biomass. The rather large scatter ofLAI
is due to the heterogeneous vegetation species distribu-tion. However, clear interannual dierences emerge from the series of observations displayed in Fig. 6. In particular, the maximumLAIwas lower in 1997 than in 1996 (about 2 and 3.5 m2m)2, respectively), consistent
with the precipitation de®cit of 1997, compared with 1996.
As far as root biomass is concerned, an average value of 160 g m)2was obtained by CESBIO from
measure-ments performed on ®ve dierent dates in 1995. It must be noted that most of the roots were found in the 0.25 m surface soil layer. A few roots, representing a very small part of the total root biomass, were observed in deeper
layers (down to 0.70 m). This implies that a large part of the soil water extraction occurring below 0.25 m (Fig. 4) is due to capillarity rises from deeper soil layers, but direct root extraction from below 0.25 m may occur. The deep root extraction could not be quanti®ed.
Using the shortwave radiation measurements men-tioned before, it was possible to determine the albedo (a) of the canopy: a0:200:04 in 1995 and 1996. In 1997, a slightly higher value was obtained:
a0:210:04. Again, this higher value may be related to a quicker wilting and yellowing of the leaves due to the considerable water stress of 1997.
Water and carbon dioxide ¯uxes in the soil-plant-atmosphere continuum widely depend on the vegetation. A speci®c study was conducted during the 1997 and 1998 growing seasons to determine the seasonal and diurnal dynamics of the vegetation features as in¯uenced by environmental conditions.
Stomatal conductance and water potential were measured on leaves of major species from the early spring to the autumn of 1997, along with the biomass and LAI dynamics of the ®eld vegetation. The main conclusions of this series of biophysical measurements for the MUREX fallow are: (1) the plant species exhibited low stomatal resistances, indicating their potential ability to maintain high CO2and water vapour
¯uxes; (2) some dierences between coexisting species occurred, concerning diurnal variations of stomatal conductance and water potential; (3) the diurnal vari-ations of leaf stomatal resistance and water potential diered greatly according to air saturation de®cits and soil moisture conditions.
Carbon dioxide ¯uxes were measured during the 1997 summer period, and in 1998. Two methods were
employed: chamber measurements were performed by CESBIO (using a Ciras-1 PPSystems infrared gas analyser), and CNRM used the eddy-correlation meth-od (using a SOLENT ultrasonic anemometer, and a LICOR LI-6262 infrared gas analyser). The chamber measurements enable estimation of the dierent com-ponents of the net CO2¯ux: (1) the unscreened chamber
over the undisturbed canopy provides the net CO2-¯ux;
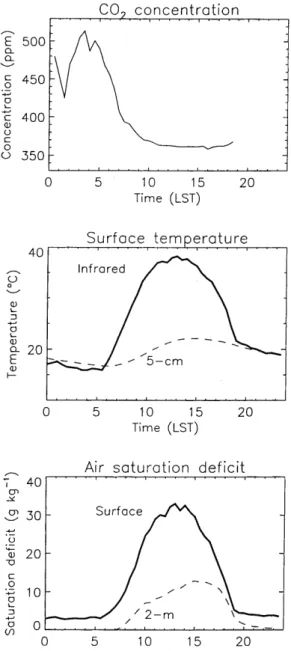
(2) by screening the chamber over the undisturbed canopy, one obtain the total soil and leaf respiration (photosynthesis is suppressed); and (3) by cutting the vegetation before the observation, an estimate of soil respiration is obtained (photosynthesis and leaf respira-tion are suppressed). The ®rst term should correspond to the atmospheric ¯ux measured by the eddy-correlation method. Figure 7 presents a series of bioclimatic variables observed on DoY 247 in 1997. The atmo-spheric net CO2-¯ux obtained by the two methods
(either chamber or eddy-correlation measurements) are in good agreement. The canopy net assimilationAn(i.e. the quantity of CO2 integrated into the vegetation
biomass through the photosynthesis process) may be much higher than the measured atmospheric CO2-¯ux
presented in Fig. 7 because the plant may absorb the CO2emitted by the soil, also. An estimation ofAnis the
dierence between the atmospheric CO2-¯ux and soil
respiration: on DoY 247 in 1997 (Fig. 7), the obtained net assimilation reaches 0.5 mg m)2s)1 at about
0900 LST and 1500 LST, whereas the atmospheric CO2-¯ux does not exceed 0.3 mg m)2s)1. The An and
evapotranspiration `plateau' observed between 0900 and 1500 LST (Fig. 7) may be related to stomatal closure due to high temperatures or to a large saturation de®cit of the air within the canopy. It is interesting to note that the average behaviour of the canopy in terms of
stomatal conductance may result from distinct diurnal variations of this parameter from one plant species to another (Fig. 7).
5 Surface soil moisture and temperature 5.1 Surface soil moisture measurements
Surface soil moisture was estimated either manually (by weighing samples collected in the ®eld) or automatically (in situ capacitive measurements).
In 1995, soil moisture pro®les within the top 5-cm soil layer were measured manually, twice a day, during two 30-day intensive observing periods (IOPs) in spring and autumn: 1-from DoY 114 to 143 for the spring-IOP, 2-from DoY 269 to 298 for the autumn-IOP. Each measurement consisted of the gravimetric moisture of 36 (6 layers´ 6 sites) soil samples, determined by a direct oven-drying method. The soil moisture content was measured: (1) from the surface to the 5-cm depth with a resolution of 1 cm, and (2) for the 0.5-cm surface layer. The volumetric moisture w (m3m)3) is derived
from the gravimetric measurementsh (kg of water per kg of dry soil) by:
wqb
qwh 3
whereqb is the soil dry bulk density andqw the density of liquid water (kg m)3). The value ofq
bdid not change signi®cantly from one IOP to the other: the measured values over the surface 5-cm layer are 1452 87 and 1450 114 kg m)3 on DoY 123 and 286 of 1995,
respectively.
The automatic method was implemented at the end of 1996. Four capacitive probes (ML1 ThetaProbe, Delta-T Devices 1996) were inserted into the soil surface and kept vertical by using an adequate frame. The output volumetric moisture represents an integrated value over the top 6-cm at the soil surface. The observations were recorded on a 15-min basis, and a linear correction was applied to the raw data according to manual measurements (oven-drying method). After calibration, the rms dierence between the ThetaProbe data and the reference measurements was about 0.01 m3m)3.
The average surface soil moisture is presented in Fig. 8, together with the bulk soil moisture obtained from the neutron-probe measurements over the 1.35 m pro®le. Interestingly, the measurements of 1997 show that the surface soil moisture can be much lower than the bulk soil moisture during long periods (e.g. Septem-ber and OctoSeptem-ber 1997). This is related to the vertical gradients of texture and bulk density observed on the site: the wilting-point soil moisture is lower close to the surface than deeper in the soil, permitting lower values of the soil water content. Direct soil evaporation is expected to have a minor in¯uence on the decrease of
Fig. 7. Measurements characterising the bioclimatological function-ing of the MUREX fallow on DoY 247 in 1997. The atmospheric CO2¯ux and concentration are measured at 2.7 m above the soil
surface (solid lines); chamber measurements of the net CO2¯ux are
obtained overPotentilla- andBrachypodium-dominated spots (pluses and diamonds, respectively); the negative CO2 ¯ux represented by
boxescorresponds to chamber measurements of soil respiration. The CO2¯ux represented by thedashed lineis an estimation of daytime net
assimilation given by the dierence between the atmospheric CO2¯ux
surface soil moisture because of the mulch screening eect.
5.2 Surface temperature and emissivity
In this study, six temperatures characterising the surface were measured: the infrared temperature (TIR) is ob-tained from an infrared radiometer, and the soil temperature at 1, 5, 20, 50, and 120 cm below the soil surface (Tÿ1; Tÿ5 and Tÿ20; Tÿ50, andTÿ120,
respective-ly) were measured with platinum-resistance thermome-ters. The surface temperature Ts was derived from TIR and an eective emissivity (eeff):
Ts TIR4=eeff
8
:
9
; 1=4
4
The value eeff 0:977 could be estimated from Eq. (4) by assuming thatTsTÿ1when no vertical gradients of
temperature were observed at the soil surface (i.e.
Tÿ1 Tÿ5) after sunset, between 2000 and 2100 Local
Standard Time (LST).
The thermal emissivity of the surface (es) is a parameter of the SVATs. The value of es can be retrieved from Ts and the radiation measurements. Indeed, the measured upwelling thermal emission of the surface (Rs) can be written as:
Rses rTs4 1ÿesRa 5
The value es0:97 minimises the rms dierence be-tween the measured value ofRs, and the value given by Eq. (5): the rms dierence is 10.6 Wm)2and over 1995,
the mean bias is less than 2 Wm)2.
6 Modelling approaches
The main purpose of the MUREX experiment is to improve the representation of the land-surface processes in atmospheric models. Improved numerical experi-ments and new analysis algorithms and parametrisations based on these data are presented in other studies. In particular, the ISBA scheme was employed in several con®gurations to analyse the MUREX data: (1) the data of 1995 were used to test an assimilation technique to analyse the total soil water content from surface soil moisture or surface temperature (Calvet et al., 1998a); and (2) a new version of ISBA including CO2
assimi-lation and plant growth (ISBA-Ags) was applied to the data of 1995 and 1996 (Calvetet al., 1998b).
In this study, simulations performed by four models over the 1995 annual cycle (ISBA, MAGRET, SiSPAT, and ALiBi) are compared. All the models are driven by measurements of incoming radiation, precipitation, atmospheric pressure, air temperature and humidity, and wind speed at a reference level. Also, vegetation characteristics such as leaf area index and canopy height must be prescribed. These parameters may change with time. The ISBA (Noilhan and Planton, 1989) and MAGRET (Lagouarde, 1991; Courault et al., 1996) models have similar functions and input and output variables: they both describe the water division between the vegetation transpiration, the drainage, the surface runo and the soil moisture increase or decrease, and they both solve a single energy budget and compute the surface temperature. This kind of models represents a particularly robust approach to describe how land surface functions over long periods, at low computing
6.1 ISBA
In this study, the most recent standard version of ISBA (Noilhan and Mahfouf, 1996), implemented within the MeÂteÂo-France global climate model ARPEGE by Ma-hfouf et al. (1995) is employed. The ISBA scheme simulates the surface ¯uxes (LE,H,G) and predicts the evolution of the surface state variables using the equations of the force-restore method of Deardor (1977, 1978). Five variables (surface temperature Ts,
mean surface temperature T2, surface soil volumetric
moisture wg, total soil volumetric moisturew2, and the
canopy interception reservoir Wr) are obtained through
prognostic equations. It must be noted that ISBA does not need a root distribution: w2 is the volumetric soil
moisture associated to a bulk layer of thickness d2
including the root zone. The surface soil moisturewgis
computed to estimate the evaporation from the soil surface, whereas the transpired water is extracted from
w2. The surface water quantity fromwgis included inw2.
Initial values of soil variables are required. In this study, the contribution of the water excess caused by a perched aquifer or by deep capillarity rises (measured positive values ofXs) is accounted for in the water budget as in
es (z0andz0h, respectively) and the vegetationLAIand
minimal stomatal resistance (rsmin, expressed in units of
sm)1). This latter term depends on the plant species
making up the canopy, and in general must be calibrat-ed. The surface albedo and emissivity are prescribed from measurements and z0 is derived from the
vegeta-tion height estimates (h) through: z0= 0.13 ´h.
Ta-ble 1 displays the ISBA structure parameters either obtained from the in situ measurements, derived from the soil texture (wwilt, wsat), or calibrated (wfc, c, es,Cv, rsmin,z0/z0h). The procedure to obtain calibrated values
is detailed in Calvet et al. (1998a). Note that in this study, all the parameters were calibrated according to
Rn,H, andLE, whereas the cumulativeGwas also used
in Calvet et al. (1998a). Therefore, the Table 1 param-eter values (especially Cv and z0/z0h) dier from those
given by Calvetet al. (1998a). The calibrated ratioz0/z0h
(Table 1) employed for ISBA (and MAGRET) reaches a high value of 450, whereas a value of 10 is usually employed for small vegetation canopies. However, many authors have reported high values ofz0/z0h(even higher
than 450) for a wide range of surfaces (see Verhoefet al., 1997 for a review, and Trou¯eauet al., 1997). Verhoef
et al. (1997) suggest that z0/z0h= 10 is probably too
low for most natural surfaces.
Table 1. The soil and vegetation structure parameters over the MUREX fallow for ISBA and MAGRET
Symbol De®nition Value
ISBA and MAGRET:
d2 Soil root depth 1.35 m
CLAY Clay fraction 28%
SAND Sand fraction 14%
wwilt Wilting point 0.20 m3m)3
wfc Field capacity 0.34 m3m)3
a Albedo 0.20
es Emissivity 0.97
rsmin Minimum stomatal resistance 50 sm)1
z0/z0h Roughness length ratio 450
ISBA:
c Deep heat transfer contribution 1
veg Vegetation coverage 95%
Cv Thermal coecient 2.0´10)5Km2J)1
MAGRET:
vegetation structure resistances, a resistance to soil evaporation related to the surface dry soil layer, and the plant stomatal resistance. This latter resistance is calculated in the same way as in ISBA. Concerning soil moisture, the two reservoir systems proposed by Jac-quart and Choisnel (1995) is employed. Each reservoir corresponds to a layer of wetted soil, the thickness of which vary according to the computed loss (evapotran-spiration) or gain (rainfall) of water. Since the MUREX water excess cannot be included in a bulk soil reservoir as in ISBA, the water excess was added to the precipitation prescribed for MAGRET (Table 2).
Another dierence concerns the calculation of the ground heat ¯uxGand the eect of vegetation. In ISBA,
G is the residual of the energy budget. The obtained value ofGis employed in the pronostic equation for the surface temperature, weighted by a thermal coecient including a vegetation term Cv. In MAGRET, G is computed from the temperature gradient at the surface and an exponential attenuation term depending onLAI
times the extinction coecient d(Table 1). The MAG-RET model computes the diurnal evolution of the canopy albedo. In this study, the albedo module was inactivated and the average value of 0.2 was imposed as in ISBA.
6.3 SiSPAT
In the SiSPAT model (Braud et al., 1995) the transfers in the soil are described in more detail: the vertical heterogeneity of the soil structure and texture is accounted for, and a root distribution must be pre-scribed. The heat and water exchanges are speci®ed through Fourier and Richards' equations, and the soil prognostic variables are vertical pro®les of temperature and soil matric potential. Consistent with the accurate description of the soil processes, the vegetation layer is depicted more precisely than in ISBA and MAGRET: the radiative transfer within the canopy is accounted for,
showed that, using SiSPAT, water and energy transfer within the mulch layer must be explicitely described, especially after the vegetation cutting in 1995, on DoY 152. Accounting for the mulch greatly improves the SiSPAT simulations over MUREX. To summarise, the mulched simulations present higher values of bulk soil moisture and lower values of evapotranspiration. The ¯ux simulation after the vegetation cutting of DoY 152 is erroneous in non-mulched simulations. In particular soil evaporation is greatly overestimated, which brings about a rapid soil moisture depletion aecting the quality of the ¯ux simulation afterwards. In the simu-lations presented, SiSPAT was run with the same rsmin
than ISBA and MAGRET (Table 1). Displacement height and roughness length for momentum were calculated as a function of leaf area index and vegetation height (Shuttleworth and Wallace, 1985). The z0/z0h
values are given by the formula of Brutsaert (1982, cited by Verhoef et al., 1997). The rooting depth varies with time from 0.5 to 0.7 m according to the observed soil moisture pro®les. The maximum root density was set at 2´ 104m m)3. A vegetation albedo of 0.15 was
employed, and the bare soil or mulch albedo was calculated so that the total albedo equal 0.20. The other vegetation parameters employed in SiSPAT are: the critical leaf potential ()140 m), and the total plant resistance (3.2 1012 s m)1).
As with ISBA and MAGRET, it was found that the water excess Xs must be added to the water input in order to simulate the water budget. In order to avoid the water loss due to interception by the mulch and the vegetation, the water excess was applied to the surface soil layer (instead of directly increasing the precipita-tion). The soil parameters employed in SiSPAT are displayed in Table 3. Five horizons are distinguished, from the surface to the total soil column depth (1.35 m). The employed suction curve, relating the volumetric water content wto the matric potentialh(expressed in units of m) consists of the Van Genuchten (1980) formula:
Table 2. The MUREX 1995 water budget as calculated by ISBA, MAGRET, and SiSPAT
Model Precipitation (mm)
Water excess (mm)
Evaporation (mm)
Drainage (mm)
Surface runo (mm)
Soil moisure change (mm)
Error (mm)
ISBA 773 184 856 95 0 6 0
MAGRET 957 ± 884 125 0 )52 0
wsat
1
hg
> > :
> >
; 6
where wsat is the saturated water content (m3m)3) and
hg(m) a scale factor. The hydraulic conductivity curve is
given by Brooks and Corey (1964):
K w Ksat w=wsatc 7
where Ksat is the saturated hydraulic conductivity (m s)1) andca scale factor. Field estimates ofK
sat were obtained from in®ltration tests performed using either tension disk in®ltrometers (Vauclin and Chopart, 1992) or Guelph in®ltrometers (Elrick and Reynolds, 1992), for the 0±30 cm surface layer and the deepest layers, respectively.
The thermal conductivity k (expressed in units of Wm)1K)1) is given by the following equation, obtained
from in situ measurements by the line source method (Laurent, 1989), completed with a laboratory charac-terisation of the volumetric moisture content (w) dependence:
k0:7290:135 w=wsat
1:26 1ÿexp ÿ10:39 w=wsat1:84
h i
8
The dierent terms of the MUREX water budget for 1995, including soil moisture change and total runo, are simulated by ISBA, MAGRET, and SiSPAT (Table 2). Note that in the SiSPAT simulations the water budget is not completely balanced (error of 15 mm) because of numerical cumulative inaccuracies occurring during soil moisture saturation. The ALiBi model presented below does not consider soil moisture change.
6.4 ALiBi
The ALiBi model was proposed by Olioso (1992) to relate evapotranspiration and photosynthesis to re¯ec-tance and infrared brightness temperature measure-ments. In order to derive evapotranspiration and photosynthesis the ALiBi model has to be used in an inverse mode (Olioso et al., 1996b): the modelled thermal brightness temperature is ®tted to temperature measurements by adjusting some input parameters (usually related to water transfers through the plants).
energy balance model. Energy balance ¯uxes, as well as photosynthesis, are calculated using detailed descrip-tions of radiative transfer, turbulent transfer, water transfer, stomatal conductance and leaf photosynthesis. The vegetation conductancegsis given by the sum of
the leaf stomatal conductances over the whole canopy. Leaf stomatal conductances depend on incident PAR at leaf surface, leaf water potential and air saturation de®cit at leaf surface (Winkel and Rambal, 1990). Another important equation describes water transfers from the soil to the leaves, where transpiration occurs. Like SiSPAT, it follows Van den Honert's formulation and relates transpiration (LEt) to the variation of water
potential between the soil and the leaves (h and hv,
respectively) by means of an hydraulic conductance (Gp), assumed constant for a given day:
LEtGp hÿhm 9
A detailed description of water transfer, stomatal conductance and photosynthesis calculation was pre-sented by Oliosoet al. (1996a).
In the case of the MUREX dataset, evapotranspira-tion, canopy energy ¯uxes and photosynthesis were estimated by inverting the ALiBi model daily, according to the measured thermal brightness temperature (TIR) at
midday (174 days between DoY 125 and 317 in 1995): each day, the simulated midday TIR was ®tted to the
measured value (0.25 K) by adjusting the hydraulic conductance parameter Gp. The other necessary inputs
were: (1) either directly measured (LAI, canopy height, air temperature, air humidity and wind speed at a reference level above the canopy, solar and atmospheric radiations, atmospheric pressure), (2) computed from measured inputs (incident PAR, solar and PAR diuse fraction and atmospheric radiation in the spectral range of the thermal radiometer), and (3) estimated from the values obtained for a soyabean crop in Avignon (Olioso
et al., 1996a). The latter parameters consisted of soil thermal characteristics, leaf aerodynamic properties, parameters for stomatal conductance and leaf photo-synthesis, optical properties of leaves and soil and leaf angle distribution. In particular, a maximum leaf stomatal conductance of 15 mm s)1 was employed.
The root zone water potential and the soil temperature at a depth of 1 m were set to constant average values of
the model outputs with the measured values of surface ¯uxes, and for ISBA, MAGRET, and SiSPAT, the surface temperature and the total soil moisture.
7.1 Surface ¯uxes
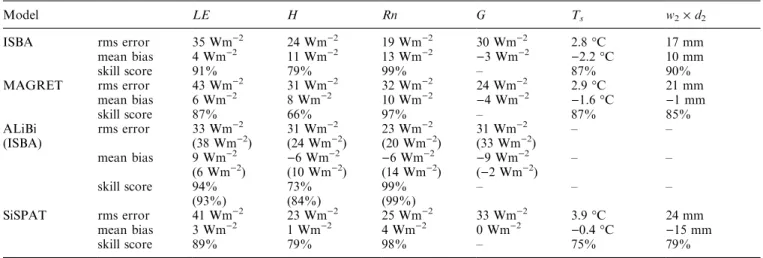
The values of the simulated instantaneous and cumu-lated ¯uxes obtained with the structure parameters listed in Tables 1 and 3 are compared with the observed values in Table 4 and in Fig. 9, respectively. Figure 10 presents the smoothed daily evapotranspiration over the 1995 annual cycle, either measured by the SAMER system or modelled by ISBA, MAGRET, ALiBi, and SiSPAT. the ALiBi simulations do not cover the entire annual cycle, since they rely on TIR measurements, available in
summer and autumn 1995, only. The errors aecting the simulated ¯uxes are listed in Table 4 in terms of rms error, mean bias (simulated minus observed), and skill score. The model skill score Eis de®ned as:
E1ÿ
P
i
xiOBSÿxiMOD
2
P
i
xiOBSÿxOBS
2 10
where x are half-hourly values of the ¯ux, either measured or simulated (OBS and MOD subscripts, respectively). A value of E of 100% corresponds to
explained by the in¯uence of the mulch: the explicit simulations of the mulch eect by SiSPAT, in partic-ular, shows that the presence of a mulch signi®cantly modi®es the surface energy balance by decreasing soil evaporation and soil temperature, and increasing soil surface water content. Another problem caused by the mulch is that in reality, the heat storage in the soil is conditioned by the mulch whereas the measuredGwas obtained from heat ¯ux plates buried at a 3-cm depth in the soil. Although a correction was made to account for the eect of the 3-cm soil top layer on G, the mulch eect could not be properly characterised, and the soil heat ¯ux at the surface of the mulch could not be properly evaluated. It appears that the simulatedG (at the mulch surface) displays a much larger diurnal cycle than the measured one. This aects the estimation of the latent heat ¯ux, which was derived from the surface energy budget. On the other hand, the mean bias overG
is very small with SiSPAT (Table 4) and the cumulated ¯ux is simulated well (Fig. 9). The overestimation ofRn
with ISBA and MAGRET (Table 4) is consistent with the overestimation ofHand suggests that the modelled surface temperature is underestimated (because more energy is removed from the surface through the heat ¯ux in the model). The reverse conclusion can be drawn from the results of ALiBi, which uses the observed bulk temperatureTIR to estimate the ¯uxes (bothRn and H are underestimated), suggesting that the three models
Table 4. Errors aecting the simulated half-hourly outputs of ISBA, MAGRET, ALiBi, and SiSPAT in terms of rms error, mean bias (simulated minus observed), and model skill score on: evapotranspiration (LE), heat ¯ux (H), net radiation (Rn), soil
heat ¯ux (G), surface temperature (Ts), and soil water storage
(w2´d2). Note that ALiBi's simulation only covers some periods
and that ISBA's scores for the ALiBi's periods are shown in parenthesis
Model LE H Rn G Ts w2´d2
ISBA rms error 35 Wm)2 24 Wm)2 19 Wm)2 30 Wm)2 2.8°C 17 mm mean bias 4 Wm)2 11 Wm)2 13 Wm)2
)3 Wm)2 )2.2°C 10 mm
skill score 91% 79% 99% ± 87% 90%
MAGRET rms error 43 Wm)2 31 Wm)2 32 Wm)2 24 Wm)2 2.9°C 21 mm mean bias 6 Wm)2 8 Wm)2 10 Wm)2
)4 Wm)2 )1.6°C )1 mm
skill score 87% 66% 97% ± 87% 85%
ALiBi rms error 33 Wm)2 31 Wm)2 23 Wm)2 31 Wm)2 ± ±
(ISBA) (38 Wm)2) (24 Wm)2) (20 Wm)2) (33 Wm)2) mean bias 9 Wm)2
)6 Wm)2 )6 Wm)2 )9 Wm)2 ± ±
(6 Wm)2) (10 Wm)2) (14 Wm)2) (
)2 Wm)2)
skill score 94% 73% 99% ± ± ±
(93%) (84%) (99%)
SiSPAT rms error 41 Wm)2 23 Wm)2 25 Wm)2 33 Wm)2 3.9°C 24 mm mean bias 3 Wm)2 1 Wm)2 4 Wm)2 0 Wm)2
)0.4°C )15 mm
have diculties in accounting for the mulch eect. As far as the latent heat ¯ux is concerned, both instanta-neous and cumulated ¯ux values are relatively well simulated by the models (the model skill score is about 90% for all the models). After DoY 270 in 1995, all the models tend to overestimate evapotranspiration (Fig. 10). This may be caused, probably, by overesti-mated values of LAI during this period (Fig. 6), imposed on all the models. The high value of the observed cumulated evapotranspiration (Fig. 9) is well reproduced by ISBA, MAGRET, and SiSPAT, with a rather low minimum stomatal resistance:
rsmin50 s mÿ1. It must be noted that this value is comparable with previous calibrations of ISBA over
grasslands (Noilhan et al., 1993). It is interesting to note that high evapotranspiration rates are also ob-tained with ALiBi, based on surface temperature data only, without describing the soil water budget and the water excess.
7.2 Surface temperature
The errors on surface temperature are listed in Table 4. On average, the surface temperatures simulated by ISBA and MAGRET tend to be lower than the measuredTs. This is particularly true for ISBA, with a mean bias of
)2.2°C. This is consistent with the bias between the
ation (Rn), and heat storage in the soil and the biomass (G) over 1995. Thethick solid line represents the measured val-ues. The simulations are rep-resented by:®ne solid line (SiSPAT), anddashed lines (®ne dashesfor ISBA, and thick dashesfor MAGRET)
s nighttimeTs by SiSPAT.
7.3 Soil moisture
Figure 11 presents the values of the total soil water content simulated by ISBA, MAGRET, and SiSPAT. The agreement is relatively good, with a rms error of 17 and 21 mm for ISBA and MAGRET, respectively, and 24 mm for SiSPAT (Table 4). As shown in Fig. 11, the soil moisture simulated by ISBA may be higher than ®eld capacity in wintertime. Although this is physically possible (soil moisture at saturation is higher than the ®eld capacity equilibrium value), it condradicts the observations and may denote a problem in the para-metrisation of in®ltration and drainage. MAGRET and SiSPAT present lower soil moisture values during autumn. This latter feature corresponds to the negative soil water change obtained with these models in Table 2. The problem with the simulation of the root soil moisture in ISBA (or MAGRET) is related to the diculty of de®ning the root zone and the absence of a description of the amount of water either directly extracted by the roots or provided by the capillarity rises (Boone et al., 1999). The soil water stress function employed in the expression of stomatal resistance may also dier from reality in some cases. Finally, it is
Calvet et al. (1998a). It was shown that the ISBA wg
outputs compare well with the measurements corre-sponding to a value integrated over the soil top 5-cm layer. Using SiSPAT, the observed high values ofwgare
better reproduced by explicitly modelling the transfers within the mulch (Gonzalez-Sosaet al., 1999).
7.4 Net assimilation of carbon dioxide
As CO2 net assimilation by the canopy (An) was not
measured in 1995, only modelled annual cycles are presented in Fig. 12. Values of An are provided by ALiBi, and also by the new version of ISBA computing photosynthesis (Calvet et al., 1998b): ISBA-Ags. The curve displayed in Fig. 12 concerning ISBA-Ags was obtained by imposing the same LAI values as for the other models. Namely, ISBA-Ags was run in the con®guration where photosynthesis and stomatal con-ductance are calculated as in Jacobs et al. (1996), without inferring plant growth. Both models give a realistic magnitude of net assimilation (based on the CO2-¯ux measurements of 1997 and 1998 presented in
Sect. 4) and the general trend is the same. However, the
Anvalues given by ALiBi are 15% larger than the ISBA-Ags ones, on average.
Fig. 11. The measured (pluses) and simulated (solidanddashed lines) soil water content of the 1.35 m soil column in 1995. The measurements dier slightly from those presented in Calvet et al. (1998a) because the neutron probe output calibration was re®ned, and all the measured sites are presented
Fig. 12. The daily net CO2assimilation as modelled by ISBA-Ags
clear dependence on the rainfall regime: the maximum
LAI varied between 2 and 3.5 according to the year considered. Data analysis and model results show that transfers of heat and water were in¯uenced by the presence of a mulch in the vegetation layer. This led to diculties especially in the estimation of the ground heat ¯ux and consequently on the latent heat ¯ux, derived as the residual of the energy budget. The existence of lateral transfers associated with a perched water table was also shown. However, the measurement uncertainties make their exact quanti®cation dicult.
The data of 1995 were employed to assess the ability of the surface schemes ISBA, MAGRET, SiSPAT, and ALiBi to simulate properly the energy and water budgets of a vegetated surface over a complete annual cycle. The surface schemes describing soil moisture and the water balance (ISBA, MAGRET, and SiSPAT) were modi®ed to include the contribution of lateral transfers to the water input. SiSPAT was also modi®ed to explicitely model heat and water transfers within the mulch. Although this allowed a signi®cant improvement of the model results, further studies are needed to better assess the in¯uence of mulch parameters on the results. Data from 1996 and 1997 will be used to re®ne the mulch parameters and the occurrence of capillarity rises and lateral in¯ows.
All the models are able to reproduce the general trend of the measured variables. However, the surface tem-perature is signi®cantly underestimated by ISBA and MAGRET. The CO2 net assimilation simulated by
ALiBi is also signi®cantly dierent from the ISBA-Ags results. It must be noted that any SVAT o-line simulation requires prescribed boundary conditions. Together with the observed atmospheric forcing and vegetation characteristics, such as LAI, the studied models (apart from ALiBi) use estimates of water excess
Xs (Sect. 3.3) and deep soil temperature, obtained from the ®eld measurements. Soil water excess, which results from lateral transfers, cannot be simulated by 1D SVATs and must be prescribed from observations. These ground boundary conditions are far from being major components controlling the seasonal evolution but need to be accounted for in order to simulate the observed energy and water budgets. Of course, a part of the model interseasonal to inter-annual variability is
surface. Such a dataset could be useful to complete the on-going intercomparison PILPS program (Chenet al., 1997). In particular, the PILPS program has shown that dierent parametrisations of soil water and runo can cause a very large variability in the simulated root-zone soil moisture. Also, the functional relationship between the parametrisation of the root-zone soil moisture and the evapotranspiration vary from one model to another (Mahfoufet al., 1996).
It is likely that such a dataset will also be employed to analyse the model shortcomings and to propose new parametrisations. Moreover, the MUREX dataset may be useful to test assimilation techniques. For example, Calvetet al.(1998a), using the measurements of surface soil moisture and surface temperature, have proposed assimilation rules of these variables to retrieve the root-zone soil water content.
Acknowledgements. This work was funded by the Conseil ReÂgio-nal de Midi-PyreÂneÂes, the Programme NatioReÂgio-nal de Recherche en Hydrologie, and by participants to the ®eld programme (MeÂteÂo-France/CNRM, CESBIO, LTHE).
Topical Editor J.-P. Duvel thanks Yongkang Xue and another referee for their help in evaluating this paper.
References
AndreÂ, J.-C., J.-P. Goutorbe, and A. Perrier,HAPEX-MOBILHY: a hydrologic atmospheric experiment for the study of water budget and evaporation ¯ux at the climate scale, Bull. Am. Meteorol. Soc.,67(2),138±144, 1986.
Bessemoulin, P., J.-C. Calvet, G. Jaubert, J. Noilhan, D. Vignes, C. Tosca, I. Braud, R. Haverkamp, J.-L. Thony, and M. Vauclin,
MUREX : Un programme de suivi du cycle annuel des eÂchanges de masse et d'eÂnergie entre sol, veÂgeÂtation, et atmospheÁre. Premiers enseignements, in Atelier ExpeÂrimentation et Instru-mentation, MeÂteÂo-France/CNRM, October 1996, Toulouse, pp. 289±294, 1996.
Bolle, H. J., J.-C. AndreÂ, J.-L. Arrue, H. K. Barth, P. Bessemoulin, et al.,EFEDA: European ®eld experiment in a deserti®cation-threatened area,Ann. Geophysicae,11,173±189, 1993.
Boone, A., J.-C. Calvet, and J. Noilhan,Inclusion of a third soil layer in a land-surface scheme using the force-restore method, J. Appl. Meteorol., in press, 1999.
Braud, I., A. C. Dantas-Antonio, M. Vauclin, J.-L. Thony, and P. Ruelle, A simple soil-plant-atmosphere transfer model (Si-SPAT): development and ®eld veri®cation, J. Hydrol., 166,
Chen, T. H., A. Henderson-Sellers, P. C. D. Milly, A. J. Pitman, A. C. M. Beljaars, et al.,Cabauw experimental results from the project for intercomparison of landsurface parametrisation schemes (PILPS),J. Clim.10,1194±1215, 1997.
Courault, D., J.-P. Lagouarde, and B. Aloui, Evaporation for maritime catchment combining a meteorological model with vegetation information and airborne surface temperatures, Agric. For. Meteorol.,82,93±117, 1996.
Daget, P., and J. Poissonet, Une meÂthode d'analyse phytologique des prairies. CriteÁres d'application. Ann. Agronom., 22, 5±41, 1971.
Deardor, J. W.,A parametrisation of the ground surface moisture content for use in atmosphere predictions models, J. Appl. Meteorol.,16,1182±1185, 1977.
Deardor, J. W.,Ecient prediction of ground temperature and moisture with inclusion of a layer of vegetation, J. Geophys. Res.,83,1889±1903, 1978.
Elrick, D. E., and W. D. Reynolds,Methods for analysing constant-head well permeameter data,Soil Sci. Soc. Am. J.,56(1),320± 323, 1992.
Goutorbe, J.-P., A critical assessment of the Samer network accuracy, In Eds T. J. Schmugge, and J. -C. AndreÂLand surface evaporation. Measurement and parametrisation, Springer-Verlag, Berlin Heidelberg, New York, pp. 171±182, 1991.
Goutorbe, J.-P., T. Lebel, A. J. Dolman, J. H. C. Gash, P. Kabat, et al., An overview of HAPEX-Sahel: a study in climate and deserti®cation,J. Hydrol.,188±189, 4±17, 1997.
Jacobs, C. M. J., B. J. J. M. van den Hurk, and H. A. R. de Bruin,
Stomatal behaviour and photosynthetic rate of unstressed grapevines in semi-arid conditions, Agric. For. Meteorol., 80,
111±134, 1996.
Jacquart, C., and E. Choisnel, Un modeÁle de bilan hydrique simpli®e aÁ deux reÂservoirs utilisable en agromeÂteÂorologie, La MeÂteÂorol.,8(9),29±43, 1995.
Koster, R. D., and P. C. D. Milly, The interplay between transpiration and runo formulations in land surface schemes used with atmospheric models, J. Clim., 10(7), 1578±1591, 1997.
Lagouarde, J.-P.,Use of NOAA-AVHRR data combined with an agrometeorological model for evaporation mapping, Int. J. Remote Sens.,12(9),1853±1864, 1991.
Laurent, J.-P.,Evaluation des parameÁtres thermiques d'un milieu poreux: optimisation d'outils de mesure `in situ', Int. J. Heat Mass Trans.,32(7),1247±1259, 1989.
Noilhan, J., J.-F. Mahfouf, A. Manzi, and S. Planton,Validation of land-surface parametrisations: developments and experiments at the French weather service, in Validation of models over Europe (2), ECMWF seminar proceedings, Reading [7±11 September 1992] pp. 125±158, 1993.
Olioso, A., Simulation des eÂchanges d'eÂnergie et de masse d'un couvert veÂgeÂtal, dans le but de relier la transpiration et la photosyntheÁse aux mesures de re¯ectance et de tempeÂrature de surface. PhD Thesis, University of Montpellier, France, 1992.
Olioso, A., T. Carlson, and N. Brisson, Simulation of diurnal transpiration and photosynthesis of a water stressed soybean crop,Agric. For. Meteorol.,81,41±59, 1996a.
Olioso, A., O. Taconet, and M. Ben Mehrez,Estimation of heat and mass ¯uxes from IR brightness temperature, IEEE Trans. Geosci. Remote Sensing,34,1184±1190, 1996b.
Sellers, P., F. G. Hall, G. Asrar, D. E. Strebel, and R. E. Murphy,
An overview of the First International Satellite Land Surface Climatology Project (ISLSCP) Field Experiment (FIFE), J. Geophys. Res.,97(D17),18 345±18 371, 1992.
Shuttleworth, W. J., and J. S. Wallace,Evaporation from space crops ± an energy combination theory,Q. J. R. Meteorol. Soc.,
111,839±855, 1985.
Staley, D. O., and G. M. Jurica,Eective atmospheric emissivity under clear skies,J. Appl. Meteorol.,11,349±356, 1972.
Trou¯eau, D., J. P. Lhomme, B. Monteny, and A. Vidal,Sensible heat ¯ux and radiometric surface temperature over sparse Sahelian vegetation. I. An experimental analysis of the kB)1
parameter,J. Hydrol.,188±189,815±838, 1997.
Vachaud, G., A. Passerat de Silans, P. Balabanis, and M. Vauclin,
Temporal stability of spatially measured soil water probability density function,Soil Sci. Soc. Am. J.,49(4),822±828, 1985.
Van Genuchten, M. T.,A closed-form equation for predicting the hydraulic conductivity of unsaturated soils,Soil Sci. Soc. Am. J.,44,892±899, 1980.
Vauclin, M., and J.-L. Chopart,L'in®ltration multi-disques pour la deÂtermination in situ des caracteÂristiques hydrodynamics de la surface d'un sol gravillonaire de la CoÃte d'Ivoire,Agron. Trop.,
46,259±271, 1992.
Verhoef, A., H. A. R. de Bruin, and B. J. J. M. Van den Hurk,Some practical notes on the parameter kB)1 for sparse vegetation, J. Appl. Meteorol.,36(5),560±572, 1997.