Revista Brasileira de
Engenharia Agrícola e Ambiental
Campina Grande, PB, UAEA/UFCG – http://www.agriambi.com.br
v.19, n.1, p.3–8, 2015
Protocolo 368.13 – 18/11/2013 • Aprovado em 29/08/2014 • Publicado em 01/01/2015 1 UAG/UFRPE. Garanhuns, PE. E-mail: patricia.s.gondim@hotmail.com
2 UAG/UFRPE. Garanhuns, PE. E-mail: romualdo@uag.ufrpe.br (Autor correspondente) 3 DEN/UFPE. Recife, PE. E-mail: acda@ufpe.br
4 IRD - Land Development Department, Office of Science for Land Development, Montpellier, France. E-mail: claude.hammecker@ird.fr
5 UAG/UFRPE. Garanhuns, PE. E-mail: britaas@yahoo.com.br
6 UAG/UFRPE. Garanhuns, PE. E-mail: clarissalbuquerque@hotmail.com
Environmental control on water vapour and energy exchanges
over grasslands in semiarid region of Brazil
Patrícia S. de S. Gondim
1, José R. de S. Lima
2, Antonio C. D. Antonino
3,
Claude Hammecker
4, Renan A. B. da Silva
5& Clarissa A. Gomes
6 DOI: http://dx.doi.org/10.1590/1807-1929/agriambi.v19n1p3-8A B S T R A C T
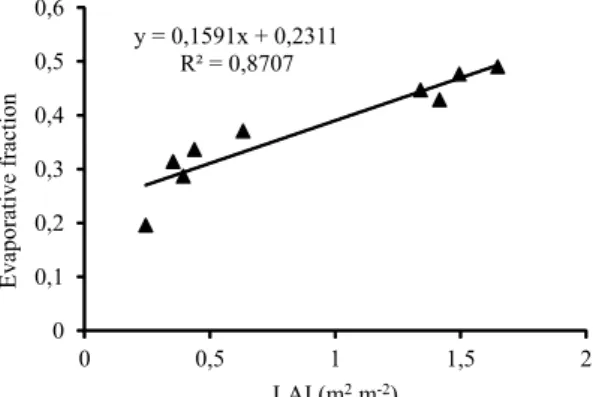
A micrometeorological experiment was conducted over grasslands in a semi-arid region of north-eastern Brazil (São João, Pernambuco) from January to December 2011, using the Bowen ratio energy balance method, to improve the current understanding of energy partitioning and water vapour exchange over this ecosystem in this region. The objectives of the present study were to quantify the seasonal and diurnal variations in energy and water vapour exchanges over grasslands and understand the biotic and abiotic factors controlling the energy partitioning of this ecosystem. In the dry period, the low stored soil water limited the grass production and leaf area index, and as a consequence of these conditions, most of the annual net radiation (58%) was consumed in sensible heat flux. During the course of the study the evaporative fraction was linearly related to the leaf area index. The total annual evapotranspiration and its daily maximum were 543.8 mm and 3.14 mm d-1. The seasonal
and diurnal variations in energy partitioning and evapotranspiration were controlled by soil water availability and leaf area index.
Controle ambiental das trocas de vapor d’água e de energia
em pastagens na região semiárida brasileira
R E S U M O
Conduziu-se um experimento micrometeorológico em pastagens na região semiárida nordestina (São João, Pernambuco) usando o método do balanço de energia – razão de Bowen, no período de janeiro a dezembro de 2011 com o intuito de compreender a partição da energia e das trocas de vapor d’água, neste ecossistema. O objetivo do trabalho foi: quantificar as variações sazonais e diárias nas trocas de água e de energia em pastagens e compreender os fatores bióticos e abióticos que controlam a partição de energia neste ecossistema. Observou-se, no período seco, que a pequena quantidade de água armazenada no solo limitou a produção da pastagem e o índice de área foliar e, em consequência dessas condições, a maior parte do saldo de radiação (58%) foi usada como fluxo de calor sensível. A fração evaporativa foi relacionada linearmente com o índice de área foliar. A evapotranspiração total e seu valor máximo diário, foram 543,8 mm e 3,14 mm d-1, respectivamente. As variações sazonais e diárias na partição da energia e na
evapotranspiração foram controladas sobremaneira pela disponibilidade de água no solo e pelo índice de área foliar.
Key words:
evapotranspiration soil water content leaf area index
Palavras-chave:
Introduction
Approximately 99% of the water used in agriculture is lost by crops as evapotranspiration (ET). Depending on the soil water conditions, a more or less important biological control is exerted on the water lost. ET is considered to be the main energy dissipation process, and it has an important role in regional hydrological cycles (Meirelles et al., 2011). ET can be influenced by meteorological parameters, including radiation, wind speed, temperature and vapour pressure deficit (VPD) of the air, and by biophysical factors of the soil-plant system, such as soil water availability, species composition, canopy structure, phenology and plant physiological attributes (Rosset et al., 1997).
The partitioning of available energy into ET (latent heat flux) and sensible heat flux at the vegetation surface also affects aspects of weather and climate (Wever et al., 2002). Moreover, the energy budget over land surfaces is the most important of all the ecological processes related to carbon sequestration in terrestrial ecosystems (Hao et al., 2007). There has been great interest, therefore, in studying ET in a variety of ecosystems to better understand the nature of the controlling interactions and the links between ET and other earth system processes (Wever et al., 2002).
To evaluate the long-term energy balance and ET in grasslands, a number of experimental studies have been conducted throughout the world (Li et al., 2006; Aires et al., 2008; Chen et al., 2009; Jamiyansharav et al., 2011; Jongen et al., 2011; Krishnan et al., 2012). In Brazil, it can be mentioned the studies of Randow et al. (2004) and Meirelles et al. (2011), who measured the latent and sensible heat fluxes in the pastures of Brachiaria. In contrast, there are few studies focused on
measuring the seasonal and/or diurnal variations of heat and water vapour exchanges in the grasslands of the semi-arid region of Brazil and none for the state of Pernambuco.
The main objectives of the present study are therefore to quantify the seasonal and diurnal variations in the energy and water vapour exchanges over the grasslands and to understand the biotic and abiotic factors controlling the energy partitioning and ET of this ecosystem.
Material and Methods
The study site was a cultivated 23 ha pasture of Brachiaria decumbens Stapf located at the “Riacho do Papagaio” Farm in
the county of São João in the state of Pernambuco (8° 52’ 30’’ S, 36° 22’ 00’’ W, altitude 705 m) in north-eastern Brazil. The study of the energy fluxes was conducted throughout the year in 2011, considering three sub-periods: the pre-wet season (January, February and March), the wet season (April, May, June, July and August) and the dry season (September, October, November and December).
The experimental area was originally formed by typical vegetation (savannah – “Caatinga”), which was removed in approximately 1950, when the production process was started in that location. During the first 30 years, annual cycle crops (corn, cotton and bean) prevailed, which were cultivated using a conventional system without crop rotation and fertilization. Later, in approximately 2000, this area began to be transformed
into pastures with Brachiaria decumbens. Cattle now graze off
this pasture land, with a stocking rate of 1 animal unit per ha. According to data from the Water and Climate Agency of Pernambuco (APAC, 2013), the total annual rainfall is 782.0 mm, and the wettest trimester consists of the months of May, June and July. The soil at the experimental site is classified as Neosoil Regolithic (Santos et al., 2012).
A micro-meteorological tower was established in the centre of the experimental field, and sensors were installed to record measurements of energy fluxes at the interface between the grassland/soil system and the atmosphere during the study period. The dry and wet bulb temperatures were measured using two integrated temperature-humidity probes (model HMP45C, Vaisala, Campbell Scientific Inc., Logan, UT, USA) at two heights above the crops. The wind speed (u) was monitored with cup anemometers (model 014A, Campbell Scientific Inc., Logan, UT, USA) at two levels. The measurements were made at 0.5 and 1.0 m above the top of the crop canopy. The height of the sensors increased as the grassland grew taller over the study period, such that the distance between the sensors and the crops did not change.
Net radiation (Rn) was measured with a net radiometer (model Q7 net radiometer, REBS, Seattle, WA, USA) installed 1.5 m above the vegetation surface. The solar global radiation (Rs) was measured with a pyranometer (model 200X, LI-COR Inc., Lincoln, NE, USA). The total rainfall was measured with a tipping bucket rain gauge (model TE 525WS-L, Texas Electronics, Dallas, TX, USA). The soil heat flux (G) was measured using two-soil heat flux plates (model HFT3, REBS, Seattle, WA, USA) inserted at 0.05 m below the soil surface. Two temperature sensors (model 108L, Campbell Scientific Inc., Logan, UT, USA) were also located at 0.02 and 0.08 m below the soil surface to calculate the surface ground heat flux (Lima et al., 2013). The measurements from all of the sensors were recorded by a data logger (model CR10X, Campbell Scientific Inc., Logan, UT, USA) every 60 s. The mean/sum data were logged every 1800 s.
The leaf area index (LAI) and above-ground biomass were determined nine times at approximately 1-month intervals from March to December 2011 in five 1 m2 plots. The
above-ground biomass was clipped close to the above-ground level using pruning shears. In the laboratory, the green plant parts were separated from the dead plant material, and the biomass was determined gravimetrically after the samples had been dried for 72 h at 65 °C in oven. The total above-ground dry biomass (DB) was thus calculated. The LAI was obtained from green leaves from the same sample used for biomass using an automatic leaf area meter (model LI-300, LI-COR Inc., Lincoln, NE, USA).
Soil moisture was measured at depths of 0.05, 0.10, 0.20 and 0.30 m using a water content reflectometer (model CS 615, Campbell Scientific Inc., Logan, UT, USA). Stored soil water was calculated for the 0-0.30 m soil layer.
The Bowen ratio energy balance (BREB) is a microme-teorological method used to estimate the latent heat flux and to calculate ET. The energy balance equation can be expressed as:
where:
Rn - net radiation, W m-2
LE - latent heat flux, W m-2
H - sensible heat flux, W m-2
G - soil heat flux. The difference between Rn and G is typically known as the available energy, W m-2
The available energy between the sensible (H) and latent (LE) heat fluxes is typically obtained by the BREB method (Lima et al., 2013):
H T
LE e
D β = = γ
D
where:
ΔT and Δe - differences between the two measurement levels of temperature and vapour pressure, respectively, and γ is the psychometric constant
In Eq. 2, the eddy diffusivities for heat and water vapour are assumed to be equal, and ΔT and Δe are assumed to be measured at the same height interval. The Bowen ratio (β) is calculated from the differences in air temperature and vapour pressure measured at two different heights above the crop canopy.
Using Eqs. 1 and 2, the latent and sensible heat fluxes can be calculated as:
(
Rn G)
LE 1
− =
+ β
LE is related to ET by:
(
)
H Rn G
1
β
= −
+ β
LE ET
L
=
where:
ET - actual evapotranspiration, mm d-1
L - heat of water vaporization, assumed to be a constant, 2,45 MJ kg-1
The daily ET was calculated by summing the values obtained every 1800 s for a 24-h period.
The partitioning of the available energy can be analysed by determining the dimensionless evaporative fraction (EF), defined as:
LE FE
Rn G
= −
The reference evapotranspiration (ETo) was determined by the Penman-Monteith model (Allen et al., 1998).
Results and Discussion
The variations in the major environmental conditions and plant parameters during the study period are shown in Figure 1.
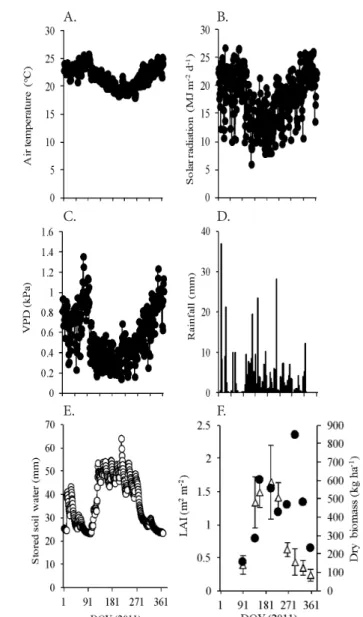
Figure 1. Daily values of (A) mean air temperature, (B) mean solar radiation, (C) mean air vapour deficit (VPD), (D) total daily rainfall, (E) stored soil water (SSW) of the 0–0.30 m soil layer and (F) mean green leaf area index (LAI) ± S.E. (D) and dry biomass (DB) ± S.E. (●) during the course of the study at São João, Brazil
A. B.
C. D.
E. F.
The air temperature (Figure 1A) ranged from 25.9 to 18.0 °C, and the annual mean air temperature was 21.9 °C. The air temperature reached its maximum values in late March and November-December and its minimum values in the period from June to August. The seasonal pattern of the daily-integrated shortwave radiation (Rs) (Figure 1B) was similar to that of the air temperature, with minimum values (6–10 MJ
m-2 d-1) in June, July and August, with cloudy winter days and
maximum values (22-27 MJ m-2 d-1) in the summer
(December-March). The annual mean value was 17.74 MJ m-2 d-1.
The vapour pressure deficit (VPD) also exhibited seasonal pattern (Figure 1C) with values ranging from 0.15 to 1.4 kPa. The behaviour of the VPD was associated with the air temperature, i.e., the periods with lower temperatures (wet
season) had the lowest values of VPD. The reverse occurred during the dry season.
The total precipitation (Figure 1D) during the measurement period was 523.7 mm, 33% below the normal precipitation (782.0 mm), with no precipitation for 190 days and a maximum
(2)
(3)
(4)
(5)
of 37.0 mm d-1 on January 10, 2011. From 336 to 365 DOY
(December 2011), no precipitation occurred. During the period from 04/11 to 09/27 (from 101 to 270 DOY), the rainfall was regularly distributed, with a total of 372.6 mm of rainfall, i.e., 71.15% of the total precipitation. A drastic reduction in the rainfall during the dry season (September to December, from 244 to 365 DOY) was observed. This reduction in precipitation has impacts on the stored soil water behaviour. The stored soil water (Figure 1E) ranged from 23.4 mm (from 95 to 98 DOY and from 357 to 365 DOY) to 64.1 mm (212 DOY) as the precipitation increased during this period. This type of soil, Neosoil Regolithic (Entisol), is characterised by high amounts of sand and thus low water retention (Santos et al., 2012).
All of these meteorological quantities undergo an obvious marked seasonal cycle. In the wet season (April through August), low temperature, low solar radiation and low VPD were coincident with high stored soil water and more frequent precipitation events. The reverse occurred during the dry season. This seasonal variation in the weather parameters was also reported by several authors (Aires et al., 2008; Chen et al., 2009; Jongen et al., 2011; Meirelles et al., 2011) when studying the exchanges of water and energy in pastures in various regions of the world.
The annual mean value of the LAI (Figure 1F) was 0.81 m2
m-2. The maximum values of LAI (1.65 m2 m-2) were achieved in
the rainy season (from 136 to 227 DOY), when the stored soil water was greater (Figure 1E), and these values then decreased in the dry season, reaching 0.24 m2 m-2 in December (355
DOY). Similar values of LAI were also found by Jamiyansharav et al. (2011) in the shortgrass steppe in the North American Great Plains.
The above-ground dry biomass (DB) also showed a seasonal pattern (Figure 1F), accompanying the changes in the LAI, rainfall and soil moisture. The highest values (> 600 kg ha-1)
were found in the rainy period, and the lower (160-470 kg ha-1)
in the dry season. Aires et al. (2008) and Jongen et al. (2011) also found a high seasonal variation in the dry biomass (65 to 8,000 kg ha-1) of pastures in the Mediterranean region of
Portugal due to the timing and quantity of precipitation. The daily mean diurnal variation courses of net radiation (Rn), soil heat flux (G), latent heat flux (LE) and sensible heat flux (H) during the observation period (365 days) are given in Figure 2. The seasonal pattern of Rn closely followed the variation of Rs (Fig. 1B), showing maximum values (10–18 MJ
m-2 d-1) in the spring and summer and minimum values (3-6
MJ m-2 d-1) in late autumn and early winter. The annual mean
of Rn was 10.55 MJ m-2 d-1. Aires et al. (2008) also found the
same behaviour when measuring Rn in a Mediterranean C3/ C4 grassland in southern Portugal.
The daily values of the soil heat flux (G) ranged from 0.07 to 1.14 MJ m-2 d-1 with an annual mean value of 0.61 MJ m-2 d-1.
Meirelles et al. (2011) measured the G in Brachiaria brizantha
and found values ranging from 0.71 to 2.47 MJ m-2 d-1.
The minimum daily values of LE (1-2 MJ m-2 d-1) were
recorded during the winter due essentially to the low atmospheric evaporative demand (Figures 1A-C) and during the summer due to the low stored soil water (Figure 1E) and low LAI (Figure 1F). In contrast, the maximum daily values of LE (4-6 MJ m-2 d-1) were recorded during periods of higher
Figure 2. Seasonal pattern of energy fluxes during the course of the study at São João, Pernambuco, Brazil: (A) net radiation (Rn), (B) soil heat flux (G), (C) latent heat flux (LE) and sensible heat flux (H)
0 2 4 6 8 10 12 14 16 18 20
Rn (MJ m
-2
d
-1)
A.
B.
C. 0,0 0,2 0,4 0,6 0,8 1,0 1,2
G (MJ m
-2
d
-1)
0 2 4 6 8 10 12 14
1 46 91 136 181 226 271 316 361
LE or H (MJ m
-2
d
-1)
DOY (2011) LE
H
LAI and stored soil water. Some of these maximum values of LE were also recorded in the months of January and February, when the LAI was low but the soil moisture was approximately
0.150 m3 m-3. These values of LE must be due more to soil
evaporation than pastures transpiration. The maximum daily values of sensible heat flux (H) (8-12 MJ m-2 d-1) occurred in
the summer and early autumn, when the LAI and soil moisture were low and the atmospheric demand was high. The reverse occurred during the wet season.
H and LE. Jongen et al. (2011) measured the energy fluxes in pastures in the Mediterranean region of Portugal and found that the variation of LE and H was associated with the soil
water content.
The seasonal and diurnal differences in the energy fluxes were largely imposed by the variability in the soil moisture and canopy growth. To better understand these differences, the year was divided into three main periods of growth (Table 1).
Figure 3. The ET and ETo were observed to exhibit a seasonal pattern, with the maximum values of ETo (4.0 to 5.8 mm d-1)
occurring in late spring and summer, most likely due to the higher air temperature, VPD (Figures 1A and 1C) and net radiation (Figure 2A) during these periods. However, in the late autumn and winter, due to the low atmospheric demand, the minimum values of ETo (1.0 to 3.0 mm d-1) occurred.
Table 1. Comparison of major meteorological and biometeorological variables in different periods during the
course of the study on Brachiaria decumbens at São João,
Pernambuco, Brazil Pre-wet
period
Wet period
Dry
period Year
Tair (oC) 23.52 20.81 22.02 21.89
Rs (MJ m-2d-1) 20.11 14.61 19.92 17.76
P (mm) 110.10 336.00 77.60 523.70 SWC (m3m-3) 0.096 0.154 0.104 0.123
VPD (kPa) 0.75 0.41 0.67 0.58
Rn (MJ m-2d-1) 12.41 8.48 11.80 10.57
G (MJ m-2d-1) 0.70 0.50 0.67 0.61
H (MJ m-2d-1) 7.59 4.39 7.73 6.30
LE (MJ m-2d-1) 4.13 3.58 3.40 3.66
G/Rn 0.06 0.06 0.06 0.06
H/Rn 0.61 0.51 0.65 0.58
LE/Rn 0.33 0.43 0.29 0.36
β 1.96 1.27 2.48 1.85
EF 0.36 0.46 0.31 0.38
ET, mm 1.69 1.46 1.39 1.49
ETo, mm 4.25 2.61 4.02 3.49
Pre-wet season: period between 1 January and 31 March; Wet season: period between 1 April and 31 August; Dry season: period between 1 September and 31 December. The daily means for each period: Tair, air temperature; Rs, solar radiation; SWC, stored soil water at a 0.30 m
layer; VPD, vapour pressure deficit; Rn, net radiation; G, soil heat flux; H, sensible heat flux; LE, latent heat flux; β, Bowen ratio; EF, evaporative fraction; ET, actual evapotranspiration; ETo, reference evapotranspiration. The totals for each period: P, precipitation
Both on an annual basis and in the three periods, only a minor part of the Rn was converted to G (G/Rn = 0.06). Similar annual G/Rn values were reported for steppe ecosystems in Mongolia (Chen et al., 2009).
The energy partitioning into the latent heat flux (LE) and sensible heat flux (H) was different between the periods. In the pre-wet and dry periods, a major fraction of the Rn was partitioned into H, with H/Rn being 0.61 and 0.65, respectively. In these same periods, LE had its lowest values, which were 0.33 and 0.29, respectively. The soil water deficit combined with the low LAI in these periods led to substantially higher H and lower LE values compared with those from the wet period.
The annual ratios of the latent (LE/Rn), sensible (H/Rn) and soil (G/Rn) heat fluxes to net radiation were 0.36, 0.58 and 0.06, respectively (Table 1). These results showed that the transpiration of the pasture was small because most of the net radiation was directed to the heating of the air (sensible heat flux) and not for the process of ET (latent heat flux). These results are in agreement with those of Krishnan et al. (2012), who measured the components of energy balance in two grasslands in the semi-arid region of Arizona during the years 2004-2007 and observed that the H was the largest consumer of Rn, with these values reaching 0.63 during the years of water scarcity.
The seasonal variations of the daily actual evapotranspiration (ET) and reference evapotranspiration (ETo) are shown in
0 1 2 3 4 5 6 7
1 46 91 136 181 226 271 316 361
ET
or ET
o (mm d
-1)
DOY (2011) ETo
ET total = 543.8 mm
total = 1,272.0 mm
Figure 3. Daily values of evapotranspiration (ET) and reference evapotranspiration (ETo) during the course of the study at São João, Pernambuco, Brazil
The maximum values of ET (2.0 to 3.14 mm d-1) occurred
in the late summer (late January and February) due to the high evaporative demand and soil moisture and in the winter due to the higher LAI and stored soil water. In contrast, the minimum values of ET (0.44 to 1.0 mm d-1) occurred in the late spring
and summer due to the low stored soil water and LAI. In the pre-wet, wet and dry periods, the mean values of ET were 1.69, 1.46 and 1.39 mm d-1, respectively, with an annual mean of 1.49
mm d-1. The values of ETo were 4.25, 2.61 and 4.02 mm d-1 in
the pre-wet, wet and dry periods, respectively, with an annual mean of 3.49 mm d-1. The total values were 543.8 mm for the
ET and 1,272.0 mm for the ETo (Table 1).
Meirelles et al. (2011) measured the ET in a field of 40 ha
planted with Brachiaria brizantha in the Cerrado region in
Goiás, Brazil using the eddy covariance method and found that the ET ranged from 1.55 to 4.25 mm d-1 with a mean value of
2.55 mm d-1. These authors also found that the maximum values
of ET occurred during the period of higher water availability. The relationship between the daily values of daytime evaporative fraction (EF) and the stored soil water (SSW) in the 0-0.30 m soil layer for the period from January to December 2011 showed a low correlation (R2 = 0.4014; EF = 0.0061 SSW
+ 0.1591). In general, the changes in the stored soil water just explained 40% of the variance found in the EF.
Conclusions
1. The seasonal and diurnal variation in energy partitioning was primarily controlled by the soil water availability and leaf area index.
2. The annual ratios of the latent (LE/Rn), sensible (H/Rn) and soil (G/Rn) heat fluxes to net radiation (Rn) were 0.36, 0.58 and 0.06, respectively.
3. The evapotranspiration of the grasslands exhibited a seasonal pattern with total and average values of 543.8 mm and 1.49 mm d-1, respectively.
4. The evaporative fraction was linearly related to the leaf area index.
Acknowledgments
The authors thank ‘‘Coordenação de Aperfeiçoamento de Pessoal de Nível Superior (CAPES)” for financial support through a M.Sc. grant. This study was mainly supported by “Conselho Nacional de Desenvolvimento Científico e Tecnológico (CNPq)” (Grants Nos: 475094/2009-3;
305727/2009-5; 307641/2013-9), by “Fundação de Amparo à Ciência e Tecnologia do Estado de Pernambuco (FACEPE)” (Grants Nos: APQ-0077-5.01/09, “Edital de Cooperação
FACEPE-FAPESP de Apoio a Pesquisas em Mudanças Climáticas” and APQ-1178-3.01/10, “Edital FACEPE
12/2010 - Programa de Apoio a Núcleos Emergentes”) and by “Financiadora de Estudos e Projetos (FINEP)” (Grant No:
551922/2011-7). We thank Prof. A. P. F. Montenegro for the assignment of the experimental field.
Literature Cited
Aires, L. M. I.; Pio, C. A.; Pereira, J. S. The effect of drought on energy and water vapour exchange above a Mediterranean C3/ C4 grassland in southern Portugal. Agricultural and Forest Meteorology, v.148, p.565-579, 2008. http://dx.doi.org/10.1016/j. agrformet.2007.11.001
Allen, R. G.; Pereira, L. S.; Raes, D.; Smith, M. Crop evapotranspiration: guidelines for computing crop water requirements. Rome: FAO, 1998. 300p. FAO Irrigation and drainage Paper 56.
APAC -Agência Pernambucana de Águas e Clima. http://www.apac. pe.gov.br >. 5 Jul. 2013.
Chen, S.; Chen, J.; Lin, G.; Zhang, W.; Miao, H.; Wei, L.; Huang, J.; Han, X. Energy balance and partition in Inner Mongolia steppe ecosystems with different land use types. Portugal. Agricultural and Forest Meteorology, v.149, p.1800-1809, 2009. http://dx.doi. org/10.1016/j.agrformet.2009.06.009
Hao, Y.; Wang, Y.; Huang, X.; Cui, X.; Zhou, X.; Wang, S.; Niu, H.; Jiang, G. Seasonal and interannual variation in water vapor and energy exchange over a typical steppe in Inner Mongolia, China. Agricultural and Forest Meteorology, v.146, p.57-69, 2007. http:// dx.doi.org/10.1016/j.agrformet.2007.05.005
Jamiyansharav, K.; Ojima, D.; Pielke, R. A.; Parton, W.; Morgan, J.; Beltrán-Przekurat, A.; Le Cain, D.; Smith, D. Seasonal and interannual variability in surface energy partitioning and vegetation cover with grazing at short grass steppe. Journal of Arid Environments, v.75, p.360-370, 2011. http://dx.doi.org/10.1016/j.jaridenv.2010.11.008 Jongen, M.; Pereira, J. S.; Aires, L. M. I.; Pio, C. A. The effects of
drought and timing of precipitation on the inter-annual variation in ecosystem-atmosphere exchange in a Mediterranean grassland. Agricultural and Forest Meteorology, v.151, p.595-606, 2011. http://dx.doi.org/10.1016/j.agrformet.2011.01.008
Krishnan, P.; Meyers, T. P.; Scott, R. L.; Kennedy, L.; Heuer, M. Energy exchange and evapotranspiration over two temperate semi-arid grasslands in North America. Agricultural and Forest Meteorology, v.153, p.31-44. 2012. http://dx.doi.org/10.1016/j. agrformet.2011.09.017
Li, S. G.; Eugster, W.; Asanuma, J.; Kotani, A.; Davaa, G.; Oyunbaatar, D.; Sugita, M. Energy partitioning and its biophysical controls above a grazing steppe in central Mongolia. Agricultural and Forest Meteorology, v.137, p.89-106. 2006. http://dx.doi.org/10.1016/j. agrformet.2006.03.010
Lima, J. R. S.; Antonino, A. C. D.; Souza, E. S.; Lira, C. A. B. O.; Silva, I. F. Seasonal and interannual variations of evapotranspiration, energy exchange, yield and water use efficiency of castor grown under rainfed conditions in northeastern Brazil. Industrial Crops and Products, v.50, p.203-211, 2013. http://dx.doi.org/10.1016/j.indcrop.2013.07.012 Meirelles, M. L.; Franco, A. C.; Farias, S. E. M.; Bracho, R.
Evapotranspiration and plant–atmospheric coupling in a
Brachiaria brizantha pasture in the Brazilian savannah region.
Grass and Forage Science, v.66, p.206-213, 2011. http://dx.doi. org/10.1111/j.1365-2494.2010.00777.x
Randow, C. von; Manzi, A. O.; Kruijt, B.; Oliveira, P. J.; Zanchi, F. B.; Silva, R. L.; Hodnett, M. G.; Gash, J. H. C.; Elbers, M. J.; Waterloo, M. J.; Cardoso, F. L.; Kabat, P. Comparative measurements and seasonal variations in energy and carbon exchange over forest and pasture in South West Amazonia. Theoretical and Applied Climatology, v.78, p.5-26, 2004. http://dx.doi.org/10.1007/s00704-004-0041-z Rosset, M.; Riedo, M.; Grub, A.; Geissmann, M.; Fuhrer, J. Seasonal
variation in radiation and energy balances of permanent pastures at different altitudes. Agricultural and Forest Meteorology, v.86, p.245-258, 1997. http://dx.doi.org/10.1016/S0168-1923(96)02423-9 Santos, J. C. B.; Souza Júnior, V. S.; Corrêa, M. M.; Ribeiro, M. R.;
Almeida, M. C.; Borges, L. E. P. Caracterização de Neossolos Regolíticos da região semiárida de Pernambuco. Revista Brasileira de Ciência do Solo, v.36, p.683-695, 2012. http://dx.doi.org/10.1590/ S0100-06832012000300001
Wever, L. A.; Flanagan, L. B.; Carlson, P. J. Seasonal and interannual variation in evapotranspiration, energy balance and surface conductance in a northern temperate grassland. Agricultural and Forest Meteorology, v.112, p.31-49, 2002. http://dx.doi.org/10.1016/ S0168-1923(02)00041-2
y = 0,1591x + 0,2311 R² = 0,8707
0 0,1 0,2 0,3 0,4 0,5 0,6
0 0,5 1 1,5 2
Evaporative fraction
LAI (m2m-2)