Airlines performance in the new market context: a comparative
productivity and efficiency analysis
Cristina Barbot∗
Faculty of Economics, University of Porto
Rua Dr. Roberto Frias, 4200-464 Porto, Portugal
Álvaro Costa and Elena Sochirca Faculty of Engineering, University of Porto
Rua Dr. Roberto Frias, 4200-465 Porto, Portugal
ABSTRACT
This paper analyses airlines’ efficiency and productivity using two different methodologies: data envelopment analysis and total factor productivity, and we additionally investigate which factors account for differences in efficiency. Our main findings show that low cost carriers are in general more efficient than full service carriers, efficiency and the dispersion of both data envelopment analysis and total factor productivity indexes amongst airlines differ according to geographical areas, which may be a result of different legislation and de-regulation processes, and so of specific competitive conditions, labour is the only input that definitively influences productivity, and larger airlines are more efficient, suggesting the existence of economies of scale.
1. Introduction
The air transport market has undergone considerable change. De-regulation in Europe, North America and Australia, have led to a significantly increased competition, and along with de-regulation, many European airlines that were formerly state-owned have been either fully or partial privatisation. Also, adjustments following the events of September 11th have effected the environment in which air services are provided. Finally, the large-scale market entry of low cost carriers (LCCs) has increased competition and affected the fares charged by incumbent airlines. As a consequent of these and other developments, it is probable that the relative efficiency of the world’s airlines have changed.
This paper performs analysis on the comparative efficiency of airlines in this new market context looking at a large sample of airlines and using two different methods of measuring performance efficiency. The sample is of 49 carriers in 2005. Additionally possible factors that may account for higher productivity are examined. Data envelopment analysis (DEA) and total factor productivity (TFP) methods are used for
analysis. Further, we use regression analysis to find out which factors account for productivity differences.
Previous DEA efficiency studies of airlines are numerous. Some of the more recent include Sheraga (2004) who using data for 38 airlines from around the world for 1995 and 2000 found that relative efficiency had changed little. Fethi et al. (2001) looked at 17 European carriers for 1991 and 1995 and found that by 1995 it was too soon find any improved efficiency. Oum and Yu (1995) analyzed 23 airlines over the period from 1986 to 1993 and found that that most improved their TFP with European airlines, in particular, having had low indexes in 1986. Fare et al. (2007) studied the effects of deregulation on the productivity of 13 US airlines. Except for Sheraga, other studies use data prior 1995 before LCCs were important and too soon in most cases to examine the medium term effects of de-regulation and liberalisation. Our analysis captures the effects of the new market environment introduced by these new conditions.
2. The airlines
Forty-nine airlines from different parts of the world are grouped by the International Air Transport Association’s (IATA) regional classification are - Europe and Russia (21 airlines), North America and Canada (11), China and North Asia (8), Asia Pacific (7), Africa and Middle East (2). The aim was to include each region’s largest airlines as well as a representative sample of LCCs. Of the airlines, 10 are European, North American, and Asia Pacific LCCs. Data for 2005 are used and sources include airlines’ annual reports, direct information from airlines, the International Air Transport Association’s (various years) yearly publication (World Air Transport Statistics) and the Association of European Airlines (2007), Yearbook 2006.
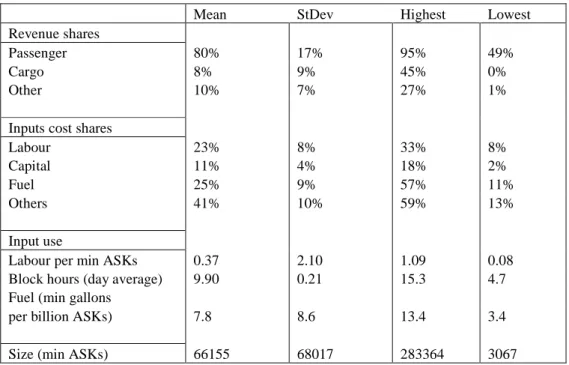
Tables 1 and 2 summarize some of the main features of the airlines. Passenger revenues range from 49% for Eva Airways to 98% for Norwegian Airlines. As most LCCs do not carry cargo, they have the highest shares of passenger revenues. Other revenues come mainly from selling maintenance and engineering services, catering, leasing of own aircraft, sale of fuel and sale of goods but these are a small share, and only account for 27% for Japan Airlines, the carrier with the largest share. The airlines vary considerably in size, with an average doing 66,155 million available seat kilometres (ASKs) - largest the largest American Airlines doing 283,364 million with smallest, Cyprus Airways, doing 3,067 milion.
Table 1 Input and Output Mix
Mean StDev Highest Lowest
Revenue shares
Passenger 80% 17% 95% 49%
Cargo 8% 9% 45% 0%
Other 10% 7% 27% 1%
Inputs cost shares
Labour 23% 8% 33% 8% Capital 11% 4% 18% 2% Fuel 25% 9% 57% 11% Others 41% 10% 59% 13% Input use
Labour per min ASKs 0.37 2.10 1.09 0.08
Block hours (day average) 9.90 0.21 15.3 4.7
Fuel (min gallons
per billion ASKs) 7.8 8.6 13.4 3.4
Size (min ASKs) 66155 68017 283364 3067
Table 2 Percent of Inputs and Outputs by Airline Type Shares of output
revenues Passenger Cargo Other Salaries Capital Fuel Other
Full service airlines
Average 78.1 10.3 10.9 22.2 11.3 25.3 41.5
Standard Deviation 10.6 8.5 7.2 7.8 4.0 8.4 8.5
Low cost airlines
Average 93.5 0.2 6.3 23.2 11.0 27.2 38.6
The input and output mix used in DEA is generally uniform for the airlines examined, the only major difference being lack of cargo carriage amongst the LCCs The share of “other inputs” in operating costs is relatively high across the board, with a mean of 41% and a highest value of 59%, for Malev. “Other inputs” differ amongst airlines and their shares in operating revenues depends much on the company’s decision between outsourcing and internalising the production of some of these services. Labour costs shares range from 8% for Eva Airways to 33% for SAS. This reflects greater international differences amongst salaries than effective labour use. As an example, Asian airlines have lower shares of salaries in costs but higher levels of employment per ASK. For example, PIA’s ratio of employees per million ASKs is of 0.93, while Ryanair ratio is of 0.08. Block hours range from a maximum of 15.3 for American Airlines to a low of 4.7 for SAS.
4. Efficiency and productivity analysis
4.1. Data Envelopment Analysis
The DEA performance analysis was performed according to the input-oriented Banker-Charnes-Cooper model (Banker, 1984), using variable returns to scale, with each airline considered as a separate decision making unit (DMU). The model is:
∑
∑
= = + −+ − + − m i s r r i s si r s s 1 1 , , ( ( )) min θ ε θ (1) m i x s x i i n j j j i 0 1, , 1 … = = + − =∑
λ θ s r y s y r r n j j j r 0 1, , 1 … = = − + =∑
λ n j n j j 1 1, , 1 … = =∑
= λ 0 0 = λ r j i s sr i j ≥0, ≥0, ≥0 ∀, , − + λ where:xij is the ith input of DMU j; yrj is the rth input of DMU j;
Θ is the efficiency score of the considered DMU;
λj j=1
n
∑
=1 is the convexity constraint in the Banker-Charnes-Cooper model: si−
is an input slack parameter; sr
+
is an output slack parameter;
λ0=0 and is a constraint for applying the super-efficiency measure.
To distinguish between airlines’ efficiency and effectiveness, as well as different efficiency frontiers, several DEA sub-analyses have been performed using slightly differentiated data sets, i.e. for efficiency, effectiveness and for three airlines groups: all carriers, FSCs, and LCCs
The DEA data set includes as inputs - labour (number of core business workers), fleet (number of operated aircraft) and fuel (in gallons consumed) and as outputs - ASKs, revenue passenger kilometres (RPKs) and revenue tonne kilometres (RTKs).
The DEA results are presented in Table 3. Overall we see that LCCs perform better than full service airlines. The two exceptions are Air Tran and West Jet; both have very low efficiency and effectiveness scores. Their weaker performance could be due to not being able to get the most of their inputs, or by the influence of factors not considered here. Among the full service companies the lowest performance scores are for Aeroflot. In general, it is not possible to draw a simple conclusion as to any correspondence between efficiency and effectiveness patterns. However, a number of airlines display best performance results (values of unity) in both efficiency and effectiveness cases (about 45% of these are LCCs). Geographic area of operations also seems to account for certain parallels. The majority of European and American carriers have higher effectiveness than Asia Pacific and China/North Asia airlines that generally appear more efficient than effective. Similarly, the difference in performance between LCCs and FSCs is greater for European operators than for American ones. LCCs do not appear sensitive to either of these effects, but are highly efficient across the board with no significant variations in their efficiency or effectiveness scores.
Table 3 DEA Results on Operational Efficiency and Effectiveness
Classification Unit name Efficiency Effectiveness
F U L L S E R V IC E C A R R IE R S EUROPE & RUSSIA Iberia 0.7391 0.7254 Alitalia 0.5773 0.5272 KLM 0.5011 0.5494 SAS 0.3423 0.4752 Austrian 0.4979 0.6094 British Airways 0.8387 1.0000 Lufthansa 0.6449 0.7529 AirFrance 0.5821 0.7281 Turkish Airlines 0.6922 0.7424 TAP 0.8120 0.7471 Cyprus Airways 1.0000 1.0027 Aeroflot 0.3348 0.3921 Malev 0.5566 0.5510 Finnair 0.6709 0.9412 CSA 0.4186 0.4246 Iceland Air 0.8897 0.8657 LOT 0.4713 0.4593 US & CANADA Delta 1.0000 1.0000 Northwest 0.6088 0.8410 American Airlines 1.0000 1.0000 United Airlines 0.95670 1.0000 Midwest Airlines 0.5446 0.5097 Air Canada 1.0000 1.0000
Continental 0.5970 0.7497
CHINA & NORTH ASIA
China Southern Airlines 0.6744 0.6710 All Nippon Aiways 0.8471 0.7193 Japan Airlines 1.0000 1.0000 Korean Air 0.7235 0.6615 Malaysian Airlines 0.6828 0.6330 Singapore Airlines 1.0000 1.0000 PIA 0.7483 0.6900 Cathay Pacific 1.0000 1.0000 ASIA PACIFIC Eva Airways 0.9083 1.0000 Thai Airways 0.9993 0.9346 Jet Airways 0.4827 0.4543 Qantas 0.8685 0.9948 Air New Zealand 0.7931 0.8430
MIDDLE EAST & AFRICA Emirates 1.0000 1.0000 Kenya Airways 0.7738 0.7593 L O W C O S T C A R R IE R S EUROPE & RUSSIA Easyjet 0.9030 0.9438 Norwegian 1.0000 1.0000 Ryanair 1.0000 1.0000 Virgin Express 1.0000 1.0000 ASIA PACIFIC Virgin Blue 0.8587 0.8440 Air Asia 0.8817 0.8600 US & CANADA Southwest 0.9403 0.9109 AirTran 0.3286 0.3087 JetBlue 1.0000 1.0000 West Jet 0.5750 0.5634 Mean 0.7605 0.7837 Standard deviation 0.2124 0.2081
4.2 Total Factor Productivity Analysis
We use three outputs and four inputs to look at TFP. Outputs are passenger service (measured in RPKs), cargo service (measured in RTKs) and ancillary output. This last measure includes items related to operations other than passengers and cargo and they were computed following Oum and Yu (1996). Hence, revenues are residuals of passengers and cargo services and quantities are calculated dividing residual revenues by the purchasing power parity (PPP) index obtained from Penn World Table. PPP was converted in euros and normalised to Germany’s PPP.
As inputs we used labour (the number of employees), capital (the airline’s fleet), fuel, (gallons), and “other operating inputs”. Other operating inputs are computed by dividing residual operating costs (salaries and benefits, capital cost, measured by aircraft depreciation and aircraft leasing costs, and fuel cost) by the same PPP index used for outputs. This was done because “other operating inputs” represent a mix of goods and services that are similar to residual outputs, and differ from the ones adopted by Oum and Yu which are based on land and property.
Output and input were aggregated into a single measure following Caves et al.’s (1982) methodology. TFP was normalised to Air Canada, which was selected as the base company because it has a unitary score in the DEA analysis thus offering a reasonable basis of comparison of the TFP and DEA results. Output, input and TFP indexes are presented in Table 4. Results should be read taking into consideration Oum and Yu’s observation regarding TFP’s limitations. With the exception of Air Tran, low cost airlines
exhibit higher productivity as anticipated. In fact, and as stated by Hansson et al. (2003) being “low cost” means adopting a business model focused on simple, streamlined processes and products. Simplicity and business speed rely on minimal inputs that enable high productivity levels.
Regional differences among companies’ productivity levels might be expected. Legislation and de-regulation processes are specific to each region giving potentially different level of competitive pressure on carriers with resultant implications for productivity and X-efficiency. The North American group of airlines exhibits greater homogeneity in TFP scores, with a standard deviation of 22.5, probably reflecting more intensive competitive conditions and similar legal frameworks. European carriers reveal a high standard deviation (43.5) and confirming Scheraga’s (2004) findings of large dispersion in efficiency amongst European airlines. The dispersion is also large (45.2) in China and North Asia. The Asia Pacific group is also heterogeneous (49.4), with efficient companies, like Cathay Pacific and Qantas competing with poorly performing airlines, like Pakistan International Airlines and Jet Airways. India and Pakistan companies register very low levels of productivity and the same is true of small and medium sized European airlines, such as SAS, CSA, Aeroflot and Malev. The group of China and North Asia exhibits the highest average TFP score (148), considerably above the other groups.
Airlines Output Input TFP
Index index Index
Ryanair 0.51 0.20 253 Air Asia 0.08 0.04 210 Eva Airways 0.65 0.35 186 Japan Airlines 2.72 1.49 182 Korean Air 1.24 0.75 164 Cathay Pacific 1.19 0.75 160 JetBlue 0.30 0.20 151 Virgin Blue 0.24 0.16 150 Virgin Express 0.04 0.03 141 Emirates 0.99 0.71 139 Easyjet 0.43 0.31 139 Qantas 1.70 1.26 135 Southwest 1.27 0.96 133 Continental 2.12 1.61 131
All Nippon Aiways 1.35 1.05 128
West Jet 0.23 0.19 125 British Airways 2.06 1.67 123 Norwegian 0.04 0.03 123 American Airlines 3.41 2.80 122 Northwest 1.98 1.70 117 Lufthansa 3.33 2.86 116 United Airlines 2.88 2.51 115 Iberia 0.89 0.78 115 KLM 1.21 1.09 112
Air New Zealand 0.32 0.29 110
Cyprus Airways 0.05 0.04 108 Singapore Airlines 1.52 1.41 108 Delta 2.59 2.47 105 Thai Airways 0.96 0.92 104 Air Canada 1.00 1.00 100 AF 2.05 2.12 97 Finnair 0.27 0.28 96 Alitalia 0.72 0.77 93 Malaysian Airlines 0.70 0.77 91 Midwest Arlines 0.08 0.08 90 Turkish Airlines 0.37 0.42 90 Austrian 0.35 0.41 86 Kenya Airways 0.09 0.11 84 TAP 0.24 0.29 84
China Southern Airlines 1.09 1.39 78
SAS 0.76 1.00 76 Malev 0.10 0.14 72 Air Tran 0.17 0.25 69 Aeroflot 0.38 0.63 61 PIA 0.24 0.46 51 JetAirways 0.17 0.36 47 CSA 0.09 0.21 44
When comparing DEA and TFP results, due to a higher degree of data correspondence between effectiveness measurements, the analysis focuses on this measure. Our results indicate that the performance dynamics of the methodologies are very similar. Where there are disparities, variations may be due to dissimilarities in the inputs/outputs used. In particular, the TFP measure uses one more input and one more output than the DEA. In the case when the input or output not omitted in DEA has a large weight in one airline’s costs or revenues, the two methodologies may yield different results. Despite these problems the both DEA and TFP analysis are consistent in showing that LCCs are in the vast majority of cases more efficient than traditional carriers.
4.3 Regression Analysis
To investigate which inputs explain better productivity differences, TFP scores are regressed against indexes reflecting the use of labour, fleet and fuel – namely EMP (employees per million ASK), H (block hours per day) and F (fuel consumption per million ASKs). Variable SZ (airlines’ size, in billions ASKs) was included to check for the existence of economies of scale. As the analysis of TFP’s results clearly shows that low cost airlines have higher productivity scores a dummy variable was added taking the unitary value for LCCs and zero otherwise.. Two specifications are examined; one with all independent variables and the second without non-significant variables.
The first equation is:
TFP = b0 + b1H + b2EMP + b3LCC + b4F + b5SZ (2)
It is expected that H will have a positive sign - the more the fleet is used, the higher the productivity of capital, and of the airline. EMP should have a negative sign, as a higher use of labour per ASK would lower productivity. Fuel consumption per ASK should not differ much across airlines, depending mainly on the types of aircrafts used, and so it is expected that this variable is not significant. A positive and significant coefficient of SZ indicates the existence of economies of scale. The LCC dummy variable is anticipated to have a positive sign.
Table 5 summarises the results of the regression analysis. Of the three inputs, only EMP is significant. Employment per ASK has the expected sign and its coefficient shows that a reduction of 112 employees per million ASKs leads to a one point increase in an airline’s TFP index. It was expected that higher aircraft use should contribute to higher productivity indexes but this does not materialize. The LCC dummy is significant and has the expected positive sign and there is some weak indication of the existence of economies of scale. In the modified specification without the insignificant variables there is little change much. The adjusted R2 remains near 0.6, and F-statistic is high, but the LCC dummy increases in significance as does SZ.
As the influence of the variable LCC is strong, other variables’ influence may be dampened within the full data set. Therefore, the second regression was performed using only observations for traditional carriers:
TFP = b0 + b1H + b2EMP + b3F + b4SZ (3)
Using all variables, the results, however, do not change much. All input variables keep similar levels of significance, and the value of the adjusted R2 and F do not change. Size becomes less significant in this second equation, implying that LCCs also account for some of the overall scale effects. This confirms that there are concentrations in the LCC segment of the industry (Alamdari and Mason, 2006); economies of scale making it easier for such concentration to occur. To gain some insights into the factors leading to these economies of scale, SZ was regressed with all other variables reflecting inputs’ use: H, EMP and F. Only EMP proved to be significant at any reasonable level suggesting that scale economies are caused mainly by relative savings in labour as airlines expand their operations. An effect reported by Association of European Airlines (2004) from 2000 to 2003.
Table 5 Regression Analysis Results
Table - Results of Regressions
Dependent Variable N H EMP LCC F SZ
First equation
TFP 47 149.8 ** -0.23 -112.2 *** 38.9 ** -1338.6 0.103 *
0.00 0.90 0.00 0.02 0.27 0.10
TFP 47 139.5 *** -113.60 *** 40.6 *** 1.68 ***
0.00 0.00 0.01 0.01
Second equation N H EMP F SZ
TFP 37 139.1 *** 0.5 -115.9 *** -482.4 0.11 * 0.00 0.79 0.00 0.74 0.10 TFP 37 141.9 *** -118.4 *** 0.11 * 0.00 0.00 0.07 * Significant at 10% ** Significant at 5% ***Significant at 1%
Constant Independent Variables
Constant
5. Conclusions
Our results from examining a large sample of airlines using two alternative methodologies: DEA and TFP show that LCCs are, in general, more efficient than FSCs because of the business model they follow, and not because of their size and input mix. Further, DEA analysis suggests that efficiency and effectiveness are not always correlated; while some airlines display close values of both efficiency and effectiveness, this is not always the case. TFP analysis shows that in airlines from regions that have
more homogeneous regulatory structures, like North America, are more uniform in their productivity. The general results are robust regardless of whether programming or statistical analysis was applied.
References:
Alamdari, F., Mason, K., 2006. EU network carriers, low cost carriers and consumer behaviour: a delphi study of future trends. 10th Air Transport Research Society Conference, Nagoya.
Association of European Airlines (2004) Yearbook 2003. AEA, Brussels. Association of European Airlines (2007) Yearbook 2006, AEA, Brussels.
Banker, R., Charnes, A., Cooper, W., 1984. Some models for estimating technical and scale inefficiencies in data envelopment analysis. Management Science, 30, 1078-1092.
Caves, D., Christense, L. Diewert, E., 1982. Multilateral comparisons of output, input, and productivity using superlative index numbers. Economic Journal, 92, 73-86. Färe, R., S. Grosskopf, R. Sickles. (2007) Productivity of U.S. Airlines After
Deregulation, Journal of Transport Economics and Policy 41, 93-112
Fethi, M., Jackson, P., Weyman-Jones, T., 2001. European Airlines: a stochastic DEA study of efficiency with market liberalization. Paper presented at the 7th European Workshop on Efficiency and Productivity Analysis, University of Oviedo.
International Air Transport Association (various years) World Air Transport Statistics, IATA, Geneva.
Oum, T., Yu, C., 1995. A productivity comparison of the world’s major airlines, Journal of Air Transport Management 2, 181-195.
Scheraga, C., 2004. Operational Efficiency vs. financial mobility in the global airline industry: a data envelopment analysis and Tobit analysis. Transportation Research A, 38, 383-404