M
ASTER OF SCIENCE IN
FINANCE
M
ASTERS
F
INAL
W
ORK
DISSERTATION
A
STUDY
ON
THE
DETERMINANTS
OF
TAX
REVENUES
IN
AFRICA
OLUWATOSIN ROLAND ARIWAYO
M
ASTER OF SCIENCE IN
FINANCE
M
ASTERS
F
INAL
W
ORK
DISSERTATION
A
STUDY
ON
THE
DETERMINANTS
OF
TAX
REVENUES
IN
AFRICA
OLUWATOSIN ROLAND ARIWAYO
S
UPERVISOR
:
P
ROFESSOR
D
OUTOR
J
OAQUIM
J
OSÉ
M
IRANDA
S
ARMENTO
Abstract
Tax revenues efforts in Africa over the years is still well below a threshold that is sustainable for capital and human developments. Existing literatures on the subject of the determinants of tax revenue in Africa had used time series data for specific countries and panel data for group of countries. Most empirical studies focused mainly on Sub Saharan Africa, excluding North Africa from the sample of countries used, also very little attention had been given specifically to the determinants of corporate tax revenue which is a major constituent of total tax revenue in this region.
In this dissertation we hope to contribute to the set of studies on the determinants of tax revenues in Africa. To achieve our objective, we obtained yearly unbalanced panel data from 1997 to 2016. We excluded countries and years with missing observations for the dependent variables. Considering the fact that the diagnostic test for the residual of the regression shows violations of some basic assumption of the OLS. Hence the need for a robust OLS standard error approach. We used the Driscoll and Kraay(1998) standard error for the coefficient estimated by the pooled OLS, fixed(within) regression. The results indicates that total tax revenue (as a percentage of GDP), is positively correlated with our determinant variables which are, public spending, industry share, control of corruption and government effectiveness, whereas the log of GDPpercapita, inflation and agriculture share indicates a negative correlation. Regarding corporate tax revenue (as a percentage of GDP), we find evidence of been positively correlated to inflation and trade openness , while public debt indicate a negative correlation.
JEL: H21; H25; C23
Resumo
O esforço da receita fiscal em África nos últimos anos continua abaixo do nível considerado sustentável para o desenvolvimento humano e do capital. A literatura sugere a utilização de séries temporais para países específicos e dados em painel para um conjunto de países, no estudo dos determinantes da receita fiscal em África. A maior parte dos estudos empíricos foca-se principalmente na região da África subsariana, excluindo da amostra os países da região do norte de África. É, também, dada pouca atenção aos determinantes da receita fiscal das empresas que é a maior fonte de receita do total de receitas fiscal nesta região.
Nessa dissertação esperamos contribuir para a literatura nos estudos dos determinantes da receita de fiscal em África. Para alcançar o nosso objetivo, consideramos uma base de dados não balanceada, com dados em painel, desde 1997 a 2016. Excluímos da amostra países e anos com valores não observados para a variável dependente. Consideramos o facto de o teste diagnóstico para os resíduos da regressão mostrar violação de alguns pressupostos do OLS. Por isso a necessidade da utilização de um OLS robusto. Utilizamos o erro padrão de Driscoll e Kraay(1998) para os coeficientes estimados a partir do pooled OLS, fixed(Within) regression. Os resultados indicam que a receita fiscal total (como percentagem do PIB) está positivamente correlacionada com os nossos determinantes,public expenditure, industry share, control of corruption e government effectiveness, enquanto que o log do GDPpercapita, inflation e agriculture share indica uma correlação negativa. Relativamente a receita fiscal das empresas (como percentagem do PIB), verificamos evidencia de correlação positiva com inflation e trade openness, enquanto que public debt apresenta uma correlação negativa.
Classificação JEL: H21; H25; C23
Acknowledgement
I will like to appreciate some persons whose invaluable insights, supports and encouragement had immensely contributed to the success of this dissertation. God be praised, whose mercies, grace and favour had kept me.
I would like to thank my supervisor, Professor Joaquim Sarmento, I am greatly indebted to him, for his help and guidance throughout each stage of this work. He is an exceptional academic, whose worth his salt . I am grateful for his invaluable insights and for all have learnt during this process.
I also like to appreciate, Professor Victor Barros for his apt and insightful contributions. t from my family and friends. Million thanks and love re best. I do appreciate some of my friends who were very supportive in the course of my studies: Patricia Spencer, Filipe Marçal, João Silva, Pedro Gomes, Príncipe Zanguilo and many more whose names were not listed. Love you all!
ble to undertake this MSc. Degree without the financial support and encouragements of my uncle and his family, Mr & Mrs Anfani Omosele.
List of Abreviations
ARA- Autonomous Revenue Authority BEPS- Base Erosion Profit Shifting DRM- Domestic Revenue Mobilization FDI- Foreign Direct Investment
FM- International Monetary Fund Fiscal Monitor GDP- Gross Domestic Product
IFS- International Financial Statistics. LAC- Latin American and the Carribeans
MENA- Middle East and North Africa ODA- Official Development Assistance
OECD- Organisation for Economic Co-operation and Development OLS- Ordinary Least Square
SSA- Sub- Saharan Africa
UNCTAD-United Nations Conference on Trade and Development VAT- Value Added Tax
WAEMU- West African Economic and Monetary Union WDI-
List of Figures
Figure 1: Evolution of Financial flows Sub-Saharan Africa, 1996-Figure 2: The tax revenue mix in Africa,
2005-rich countries,2005-2015 rich countries, 2005-Figure 5: Residual Normality with Outliers(Total tax r
Figure 6: Kernel density estimate(Tota
Figure 7: Standardized Normal Probability(Total taxreve
..34
Figure 9: Kernel density estimate(Corpor Figure 10: Standardized Normal Probability(C Figure 11: Total tax revenue%GDP versus Agric%GDP...35
Figure 12: Total tax re ...35
Figure 13: Total tax revenue%GDP versus Public spending%GDP...35
Figure 14: Total tax revenue%GDP versus Govt. effectiveness...35
Figure 15: Total tax revenue%GDP versus Industry share%GDP . 35 Figure 16: Total tax revenue%GDP versus Figure 17: Total tax revenue%GDP ve 36 Figure 18: Total tax revenue%GDP v .36 Figure 19: Total tax revenue%GDP Figure 20: Corporate tax revenue%GDP versu Industry share%GDP ... Figure 21: Corporate tax revenue%GDP versus Public Figure 22: Corporate tax revenue%GDP versus Inflation 36
List of Tables
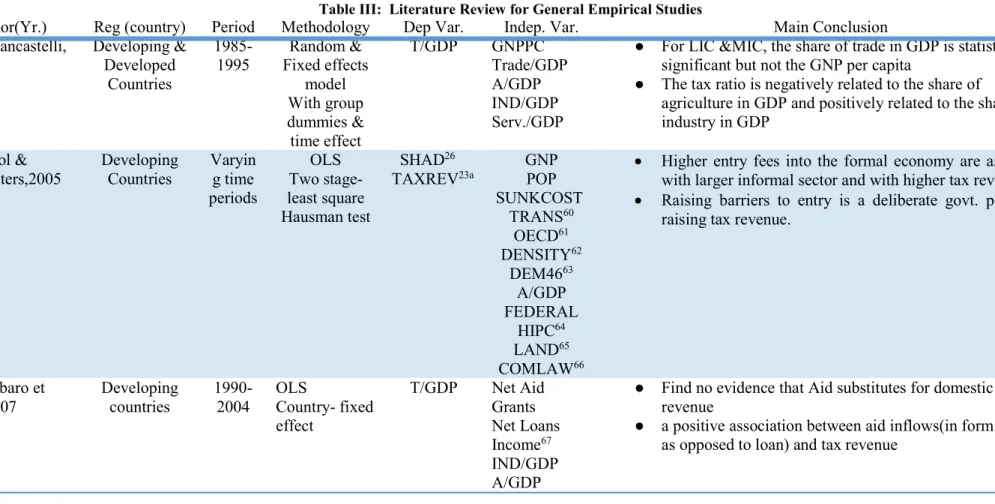
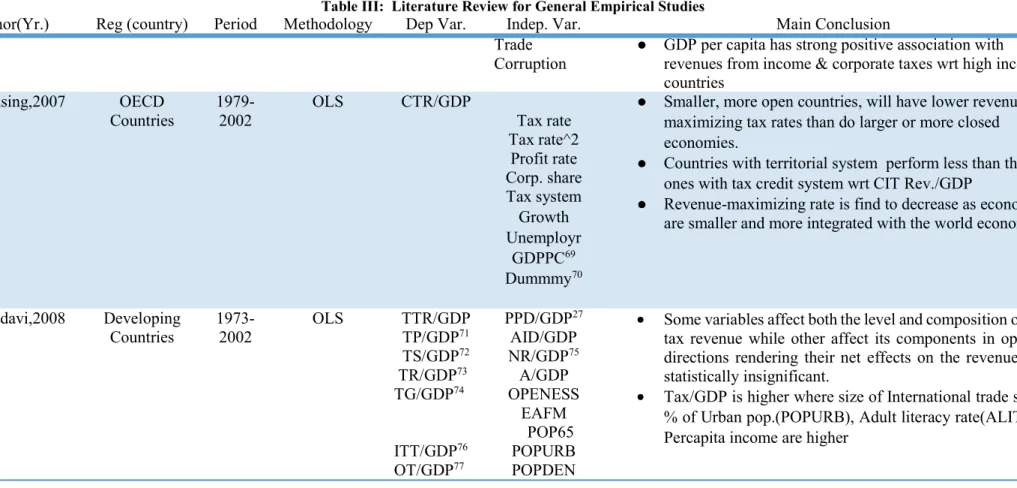
Table I: Literature Review for Empirical studies on .37 Table II: Literature Review for Theoret 41 Table III: Literature Review for General ....42
Table IV: ....46
Table V: Literature Review Summary of Independent va .. .47 Table VI: Details on Explanatory ..51 Table VII: ... 52 Table VIII: . ... ...53 Table IX: List of African cou .. Table X: Regression models results for ... 54 Table XI: Regression models results for .. ....55
Table of Contents Abstract ... i Resumo ... ii Acknowledgement ... iii List of Abreviations ... iv List of Figures ... v List of Tables ... vi 1 Introduction ... 1 2 Literature Review ... 4 2.1 Main Concept ... 4
2.2 Determinants of Tax Revenues ... 7
2.3 Determinants of Corporate Tax Revenues ... 12
2.4 Studies on Africa ... 15
3 Methodology, data and Variables ... 16
3.1 Research questions and Objectives ... 16
3.2 Data & Descriptive statistics of variable ... 17
3.3 Dependent variables ... 17
3.4 Diagnostic test on dependent variables ... 18
3.5 Independent variables ... 18
3.6 Test on Independent variables ... 20
3.7 The Econometric Model ... 21
4 Results ... 23
4.1 Descriptive on Tax revenues ... 23
4.2 Results on Tax Revenues ... 24
4.3 Results on Corporate Tax Revenues ... 25
5 Conclusion, Limits and Future work ... 26
References... 28
1 Introduction
Despite the increase pressure of education, social and infrastructural expenditures, African countries over the last years have not been able to maintain fiscal discipline, making fiscal imbalance a norm in this continent. The main causes of fiscal imbalance are poor design of income taxation, weak revenue mobilization and fast expansion in expenditure and declining or low revenue level (Lewis, 1984; Drummond et al, 2012; Nashashibi & Bazzoni, 1994). Having being faced with persistent revenue shortages, several Sub-Saharan African countries had adopted in the last thirty years measures to improve their ability to raise taxes (Ahlerup et. al, 2015).
The need for African governments to engage in aggressive tax revenues mobilization cannot be overemphasized based on the declining relative importance of foreign aids1 on the basis that this source has largely dried due to the recession in the
industrialized nations (Cnossen, 2015; Mubiru, 2010).
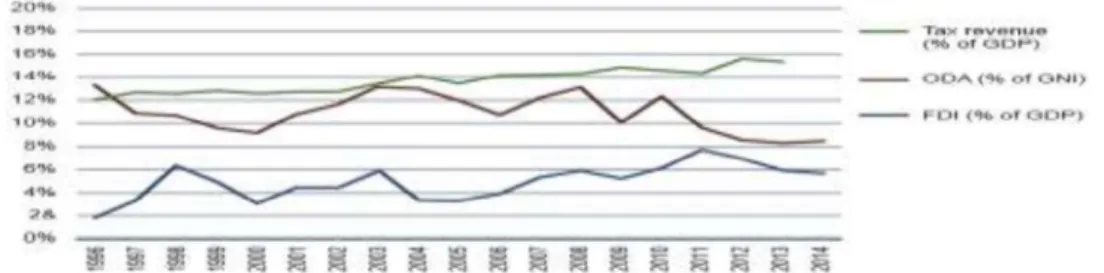
Tax revenues largely surpass the inflows of foreign capital (Fig. 1) such as official development assistance (ODA) and foreign direct investments (FDI) (Sy & Sow, 2016). Gupta (2007) finds that foreign aids improves revenue performance significantly while debt does not. In the same vein, Bhushan & Samy(2012) find that foreign aids has no significant impact on taxation in Sub Saharan Africa. In addition, Ebeke & Ehrhart (2010) find that foreign aid acts as a buffer mechanism to counter the detrimental impact of the instability of tax revenues on the public capital spending. However, foreign aids received from the respective donors includes details on spending plan or the required projects to be executed with the funds, thereby could constitute a constraint for government spending on immediate priorities.
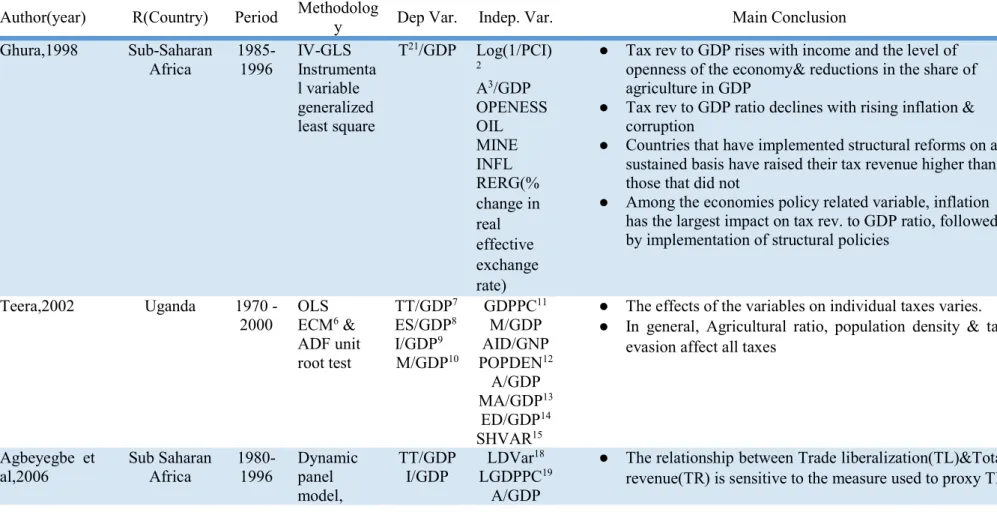
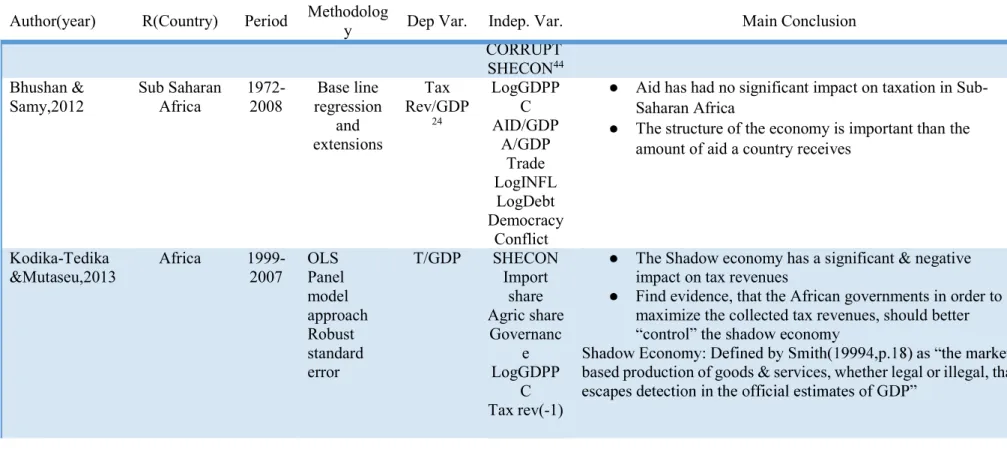
Furthermore, Gambaro et al (2007) find no evidence that foreign aids substitute for domestic tax revenues, though find a positive association between aid inflows (in form of grants as opposed to loan) and tax revenues. In contrast, Ghura (1998) find that increase in the level of external grants are associated with lower tax ratios. Bhushan & Samy(2012) mentioned that the structure of the economy is important than the amount of aid a country receives. The Africa Tax Outlook(2017) report shows that a country´s economic structure
Official development assistance (ODA): Foreign aids data include grants and loans but are net rather than gross, that is, current loan repayments are subtracted. Net aids equals aid disbursement minus repayment of principal(Brautigam and Knack, 2004)
might also determine its ability to raise revenue, it explained that sectors marked by high levels of informal activity are more difficult to tax. According to Sy & Sow(2016), Africa continent is currently a net creditor to the world, despite the levels of ODA and FDI received. This can be explained by the large outflow of capital from the continent driven
by high amount of unrecorded capital flows, also known as illicit financial flows2(IFFs)
At the inception of global financial crisis starting in 2008, it was widely suggested by several authors, not only for Africa countries but for OECD as well, that much efforts is required towards mobilizing domestic tax revenues as a measure to stabilize dwindling, declining and eroding tax bases via effective tax structures reforms and also to review existing tax policy to checkmate increasing activities such as Base Erosion and Profit shifting(BEPs) rampant among Multinationals, illicit financial flows and tax evasion( Oguttu , 2016 ; Crivelli et al, 2016; Baunsgaard & Keen, 2010)
Tax revenues as a percentage of GDP, estimated to be around 15 or less in more than half of all the countries on the Africa continent, which is much lower than the optimal threshold of 25% required to finance investments in capital development(Cnossen,2015, African Economic Outlook, 2018). Mascagni et al (2014) confirmed that, sequel to a lower tax efforts indices3 as obtainable in developing countries compare to the OECD,
the tax revenues to GDP ratio is 10-20% for developing and 30-40% for OECD. Chimilila (2018), finds that Sub Saharan Africa countries have the lowest tax performance. A recent study conducted on behalf of the European Parliament's Committee on Development shows that
have seen larger increases in tax revenue in recent years than Sub-(Mascagni et al,2014).
Most empirical studies focused mainly on Sub Saharan Africa, excluding North Africa from the sample of countries used, also very little attention had been given specifically to the determinants of corporate tax revenue which is a major constituent of total tax revenue in this region. We intend to understand the performance of tax revenues in African countries and as well empirically determine the main economic, sector and
Kar & Freitas(2013) report estimates that, in 2009, illicit financial flows out of Africa were three times the amount of ODA received
institutional variables that influence the tax revenues(%GDP) and corporate tax revenues(%GDP)in Africa.
The knowledge of the main determinants of tax revenues and corporate tax revenues can be helpful to policy makers in the sense that they can optimize the collection of tax revenues through required structural reforms of economic, institutional and fiscal policies. The study also contributes to the pool of scientific tax journal with emphasis on how to increase tax revenues performance and efforts.
To perform our study, we obtained yearly unbalanced panel data from 1997 to 2016. We excluded years where data was not found for the dependent variables of interest which gave a final data set of 36 countries and 13 countries for Tax revenue(%GDP) and Corporate tax reveneue(%GDP) respectively. Considering the fact that our diagnostic test on the regressions residuals, indicates a violation of some basic assumption of the OLS, hence the need for a robust OLS standard error approach, to avoid a biase estimate. We used the Driscoll and Kraay(1998) standard errors for the coefficient estimated by the pooled OLS, fixed effect(within) regression.
The results indicates that total tax revenue (as a percentage of GDP), is positively correlated with our determinant variables which are, public spending, industry share, control of corruption and government effectiveness, whereas the log of GDPpercapita, inflation and agriculture share indicates a negative correlation. Regarding corporate tax revenue (as a percentage of GDP), we find evidence of been positively correlated to inflation and trade openness , while public debt indicate a negative correlation.
The dissertation is structured as follows: we begin by discussing the relevance of tax revenues as a panacea to inadequate government revenue . In section 2, we review literatures generally and specifically on Africa on tax revenues and corporate tax revenues. In section 3, we discussed the data, methodology, diagnostic test on the variables. In section 4, we discussed the results obtained, its implications and explain some descriptives on differents tax mix in Africa. The final section, discussed the conclusion, limits and consideration for possible future work
2
Literature Review
2.1 Main ConceptHinrisch (1966) studies on the evolution of tax system, which forms the basis concerning the choice and behaviour of taxes during a development process, used two methods to explain several broad empirical generalizations based on the size and structure of government revenue system at different phases of socio-economic development. These two methods are: static cross-section analysis of different countries at the same time and dynamic study of specific countries at different times. Subsequently, (Ahmad & Stern, 1989; Burgess & Stern, 1993) stated that the impacts of socio-economic development
such as 4
improved administrative skills to harness these available means has the capacity to raise tax ratio. Chimilila (2018) shows that features common to structure of taxation in developing countries are: narrow tax bases, barely progressive taxes, widespread of vities. Kenny & Toma (1997) mentioned that the reliance on tax source increases as; the base for the tax grows, administrative cost fall or total revenue needed increases. As suggested by Keen & Mansour (2009), concerning tax structure, they show that there has been downtrend in trade taxes and an upward trend in indirect taxes, while income taxes almost remain constant( Fig. 2 and Fig. 4)
The design of tax structures5 implemented by different countries greatly impacts
on their level of taxation. Alt(1983), stated that tax structures vary from country to country based on: the level of revenue extracted, shares of total revenues raised by different kinds of taxes based on different classifications, centralization of administration, amount of redistribution achieved by the tax system and the complexity of the tax system, different rates of taxes and the associated range of exemptions. Edmiston et al (2003) argue that, in transition countries the design of the tax structure and the way in which it changes over time can critically affect the level of risk and transaction costs associated with foreign direct investments. In addition, he find that complexity and uncertainty with respect to multiple tax rates, unclear language in the tax laws and inconsistent changes in
hat lend themselves to taxation
5 The tax structures measures the composition of tax revenues by different tax types. This is an important
the tax laws, have a significant negative effects on inward FDIs. Furthermore, Khujamkulov (2016) find that GDP percapita growth leads to changes in the composition of taxes and the tax structures in transitional economies. He concluded that, in specific transitional countries, the higher the national income, the degree of openness, the share of the non-agricultural sector, the rate of population growth, the extent of urbanization, the density of population, the proportion of younger population and the employment rate, the higher the ratio of taxes to GDP.
Developing countries tax structures vary widely, while that of the industrialized nations are similar to a certain extent (Tanzi, 1992; Zee, 1996). As shown by Revenue Statistics of Africa (2017), the average tax structures of the African countries is similar to that of the Latin America & the Caribbean (LAC) region, except that social security contributions were more significant in LAC. Burgress & Stern(1993) discovered that corporate income taxation has limited scope and personal income tax require sophisticated administration, while the domestic taxes on goods & services(VAT) are accessible wherever markets or productions exist. According to Zee (1996), he finds that income and consumption taxes comprised more of total tax revenues from developing countries. Likewise that the level of taxation obtainable in the developing countries is half that of the developed as the latter tends to rely more on income taxes and much less on trade taxes. In addition, trade tax revenues(Fig. 2, Fig. 3 & Fig. 4) was found to be more unstable among the different tax mix in Africa Zee, 1996).
Moore (2013), in a bid to answer the question on why governments of low income countries (LIC) could not raise more taxes, used comparison among countries and potential benefits of reforms in tax policy and administration. He finds the economic structure, rent taking, inefficient tax administration, underused property taxes compare to othe overnment institutions as the cause of low tax takes. Also, Ghura (1998) finds that countries that have implemented structural reforms on a sustained basis have raised their tax revenue higher than those that did not. Furthermore, Burgress & Stern (1993) explained that a typical element of tax reform in developing countries are efforts to broaden the tax base. In response to the same question, Cnossen (2015) shows that it may be difficult to generalize such reasons on the ground that different political and economic structures holds in the low income countries. Mansour & Keen (2009) find that African governments approach in the provision of tax
incentives to attract foreign investments was not properly structured. In addition, Drummond et al (2012) find that increased mobility of tax bases owing to trade liberalization, mobility of investments and capital income, tariffs6 and other trade taxes
are major complication to mobilizing adequate fiscal revenue in SSA (Agbeyegbe et al,2006). Takumah (2014) was of the opinion that tax base needs to be widened and tax rates reduced in order to generate more revenues. Likewise Gillis (1989a) opined that as tax bases widen, the tendency to impose high rates on the narrow tax bases is reduced and this may have a positive effect on enforcement and the amount of revenue realized.
In addition, African tax system have been characterized by huge Informal sector.7Joshi et al (2014) show that with respect to revenue, it represents a potentially
significant source of tax revenue for governments in dire need of funds. According to Auriol & Warlters (2005) find that higher entry fees, set as barriers into the formal economy, is a deliberate government policy, resulting to a large informal sector and revenue at low administrative cost. In addition, it estimated that a 1% increase of the entry sunk cost increases the informal sector by 14 %( Auriol & Warlters, 2005); as a result, large proportion of total tax collection in developing countries is linked to few taxpayers. This in a way has also contributed to narrow tax base and had paved way for the economic stance on shadow economy8. According to Schneider et al (2011), based on their estimate
for the period from 1999 to 2007, they find that the weighted average size of the shadow economy(as a percentage of GDP) in SSA is 37.6% , in Europe and Central Asia(mostly transition countries) 36.4% and in high OECD countries 13.4%.They concluded that an increase burden of taxation(direct and indirect ones) with labour market regulations and the quality of public goods & services as well as the state of the official economy are the driving forces of the shadow economy
Despite the huge improvement in tax revenues in African countries. Stotsky & WoldeMariam(1997) find variation in the tax revenue performance from the region. Drummond et al (2012) find that only few low income countries in SSA, were not able to
Other pressure on tariff revenue is the formation of free trade zones and customs unions, which could narrow the tax base(Drummond et al,2012)
Originally proposed by Keith Hart (1973), it initially referred to employment outside of formal labor markets. The focus is on legal status of the business (Joshi et al, 2014). Some authors have preferred the
-to--based production of goods & services, than the informal sector or economy(Joshi et al,2014)
increase tax ratio (at least once in the last two decades) by more than 2pp of GDP in the short to medium term. More studies have recently shown a major setback which portends negative impact on tax efforts, though not limited to Africa, and have been a major concern on the scene of the International tax system, inter alia , are corruption, base erosion and profit shifting (tax avoidance) and tax evasion, spillover effects9 and vicious
cycle of low tax collection (Gupta, 2007; Gambaro et al, 2007; Drummond et. al, 2012; Cozmei, 2015; Crivelli et al, 2016; Amoako-Tuffour, 2015).
2.2 Determinants of Tax Revenues
In literatures, the standard approach is to model the tax revenue to GDP ratio as determined by variables chosen to proxy for the tax base and structure of the economy (Gupta, 2007).
The determinants of the tax revenues to GDP (or GNP) ratio most commonly used in previous literatures are : the sectoral composition of value added(agriculture share, industry share, mining share, manufacturing share, services), the stage of development(GDP per capita), demographic features(population density, rate of population growth & urbanization), degree of openness to international trade, inflation, Institutional quality(as measured by the worldwide governance indicators), Shadow economy, Foreign aids and rents received from natural resources(Stotsky & WoldeMariam,1997; Teera,2002;Gupta, 2007 ; Piancastelli, 2001).
The Sectoral composition of value added constitutes a key element of the tax base and is likely to be an important influence on the tax share because some sectors of an economy are amenable to taxation and generate different taxable surpluses(Stotsky &WoldeMariam, 1997 ; Ghura, 1998; Kodila-Tedika & Mutaseu, 2013). Agbeyegbe et al (2006) summarize that variables reflecting the share of different industries in the economy capture the differences in the ability to tax component of the economy. Stoksy and WoldeMaria(1997) find that both agriculture and mining share are negatively related to the tax ratio, while export share and percapita income have positive impacts.
spillover effects are the impact of one country's tax policy on the tax bases of other countries which could be either through investments or shifting of profits (Crivelli et al, 2015)
The share of agriculture in the economy may be an important determinant of taxable capacity in developing countries(Stotsky & WoldeMariam, 1997). In developing countries, higher share of agriculture in the economy are said to be associated with lower tax to GDP ratios in many studies(Addison & Levin, 2012; Khujamkulov, 2016). However, a large share of agriculture may reflect an export industry in certain crops, which might be more amenable to taxation. Agriculture is a challenging sector in many developing countries owing to the fact that most people in this sector are on low incomes and are not registered for tax purposes, also there is less taxation of the agricultural sector in Africa due to a high level of informality and a low level of monetization.
The Mining share can generate large taxable surpluses. They are usually only a few large firms engaged in this sector, which facilitates tax administration. Nevertheless, since foreign investment in mining and oil extraction is common, countries may give significant tax concessions to foreign investor, limiting potential revenue collections from this source (Stotsky &WoldeMariam,1997). In addition, Kodila-Tedika & Mutaseu(2013) opined that the mining sector may be useful to generate significant tax revenues to the economy if these areas attract large companies. However, Gupta(2007) find that the effects of mining share and revenue performance is ambiguous. Furthermore, the industry share may proxy for mining share in low income countries. Piancastelli(2001) finds that tax ratio is positively related to the share of industry in GDP. This implies, the greater ease of taxing the profits of industry.In addition, he finds that the share of industry and service sectors also matters in explaining the differences in tax ratios. The Manufacturing share, consist of enterprises that are easier to tax , since business owners keep better books and records. This sector can generate large taxable surpluses if production is efficient (Stotsky & WoldeMariam, 1997).
GDP per capita or Per capita income is typically considered the best proxy for the overall level of development that is expected to reflect administrative capacity and tax collection efficiency (Tanzi, 1992; Stotsky & WoldeMariam, 1997). Tanzi (1992) finds a positive and significant relationship between the share of taxes in GDP and log of Per capita income. Teera (2002) finds a positive relationship between per capita income and total tax revenue. Gupta (2007) finds evidence that log GDP per capita is significantly positive in all random effect regression and in most fixed effect specifications. Baunsgaard &Keen (2010) finds that log GDP per capita is negative and insignificant with respect to domestic tax revenue. Mahdavi (2008) finds that inverse of the GDP per
capita is strongly and negatively correlated with the level of taxation, which implies that the level of taxation rises with the level of economic development. Ebeke & Ehrhart (2010) find a negative association between GDP percapita instability and tax revenues. Kodika-Tedika & Mutaseu (2013) find that GDP percapita is negatively significant and is the main tax base for tax revenues.
The International trade share in the economy is a measure of openness. A number of studies used different measures of trade openness/trade liberalization to assess the effect of trade policy reform on total tax revenues and trade tax revenues in developing countries(Gnangnon,2017). Openness referred to the ratio of the sum of the export and import (ie trade volume) to GDP and represents the relative size of the international trade & transaction sector in the economy (Mahdavi, 2008; Stotsky & Woldemariam, 1997). International trade sector is a well-organized and monetized sector(given that imports and exports take place at specified locations) which makes the collection of trade taxes easier than income taxes for developing countries and particularly the low income countries(Ghura, 1998). Drummond et al (2012) find that the degree of trade openness may also matter for revenue performance. He further explained that imports and exports are amenable to taxes because these activities take place at specified locations. As a result of the declining trade taxes due to trade liberalization, Baunsgaard & Keen (2010) comment that, further trade liberalization may not be feasible, hence the need for many developing countries to find alternative sources of revenues such as excise taxation and broad based consumption taxes. In addition, Ebeke & Ehrhart (2010) finds that a lower reliance on trade taxes and higher dependency on domestic indirect taxes lead significantly to low levels of instability of tax revenues. Stotsky & WoldeMariam (1997) suggest that the trade volume measure of openness is of questionable relevance as it combines imports and exports, since both are taxed with applicable tax rates varying in different ways. It was considered more helpful to distinguish the import to GDP ratio as an indicator of the tax base for tariffs from the export to GDP ratio that can be interpreted
as an indicator of the performance of major sectors of the economy. Institutional quality as measured through the world governance indicators, is an
important determinant of tax revenues (Gould & Baker, 2002; Kenny & Winer, 2006; Gupta, 2007; Timmons, 2010; Monteiro, 2012; Ahlerup et al, 2015). Gupta (2007), finds that among the institutional factors, corruption has a significantly negative effect on revenue performance.Kenny & Winer (2006) show that democracies rely substantially
more on income taxation, due to the fact that this tax source requires higher degree of voluntary compliance. According to Addison et al (2002), they concluded that Public revenues plunges to very low level in conflict affected countries, sequel to this, revenues from indirect taxes fall owing to battered economic activity, decline of the quality of tax institution and more dependence on import duties and other trade taxes by government. Ahlerup et al (2015) find that the level of institutional quality affects the effectiveness and productivity of Autonomous Revenue Authority (ARA) with positive effect on tax revenues in the short and medium run, though not consistent over time. ARA and VAT are the two measures of tax innovation used in the study. However, they found that Tax innovation are not a panacea to overcome the revenue shortages in Africa countries, but are helpful in the short and medium term. Surprisingly, VAT has no effect on total tax revenues in the study. In addition, Addison & Levin(2012) find that the overall tax to GDP ratio is higher in more open and less agricultural dependent economies, less populous and peaceful countries
Shadow economy has been found to have a significant and negative impacts on tax revenues in Africa (Kodika-Tedika & Mutaseu, 2013; Teera, 2002; Drummond et al, 2012). Kodika-Tedika & Mutaseu (2013) find evidence that for African government to maximize the collected ta not be over-emphasize. Teera (2002) proxy for the size of hidden economy which indicates tax evasion and lead to loss of government tax revenues. Drummond et al (2012) find that it is a significant determinant of tax revenues with important policy implications.
Inflation might have a detrimental effects on tax collection as a general proxy for macroeconomic conditions (Agbeyegbe et al, 2004). It is also a proxy for expansionary monetary and fiscal policies (Ghura,1998). Gnangnon(2017) opined that inflation would lead to an appreciation of the real exchange rate and encourage imports, thereby generating higher trade tax revenues. On the other hand, inflation would depress domestic revenue. Generally, higher inflation would likely be associated with lower domestic tax revenue and higher trade tax revenue. Ghura (1998) finds that among the economic policy related variables, inflation has the largest impacts on tax revenues to GDP. Mahdavi (2008) finds that the level of taxation is lower when the rate of inflation is higher, with negative and significant effects on tax revenues. Agbeyegbe et al (2006) find a negative and significant effect on total tax revenues. Bhushan & Samy (2012) find that high inflation rates are expected to reduce the real value of taxes collected. Khujamkulov
(2016) finds that inflation is positively and strongly correlated with tax revenue in general, including or excluding social security contribution. in addition, the positive effect of the inflation rate on tax revenue suggests that higher rates of inflation mean more tax collected, which however, is worth less on account of the fall in the value of money.
Demographic factors have been found to be an important determinants of tax revenues in literatures. Khujamkulov (2016) finds that the higher the rate of population growth, the extent of urbanization, population density and the proportion of younger population the higher the ratio of taxes to GDP. In addition, among the demographic variables, urbanization and population density variables positively and strongly affect all tax revenues. This is due to the concentration of industries and population density of the urbanized areas where more tax payers live, which therefore, facilitate overall tax revenue collection and contribute to a higher share of revenues. Teera (2002) finds that population density affect all taxes. Mahdavi (2008) argue that revenues from certain tax types are likely to grow with the extent of urbanization and the density of population. He cited that property taxes are expected to gain as the values of land and real estate rise faster in more urban and densely populated areas than in rural or sparsely populated areas.
A high ratio of foreign aid to GDP, in previous literatures has been found to slow tax revenue collection(Leuthold,1991: Tanzi,1992; Mahdavi,2008). In contrast, Gupta(2007) finds that recepients of larger foreign aid tend to mobilise more tax revenues. He proposed that it is important to distinguish the type of aid, as aid in the form of loans may induce policy makers to mobilise higher tax revenues. However, aid in the form of grants may decrease the incentive to increase the tax base.
In Africa, the level of reliance on natural resource rent was found to be positively linked with the instability of government revenues. This is due to the instability of oil prices leading to a situation of macroeconomic uncertainty and difficulties in the execution of fiscal and developmental policies (Baunsgaard & Keen, 2010). Having failed to take advantage advantage of her resource revenue to develop non resource activities so as to broaden the tax base.
2.3 Determinants of Corporate Tax Revenues
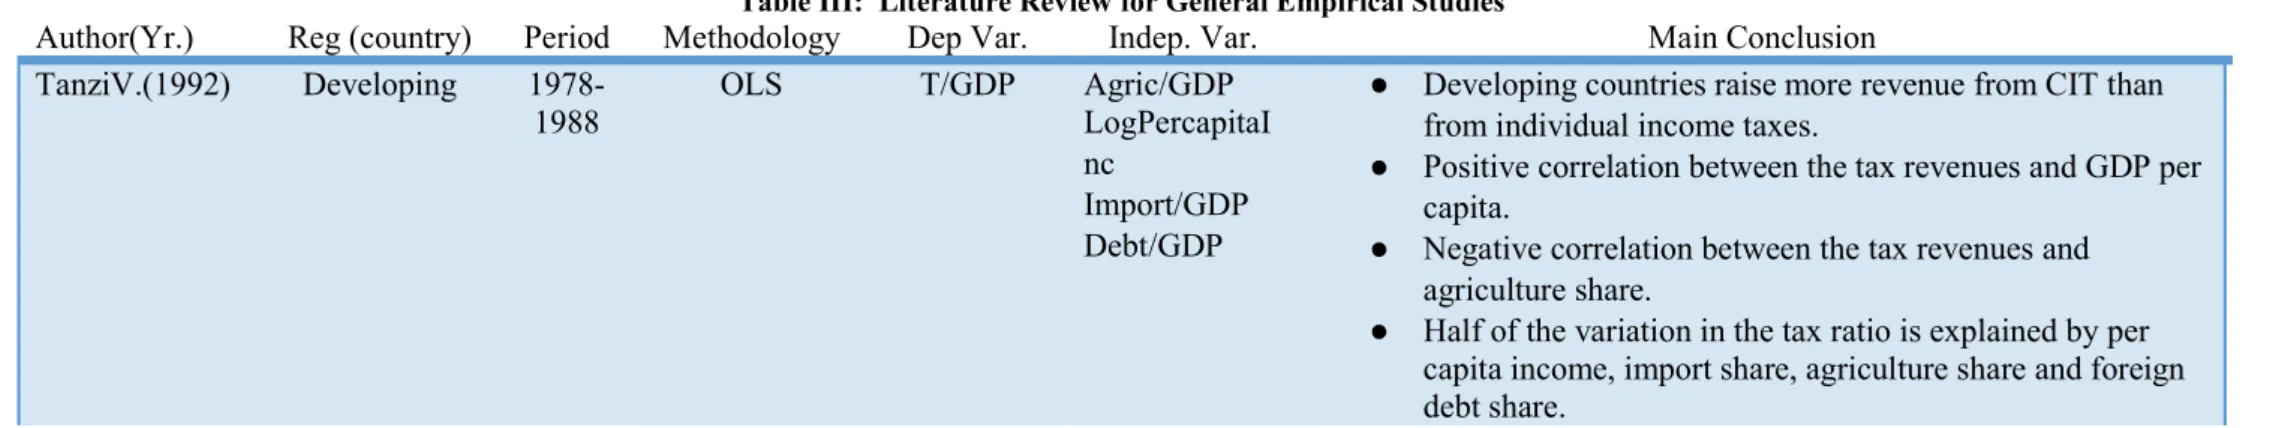
Corporate tax system is an important source of revenue that must be retained (Avi- Yonah, 2015) owing to the fact that a larger proportion of many African countries tax bases are corporate taxes from multinationals, due to limited domestic corporate tax base( Durst,2014). Hence the need to preserve this tax base and since it has the potential to contribute greatly to domestic revenue mobilization (Mansour & Keen, 2009; Durst, 2014). In addition, developing countries raise more revenues from corporate income tax than from individual income taxes (Tanzi,1992; Burgress & Stern, 1993; Gupta, 2007).
The determinants of corporate tax revenues based on previous literatures are: tax system, unemployment rate, size of the economy, corporate tax competition, Inflation, real exchange rates, degree of openness, and GDP per capita (share of the corporate sector)
The Tax system is the legal system for assessing and collecting taxes. Clausing (2007) used a tax system dummy, indicating whether countries have a tax credit system, a mixed system or a territorial system. A territorial system of corporate income taxation excludes the foreign income of resident from taxation. A tax credit system taxes foreign income, but allows a foreign tax credit for taxes paid to foreign governments. This credit is typically limited to the domestic tax liability. The mixed tax system contain elements of both the territorial and the tax credit systems. He concluded that tax credit countries receive statistically significantly more corporate tax revenues relative to GDP than those with territorial system. Kewano & Slemrod (2012) find the type of tax system as one of the factors that consistently have a significant effect on corporate tax revenues. Gupta (2007) finds that country that rely more on income taxes, profit taxes and capital gain taxes perform much better
Tax rate increase has apparently no impact on revenues in Africa(Abbas & Klemm , 2013). The possible explanation why tax increases in Africa seem not to translate to benefits in revenues, is due to the prevalence of special regime, which implies that the standard tax rate is irrelevant or that firms react to tax rate increases by shifting profits or real activity elsewhere so as to cancel the effect of the higher tax rate . Furthermore, they find that despite tax competition, tax revenues are function of the tax rate (except in Africa), although the relationship is weakened in the presence of special regimes.
Furthermore, many factors other than tax rates affect the revenues that government receive. Revenues depend not just on the statutory tax rates set by legislators, but also on the breadth of the tax base, the opportunities for tax avoidance, the aggressiveness of corporate tax planners, the enforcement efforts exerted by government tax authorities, economic conditions that determine the profitability of firms, and the share of the corporate sector in the economy(Clausing, 2007). Kewano & Slemrod (2012) find that tax policies that broaden the tax base are associated with increase in corporate tax revenues. Furthermore, they find a weak relationship between corporate tax rates and corporate tax revenues, this is due to the persistent differences in tax policy and business environment across countries.
The most important barrier to the effective control of base erosion is the pressure of tax competition (Durst, 2014). Mansour & Keen (2009) find that corporate tax competition commonly takes two main forms: countries may offer a low statutory rate of corporate tax, available to all firms and the provision of selective preferential tax treatment10, targeted on particular categories of investment or particular tax payers.
Countries may offer a low statutory tax rate based on the national advantages it provides such as: lowers the average effective tax rate11, reduces the incentive for tax planning12.
In addition, they also cited that one of the central challenges that globalization poses for revenue mobilization in SSA is corporate tax competition. They concluded that corporate income tax revenue largely increase despite a reduction in rates and also find evidence of base narrowing mainly through the provision of tax holidays in investment codes and free zones. Cozmei (2015) find no evidence that downward pressure on corporate tax rates are not translated on a fall in corporate tax revenues over the time. Furthermore, Abbas & Klemm(2013) find evidence of a partial race to the bottom on the basis that countries have been under pressure to lower tax rates in order to lure and boost investment. However, for Africa, a race to the bottom is evident among special regimes13.
10 Such as tax holidays, often through free zone laws which apply to exporters, investment tax credits
restricted to particular activities(such as R&D or investment located in particular region)
11
12 Through transfer pricing and financial arrangements to shift taxable profits to foreign jurisdiction offering
lower tax rates
13 Special regime was included as a dummy variable in the model, which entails: partial tax holidays,
temporarily reduced rates & increased investment allowances. The impact of an increase in tax rate is reduced by half as a result of the effect of the special regime
GDP per capita is used to proxy for the size of the corporate sector (Clausing, 2007; Abbas & Klemm, 2013). Ohno et al (2015) find that rise in the share of the corporate sector was the principal contributing factor in pushing up the ratio of corporate tax revenue to GDP. Gambaro et al (2007) find that GDP percapita has strong positive association with revenues from income & corporate taxes with respect to high income countries. Also, Cozmei (2015) find that GDP percapita is strongly correlated with corporate tax revenues (%GDP).
Unemployment rate was found as one of the factors that consistently have a significant effect on corporate tax revenues (Kewano & Slemrod, 2012). Monterio et al (2011) used unemployment rate as a proxy for cyclical variables that should influence the profitability of corporate firms.
A openness measured by Clausing (2007) as the relative ratio of FDI to GDP. Clausing (2007) finds that revenue maximizing tax rate decrease as economies are smaller and integrated with the world economy. In addition, smaller and more open economies will have lower revenue maximizing tax rates than do bigger and more closed economies. A larger, more closed economies tend to have higher revenue maximizing corporate tax rates. A good explanation for it, is the fact that more closed economies are less affected by external, international factors and tax competition in general (Clausing, 2007). Mahdavi (2008) finds that open economies should experience higher revenues at low tax rates and lower revenues at higher tax rates.
Inflation interacts with corporate taxation through the deductions of capital expenditures(depreciation allowances) and interest payment on debt(Finocchiaro et al, 2018; Agbeyegbe et al, 2006). In addition, they explain that due to the fact that investment expenditures are usually computed at their historical cost, inflation reduces the real value of the deductions.Hence, it
profits and consequently increases the distortionary effects of corporate taxation, while the value of interest deductions from corporate taxation rises with inflation owing to tax shield benefit from debt.
A decline in the real exchange rate of a country that import relative to the currency of the country that export, would raise the relative cost of the imported goods used by corporations as inputs into production and this increase in cost would tend to
lower profitability and thereby reduce corporate tax revenue available to the government (Agbeyegbe et al, 2006).
2.4 Studies on Africa
The need for domestic revenue mobilization have gained increasing relevance in the policy debate in developing countries as a result of the potential benefits of taxation for state building, long term independence from foreign assistance and the shifting aid paradigm, the fiscal effect of trade liberalization, the increased prominence of fiscal issues in the nations of North America and Europe with developed capitalist economies, due to the financial and debt crisis, and the continuous severe financial needs of this region(Mascagni et al, 2014). Chimilila (2018) in his studies on the impacts of DRM on long term economic growth in Tanzania. He finds a positive long run effect of DRM on growth, though the short run effect is negative and statistically significant. This can be explained by the distortionary effect14 of taxes in the short run.
esponse to the OECD BEPS Actions Plan15. Oguttu (2016)
argue that BEPs concerns for developing countries such as Africa, may not necessary be the same as those for the developed countries, as the needs and capacities of all countries should be considered. Owing to the fact that there is need for Africa to come up with unique solutions to protect its own tax base, so as to ensure domestic resource mobilization. The two action plans prioritised in most African countries are : the limit of base erosion via interest deductions and to prevent treaty abuse16. This
is due to the common drawback amongst most African countries concerning base eroding interest payments and abuse of tax treaties.
The impacts of trade liberalization on tax revenues was examined (Baunsgaard & Keen ,2010) . Domestic tax revenue was proposed as a viable option to ensure recovery of revenue loss from trade liberalization. They found that high income countries were able to recover the loss from trade liberalization through domestic tax revenue, for middle income countries, a robust signs of strong replacement both concurrently with revenue
14 Distortionary effects are in one way a result of a tax system that targets few easy to tax individuals and
corporations due to a large informal sectors(Chimilila,2018)
15BEPs Action Plan is Intended to ensure that profits are taxed where the economic activities generating
those profits are performed and where value is created
loss and essentially dollar for dollar in the long run and while for low income countries sign of significant recovery are flimsier, though country experiences differ.
The tax structures of developing countries have responded differently to the impacts of trade liberalization to tax revenues. Tosun(2003) finds that unlike other Non-OECD countries, the MENA countries did not increase their reliance on domestic consumption taxes in response to trade liberalization, owing to the fact that trade
countries, instead there is an increasing reliance on international trade taxes. The findings is in contrast with the response of some developing countries which liberalize trade and concurrently reform their tax structures by raising domestic consumption taxes.
Despite the natural resources endowment in this region, revenue performance in most African countries is below expectation (Ndikumana & Abderrahim, 2010). They found that in Sub Saharan Africa, countries that rely heavily on natural resources have not outperform their resource scarce counterparts with respect to revenue mobilization. Furthermore, among several causative factors, two were identified. Firstly, countries in this category lack the capacity to optimize the revenue generation from natural resources. Optimize in the sense that, it needs to put in place designs and contract negotiation skills that will also encourage foreign direct investments. Secondly, the failure to take advantage of resource revenue to develop non resource activities so as to broaden the tax base. According Agbeyegbe et al (2006), though taxes constitute the largest share of revenues for most SSA countries, the main exception are those that rely heavily on natural resources. In addition, Bothole et al(2012) , provide evidence that natural resources are only detrimental to tax revenue mobilization in the absence of good governing institutions. He further explained that resource rich countries with good institutions are likely to develop a stronger tax system.
3 Methodology, data and Variables
This section states the objective and explain the data, variables empirical methodology used.
3.1 Research questions and Objectives
The objective of this dissertation is to provide answer to the following questions i. How is Tax Revenues in Africa?
ii. What are the determinants of Tax revenues in Africa?
iii. What are the determinants Corporate Tax revenues in Africa? 3.2 Data & Descriptive statistics of variable
We obtained data on economic, sector and institutional variables from sources such as: World Bank database (governance & development indicators), IMF International Financial statistics and Revenue statistics for Africa 2017 with yearly data starting from 1997 to 2016. We used an unbalanced short panel data set originally made up of 54 cross-section (countries) and 19 timeseries. We excluded countries and years where data was not found for the dependent variables, which gave a final data set of 36 countries and 13 countries for total tax revenue(%GDP) and corporate tax revenues(%GDP) respectively. From Table VII, we found evidence for significant variation in the trends of the variables over the period of consideration.This shows the wide difference between the min and max values.
3.3 Dependent variables
The choice of the dependent variables used is based on the objective of the dissertation, which is to estimates the determinants of Tax revenues (as a percentage of GDP) and Corporate tax revenues (as a percentage of GDP).
Tax revenues (as a percentage of GDP): are the total yearly revenues collected from different tax mix (tax structure) for each country in sample. Onakoya et al (2016) find that tax revenues is positively related to GDP and it promotes economic growth in Africa. In addition, Takuma (2014) also find that tax revenues exerted a positive and statistically . We obtained
Corporate tax revenues( as a percentage of GDP): This is a yearly revenue collected from
company. Durst (2014) finds that a larger proportion of most African countries tax bases are from multinationals. In addition, Tanzi (1992) finds that developing countries raise more revenues from corporate income tax than from individual income tax. We obtained the data from Revenue statistics for Africa (2017).
3.4 Diagnostic test on dependent variables
I. Residuals Normality with outliers:This test is also known as Leverage17 versus
Normalized residual squared as shown in Fig. 5 & Fig. 8 for the total tax revenue and corporate tax revenue respectively. The plot provides us a means of simultaneously identifying outliers and high leverage data. The mean normalized residual is represented by the vertical line, while the mean leverages is represented by the horizontal line, which makes it easier to identify data that are above mean data points.
II. Kernel density estimate: This plot as shown in Fig. 6 & Fig. 9 is useful in verifying if residuals are normally distributed by the plot showing a density graph of the residuals with a normal distribution super imposed on the graph.
III. Standardized normal probability plot: This plot as shown in Fig. 7 & Fig. 10 is more sensitive to deviances and it check for non-normality in the middle range of the residuals.
3.5 Independent variables
Based on the objective in view, which is to provide answers to the three research questions which are: How is tax revenues collection performing in Africa and its major challenges, estimate the determinants of tax revenues in Africa, estimate the determinants of corporate tax revenues in Africa. Hence the need to identify relevant variables for this analysis. The selected variables were grouped as economic variables, sector variables, institutional variables. Table VI, shows the source of the explanatory variables, expected sign from literatures and the reasons.
I. Economic variables
LogGDP Per capita: is the log function of GDP per capita. Generally used as the proxy for the overall development of the economy. Cozmei (2015) also used it as a proxy for return on investment and for wages. Kodika-Tedika & Mutaseu (2013) mention that it is the main tax bases for tax revenues. Countries with high income tend to have a more monetized economy and better tax administration. Hence, it is expected that it has a certain positive significant correlation with tax revenue as a percentage of GDP (tax
Leverage is a measure of how far an observation deviates fro the mean of that variable. A point with high leverage is an observation with extreme value on a predictor variable.
performance) database
Public Spending: It is the general government final consumption as obtained from the World Bank. It exerts a positive effects on total tax revenue (Agbeyegbe et al, 2006). In addition it proxy for government revenue needs and is considered to have a positive impact on corporate taxation (Cozmei, 2015)
Trade openness: Openness referred to the ratio of the sum of the export and import (ie trade volume) to GDP and represents the relative size of the international trade & transaction sector in the economy (Mahdavi, 2008; Stotsky & Woldemariam, 1997). Inflation(consumer prices, annual %): is an indicator that capture changes in price level of all goods and services in an economy. It is expected to have a negative sign. We
Public Debt: It is the African central government debt. Higher debt burdens induce government to resort to higher taxes to finance them (Bhushan & Samy, 2012; Teera, 2002) and also have significant impact in explaining half of the variation in tax ratio. The expected sign is positively correlated with the tax ratio
II. Sector variables
Agriculture: is used as an explanatory variable to control for the difficulty in collecting taxes from this sector. In low income countries agricultural activities organized on a small scale basis are difficult to tax due to high level of informality and a low level of monetization. Most studies found a negative relationship between the share of agriculture and the total tax revenue ratio (Oguttu, 2016; Agbeyegbe et al, 2006).In addition to, Gardebrock&Peerlings(2013) decomposed the ratio into five defining factors which are: the ratio of net value added and production in agriculture, the ratio between agricultural & food production, self sufficiency of food products, share of food in total consumption and share of consumer expenditure in GDP.
world development indicator database.
Industry: The industry share in low income countries may be proxy with mining share (Agbeyegbe et al, 2006). It might be expected to have a positive relationship with total
tax revenue due to greater ease of taxing the profits of the industry. We obtained the data
Services: used as a control variable (Piancastelli, 2001). It is expected to be positively related to total tax revenue to GDP.
development indicator database. III. Institutional variables
Rule of Law: The variable reflect the degree to which the citizens of a country are willing to accept the established institutions to make and implement laws and adjudicate disputes.
Governance effectiveness: It is the quality of public service provision, the quality of bureaucracy, the competence of civil servants, and the independence of the civil service
The expected sign either positively correlated with tax ratio. We obtained the data from
Control of Corruption: measures the extent to which public power is exercised for private gain, including both petty and grand forms of corruption as well as capture of the state of elites and private interest
governance indicators, where the higher the index the less the corruption indicated.
IV. Dummy variable
Financial cisis dummy:is a dummy that equal 0 if year is below 2008 and 1 if year is 2008 and above.
Oil prices crisis dummy: is a dummy that equal 0 if year is below 2014 and 1 if year is 2014 and above.
3.6 Test on Independent variables
In order to confirm the robustness and validity of regression model result, the following test were conducted
I. Multicollinearity: We used the correlation matrix (Table VIII), to identify the coefficients of explanatory variables with values equal to or higher than the threshold of ± 0.6, which is identified as a near multicollinearity problem, while those that equal to 1 indicate perfect multicollinearity problem.
II. Heteroscedasticity: To check if the homoscedastic assumption of the error term in OLS is violated or not, we used the Breusch pagan test. We soundly reject the null hypothesis of homoscedasticity at 1% significance level .
III. Wald test(Wald chi-squared test): This test is used for testing the significance of explanatory variables in a statistical model. If the wald test is significant, then we would conclude that the variables are not zero, so the variable should be included in the model. If the wald test is not significant then these explanatory variable can be omitted from the model. In this case, the variables were significant.
IV. Hausman test: is used to choose between fixed effect model and random effect model. The null hypothesis underlying the Hausman test is that the fixed effect model and random effect model estimators do not differ substantially. The test statistic developed by Hausman has an asymptotic chi-square distribution. If the null is rejected, the conclusion is that random effect model is not appropriate and that we are better off using the fixed effect model. in this case, we find the fixed effect model to be appropriate for the estimation.
3.7 The Econometric Model
The estimating technique to use in a panel data study depends on whether we have a short or long panel data18. The Hausman test was in favour of the fixed model. The fixed
model, for a two way estimate, incorporating time and individual country effects is:
This model has an overall constant term(
country( , while ( ) captures the explanatory variabls, and ( is the error term . We study
Panel data models examine group (Individual or country specific) effects, time effects or both. These effects are either fixed or random. A fixed effect model examines if intercept vary across groups or time periods, where as a random effect model explores differences in error variances. If it assumed that the error component and the independent variables are uncorrelated, random effect model may be appropriate, where as if they are correlated, fixed effect model may be appropriate
total tax revenue (%GDP) and corporate tax revenue (%GDP) by means of the following model using the Driscoll and Kraay(1998) standard errors estimator for the pooled OLS regression.
Where:
stands for the dependent variables of interest which are Total tax rev (%GDP) and Corporate tax rev(%GDP), while i and t are country and time indicators respectively;
, , , ,
, , , are log of GDP per capita, tradeopenness, central government public debt(%GDP), public spending(%GDP), services share(%GDP), agriculture share(%GDP), industry share(%GDP), inflation, rule of law, government effectiveness and control of corruption respectvely.
In order to ensure valid statistical inference when some of the underlying regression
over emphasized. In addition, an attempt to ignore this measure can lead to several biased statistical result. Hence, the motivation for the use of the Driscoll and Kraay(1998) standard errors(with syntax: xtscc) for coefficient estimated by pooled OLS/WLS, fixed-effect(within)19 or GLS random effects regression is based on the assumed
heteroskedastic error structure, autocorrelation up to some lag and possibly correlation between the groups(panels). It is a non-parametric technique of estimating standard errors which does not place any restriction on the limiting behavior of the number of panels. Consequently, the size of the cross-sectional dimension in finite samples does not constitute a constraint on feasibility, even if the number of panels is much larger than the timeseries(T). This estimator works for both balanced and unbalanced panel data and capable to handle missing data.
The Fixed-effect within group estimator is one way to eliminate fixed effect, by expressing the values of the dependent & explanatory variables for each countries as deviations from their respective mean values.
- t
the heterogeneity among the 30 countries(i.e. the country specific characteristics) not by the dummy variable method but by eliminating it by differencing sample-observations among their sample means
Other methods such as Parks-Kmenta method (Stata syntax: xtgls.) are not appropriate with short panel data and it produces unacceptable small standard errors. In addition, the OLS coefficient estimate with panel corrected standard errors (Stata syntax: -sectional dimension, N is large compared to the time dimension. For instance, the White standard errors are robust to certain violations of the regression model assumption, as it does not consider cross-sectional correlation.(Beck and Katz,1995).
4 Results
4.1 Descriptive on Tax revenues
According to the estimate from African Development Bank as shown in Fig. 2 & Fig. 3, it can be deduced that among the different tax revenue mix in Africa, during the period from 2005 to 2015, resource revenue were higher, though suffer a setback from the year 2012, owing to the declining crude oil prices. The subject of dependence on resource revenue has been a major source of discussion in several literatures as the main reason for low tax effort in this region(Ndikumana and Abderrahim, 2010). On the other hand, for the non-resource rich countries(Fig. 4), indirect taxes takes the lead, followed by direct taxes in terms of their share in total tax revenues.
To motivate the regression results, it is instructive to examine the scatter plots of tax-GDP ratio(y-axis) against the explanatory variables(x-axis). The most striking stylized fact is the negative association between the tax ratios20 and the share of agriculture in GDP and
Inflation. As shown in Fig. 11, higher shares of agriculture in GDP are associated with lower tax ratio in African countries. Also, higher inflation are associated with lower tax ratio(Fig. 18 & Fig. 22).
Though the data are quite revealing with regards to the determinants of tax revenue in Africa, further empirical estimation is required to validate the answer to the research questions.
4.2 Results on Tax Revenues
We have considered only significant variables in our results in this section and the next. Table X , shows our results for the Total tax revenue (as a percentage of GDP). Regarding the economic variable, we find evidence that, public spending tend to increase tax revenue (as a percentage of GDP). Concerning, pubic spending, Gnangnon (2017) find that government expenditure is expected to have a positive impact on tax revenue, base on the fact that tax payers are encourage to pay their taxes when they see the benefits of their contributions.
On the other hand, with respect to the economic variables, our result shows that the log of GDPpercapita and inflation reduce tax revenue (as a percentage of GDP). With respect to the log of GDPpercapita, Kodika-Tedika & Mutaseu(2013), find that the log of GDPpercapita have a negative and significant relationship with tax revenue. A possible explanation, is based on the fact that the GDPpercapita growth rate in African countries is increasing more than the tax revenues growth rate. Furthermore, Ebeke & Ehrhart(2010) find a negative association between GDPpercapita instability and tax revenue. Mahdavi(2008) finds that the inverse of the GDPpercapita is strongly and negatively correlated with the level of taxation, which implies that the level of taxation rises with the level of economic development. With respect to Inflation, Bhushan & Samy(2012) find that high inflation rates are expected to reduce the real value of taxes collected. Ghura(1998) find a negative correlation with tax revenue and has the largest impact on tax revenue to GDP among the economic policy variables.In addition, Mahdavi(2008) also find a negative relationship with tax revenue, which implies the level of taxation is lower when the rate of inflation is higher.
Regarding the sector variables, we find evidence that industry share increase tax revenue (as a percentage of GDP). This result is consistent with that of Piancastelli(2001), which state that tax ratio is positively related to the share of industry share in GDP. This implies, the greater ease of taxing the profits of industry. Agbeyegbe et al(2006) obtained the same result using both collected tariffs and external trade in GDP as a measure of trade liberalization.
On the other hand, regarding sector variable our result show that agriculture share, reduce tax revenue (as a percentage of GDP), in agreement with Tanzi(1992), which found a negative correlation between the tax revenue and the share of agriculture. In addition,
Ghura(1998) finds that tax revenue to GDP ratio rises with reductions in share of agriculture. Gupta(2007) also find a strong negative and significant relationship between agriculture share and revenue performance. A possible explanation is that, agriculture share in GDP involves less taxation due to high level of informality and a low level of monetization. Furthermore, in Africa, most people in this sector are not registered for tax purpose.
Regarding the institutional variables, we find evidence that control of corruption and government effectiveness tend to increase tax revenue as a percentage of GDP. With respect to control of corruption, our result is in agreement with that of Mahdavi(2008) and Gupta(2007) which found a positive relationship with tax revenue to GDP. This implies that, tax revenue rises with control of corruption.
Regarding government effectiveness, our result is consistent with the expected sign. Considering the fact that, quality of public service provided , the quality of bureaucracy, the competence of government workers, independence of the civil service from political , all of which defines the concept of government effectiveness, can lead to increase tax revenue(Oasis & Mihai, 2013).
4.3 Results on Corporate Tax Revenues
Table XI shows our results for the corporate tax revenue (as a percentage of GDP). Concerning the economic variable, we find evidence that inflation rate and trade openness increase corporate tax revenue as a percentage of GDP. Regarding the inflation rate sign from the result of corporate tax revenue as a percentage of GDP which is contrary to the apriori expectation. Inflation interacts with corporate taxation through the deductions of capital expenditures or depreciation allowances (Finocchiaro et al, 2018; Agbeyegbe et al, 2006). In addition, they explain that due to the fact that investment expenditures are usually computed at their historical cost, inflation reduces the real value of the deductions. eciation taxable profits, as a result increase the corporate tax revenue available to the government.
Furthermore, concerning trade openness, Drummond et al (2012) find that the degree of trade openness may also matter for revenue performance. Clausing (2007) finds that
revenue maximizing tax rate decrease as economies are smaller and integrated with the world economy.
On the other hand, regarding economic variables, we find evidence that government public debt reduce corporate tax revenue as a percentage of GDP. Our result is consistent Gupta(2007) which found that public debt is negatively correlated with revenue performance, though not strongly correlated. This implies that a higher debt share is associated with a lower revenue performance. Furthermore, owing to the huge government public debt in this region, there is tendency for high corporate taxes as a ( especially multinational firms) will always respond in a way that is expected to reduce their tax liability through base erosion and profit shifting. In addition, Abbas & Klemm(2013) summarize that firms react to tax rate increases by shifting profits or real activity elsewhere so as to cancel the effect of the higher tax rate.
Concerning the institutional variables, we find no significant evidence for the impact of the institutional variables on corporate tax revenue as percentage of GDP.A possible explanation, is the fact that foreign investors seems to prioritise market support institutions. It is possible that, multinational institutions may see low institutional quality in the countries in this region has a blessing in disguise.
5 Conclusion, Limits and Future work
Tax revenues efforts in Africa over the years is still well below a threshold that is sustainable for capital and human developments. Existing literatures on the subject of the determinants of tax revenue in Africa using time series data for specific countries and panel data for group of countries. Most empirical studies focused mainly on Sub Saharan Africa, excluding North Africa from the sample of countries used, also very little attention had been given specifically to the determinants of corporate tax revenue which is a major constituent of total tax revenue in this region.
In this dissertation we hope to contribute to the set of studies on the determinants of tax revenues in Africa. To achieve our objective, we obtained yearly unbalanced panel data from 1997 to 2016. We excluded countries and years with missing dependent variable observations. Considering the fact that the diagnostic test for the residual of the