Do Portuguese mutual funds display forecasting skills?
A study of selectivity and market timing ability
Nuno Neto
[email protected]Master Dissertation in Finance
Supervisor
Professor Júlio Fernando Seara Sequeira da Mota Lobão
ii
Biography
Nuno Manuel Veloso Neto was born in Vila Nova de Famalicão in 1986. In 2004 initiated a degree in Business Management at University of Minho which he concluded in 2008.
As part of his professional ambitions, in 2009 he initiated an international professional experience in Poland as Fixed Income Data Analyst at Thomson Reuters. The permanent interest to enhance the knowledge of capital markets led him to pursue a Master in Finance in 2011 at School of Economics and Management, University of Porto.
Currently he works in London at Thomson Reuters, as a Fixed Income Market Development for Middle East, Africa and Russia/CIS.
iii
Acknowledgements
The completion of this dissertation ends an important chapter of my academic path. However, I wouldn’t have been able to accomplish it without the input and contribution of several people to which I would like to express some words of gratitude.
Firstly, I would like to express my sincerest gratitude to my supervisor, Professor Júlio Lobão. Initially, for his help and enthusiasm in defining the object of study and, foremost, for the vital support, recommendations and guidance to enhance the dissertation.
I also would like to thank Mr. Sérgio Brito from APFIPP for the prompt availability to provide indispensable data for the empirical research.
I thank my friends Abel and Pedro, for sharing their experiences, their valuable insight and constant support.
Last but not least, I would like to specially thank my parents, brother and grandmother for their unconditional support and encouragement throughout my research. A special thanks to my fiancé for her daily support, patience and love.
iv
Abstract
This study extends the international empirical research of selectivity and market timing by evaluating the performance of 51 Portuguese mutual funds from June 2002 until March 2012. The estimation of the sample performance is measured by applying Jensen’s (1968), Treynor and Mazuy’s (1966) and Henriksson and Merton’s (1981) models. Besides applying the unconditional version of the aforementioned models, we use European informational variables to estimate the conditional version of Treynor and Mazuy’s (1966) and Henriksson and Merton’s (1981) market timing models.
The results suggest that the Portuguese mutual funds in general do not possess selectivity nor timing skills. These components of performance present high negative correlation meaning that fund managers are not capable of identifying underpriced stocks and time the market simultaneously. However, regardless the model used, the domestic equity funds exhibit market timing ability, which is consistent with the distance effect. Funds investing locally present higher timing capabilities. Furthermore, the observable fund’s characteristics and market cycles were used to try to predict their performance. We found some evidence that older funds are better stock pickers than younger funds while size effect seems not to play a clear role on the performance results. The market cycles present a stronger relationship with performance components as a sample of funds managed to time the market during bear markets and to select underpriced stocks during bull markets.
Keywords: Portuguese Mutual Funds, Performance Evaluation, Selectivity, Market
v
Contents
Biography ... ii Acknowledgements ... iii Abstract ... iv Contents ... vIndex of figures ... vii
Index of tables ... viii
Index of appendices ... ix
Abbreviations ... x
1. Introduction ... 1
2. Literature review ... 5
2.1. Performance measurement ... 5
2.2. The decomposition of performance: selectivity and timing ... 6
2.3. Methodologies and empirical evidence ... 7
2.3.1. Risk adjusted measures ... 7
2.3.2. Nonparametric tests ... 11
2.3.3. Conditional models ... 12
3. Portuguese capital markets ... 14
vi
3.2. The mutual funds industry ... 17
4. Methodology ... 21
4.1. Measure of global performance ... 21
4.2. Measure of selectivity and timing ... 22
4.3. Conditional models selectivity and timing ... 25
5. Data sample analysis ... 27
5.1. Data description ... 27
5.2. Benchmarks ... 30
5.3. Conditional variables ... 33
5.4. Robustness tests ... 34
6. Empirical research results ... 36
6.1. Unconditional models ... 36
6.2. Conditional models ... 43
6.2.1. ‘Deep dive’ analysis ... 49
7. Conclusion and recommendations for further research ... 57
Appendices ... 61
vii
Index of figures
Figure 1 – Equity indices performance ... 15
Figure 2 – Debt market: 10Y benchmarks ... 17
Figure 3 – Evolution of assets under management ... 18
Figure 4 – Nº of mutual funds by category ... 19
viii
Index of tables
Table 1 – GDP annual growth rate ... 15
Table 2 – Fund sample features ... 28
Table 3 – Number of active and liquidated funds from 2002 until 2012 ... 30
Table 4 – Informational variables statistics summary ... 34
Table 5 – Performance measure through Jensen´s (1968) model ... 37
Table 6 – Measure of selectivity and timing using TM model ... 39
Table 7 – Measure of selectivity and timing using HM model ... 41
Table 8 – Regressions of the benchmarks excess returns on lagged informational variables ... 45
Table 9 – Measure of selectivity and timing using unconditional and conditional TM model ... 46
Table 10 – Measure of selectivity and timing using unconditional and conditional HM model ... 48
Table 11 – Market cycles from 2002 to 2012 ... 52
Table 12 – Measure of selectivity and timing by the conditional version of TM model with break down by funds’ characteristics ... 55
Table 13 - Measure of selectivity and timing by the conditional version of HM model with break down by funds’ characteristics ... 56
ix
Index of appendices
Appendix 1 – Mutual funds sample ... 61
Appendix 2 – Fund sample features ... 63
Appendix 3 – Descriptive statistics ... 65
Appendix 4 – ADF test (Augmented Dickey Fuller) ... 70
Appendix 5 – Regressions of the benchmarks excess returns on lagged informational variables ... 71
x
Abbreviations
ADF – Augmented Dickey Fuller
APFIPP – Portuguese Association of Investment Funds, Pension Funds and Asset Management
CAPM – Capital Asset Pricing Model
CMVM – Portuguese Securities Market Commission CWM – Conditional Weight Measure
EMH – Efficient Market Hypothesis EMU – European Monetary Union EU – European Union
EURIBOR – Euro Interbank Offered Rate FED – Federal Reserve System
HM – Henriksson and Merton (1981)
MSCI – Morgan Stanley Capital International OLS – Ordinary least-squares
PSI 20 – Portuguese Stock Index 20 TIB –Technical Indicator Benchmark TM – Treynor and Mazuy (1966)
1
1. Introduction
The performance and strategy of mutual funds is probably one of the most interesting topics in Finance and has always been discussed by both academics and practitioners. Active versus passive investment management has generated countless discussions about which one generates superior returns, being still an open question. The active management strategy of investing aims to obtain abnormal returns, beating the index to which it relates by selecting stocks and anticipating changes in the market conditions. The performance evaluation has progressed significantly since the first measures of performance developed by Treynor (1965), Sharpe (1966) and Jensen (1968) with “risk adjusted indicators”. According to Fama (1972) performance measurement can be divided in two components: microforecasting (selectivity ability) and macroforecasting (market timing ability). Market timing refers to a strategy of trying to anticipate future market movements by adjusting funds’ portfolio between risky and riskless assets. On the other hand selectivity refers to picking stocks undervalued that anticipate favourable price movements relative to stocks in general.
The majority of empirical research clearly states that in general fund managers performed poorly when compared to the market and do not possess either stock picking or timing skills. More recently an extension of those studies was created to address the importance of public information available on the performance measurement. Informational variables such as the dividend yield and interest rates permit expected returns and systematic risk to be time-varying thus allowing for a better assessment of performance based on public information.
In April 2014, the total assets managed by European investment funds ascended to
10,191.2 billion1 euros whereas the Portuguese represented only 0.2% with 25.4 billion
1 APFIPP – Informative note June 2014
http://www.apfipp.pt/backoffice/box/userfiles/file/Nota%20informativa%20FIM%20-%20Junho%202014.pdf
2
euros. The Portuguese mutual funds industry is relatively recent when compared to its peers however the number of funds has increased 24% in the last decade (from 221 to 273). In April 2014, the total assets managed by Portuguese mutual funds were 13.4 billion euros.
The existing literature about Portuguese evidence of selectivity and market timing is in line with international findings. The studies of Romacho and Cortez (2006), Oliveira (2010), Afonso (2010), Govan (2011) and Calé (2011) showed no positive timing or selectivity abilities moreover there was even evidence of some perverse timing. Additionally, results show a strong negative correlation between these two components of performance.
Despite the overall evidence of poor performance, the aim of this study is to contribute to the current literature with an extended and enhanced version of previous studies. Besides the traditional models (unconditional) to test market timing and selectivity skills, the conditional version of those models was also incorporated in this study to address the importance of public information on funds’ performance.
A framework rarely studied by the existing literature is the relationship of funds’ characteristics with the selectivity and timing skills. This approach can provide valuable insight on the overall results analysis therefore the funds’ characteristics age, size and market cycles were added to the study. The incorporation of these variables improves the quality and robustness of our findings and differentiates this study from the current literature.
According to Jiang (2003), older funds outperform, on average, younger funds. Regarding size, smaller funds seem to perform better than their larger funds.
The subperiod analysis is commonly introduced in few studies such as Ferson and Schadt (1996) and Leite and Cortez (2006) to assess the selectivity and timing capacities are time varying. However those analysis haven’t considered specifically the impact of different market cycles (bear and bull markets) on the overall performance.
3
Using the additional funds’ characteristics we aim to answer the following questions: Do mutual funds anticipate market movements?
Do mutual funds possess stock picking skills? Does experience matter?
Do small mutual funds fare better?
Do mutual funds anticipate market cycles?
In this study the performance of a sample of 51 Portuguese mutual funds are analysed from June 2002 until March of 2012. The sample of funds combines 5 categories of funds: 1 – Domestic equity funds; 2 – EU, Switzerland and Norway equity funds; 3 – North American equity funds; 4 – Other International equity funds and 5 – Sector equity funds. For this study several performance measures were implemented, unconditional and conditional versions. In a first phase the global performance of funds is measured by applying Jensen’s (1968) model. In order to segregate the selectivity and timing ability both Treynor and Mazuy (1966) and Henriksson and Merton (1981) unconditional models were applied. Due to the importance of public information on the performance evaluation, this study provides some insights on the impact of using conditioning information by applying the conditional version of both models.
This study addresses the possible impact of survivorship bias on the overall results by analysing the universe of liquidated funds on a yearly basis which represents On average only 2% of total funds. Therefore the impact on the performance estimates is reduced. Additionally, the robustness of the data used is also tested, to prevent spurious regressions. Thus we tested stationarity, homoscedasticity and autocorrelation.
This study is organised in seven chapters using the following structure: Section 2 revises the literature of the subject covered, together with the respective evaluation models developed. Section 3 describes briefly the Portuguese capital market for the last decade with particular focus on the mutual funds industry. In section 4 the different
4
methodologies applied in this study are presented, while some of them will be analysed on unconditional and conditional context. Section 5 covers the specifics of the data set used, the benchmark selection method and the robustness tests applied to our data. In section 6 the empirical results are presented and discussed. The results are presented on a basis of unconditional and conditional measures of performance. Additional features such as funds’ age, size and market cycles are also covered to analyse the stock returns
predictability based on those characteristics. Finally, the 7th section ends the study with
5
2. Literature review
2.1. Performance measurement
During the last decades numerous studies were undertaken on measuring funds’ performance. Active versus passive management is one of the most debatable subjects on the investment management matter.
According to the EMH proposed by Fama (1965) the markets are informational efficient therefore investors cannot consistently achieve excess returns over the market. An active market includes well informed and rational investors, therefore the prices will reflect all available information.
If markets are indeed perfectly efficient, why would fund managers spend resources to try constantly beat the market? The debate about EMH has resulted in a wide range of research and empirical studies measuring fund managers performance to determinate whether they outperform the benchmark portfolio.
The early and traditional measures of performance go back to Treynor (1965), Sharpe (1966) and Jensen (1968). Treynor (1965) was the first to present a performance measure so called “risk adjusted indicator” or “reward-to-volatility ratio” that combines return and risk by measuring returns to a measure of risk (Beta). Treynor (1965) measures the portfolio’s return by the systematic risk unit assumed by the investors. Similar to Treynor´s measure, Sharpe’s (1966) measure is also a “risk adjusted indicator” or “reward-to-volatility” however the author uses the standard deviation as a measure of risk. By applying a measure of volatility (standard deviation) the author shows to which degree of risk the portfolio is exposed.
6
Jensen’s (1968) measure is a direct application of the CAPM that measures the ability of an investor to predict future security prices thus obtaining above market returns. This measure is also known as Jensen’s Alpha:
“…it represents the average incremental rate of return on the portfolio per unit
of time which is due solely to the manager’s ability to forecast future security prices.” Jensen (1968), pp. 394
Based on the proposed measure, Jensen (1968) has applied his model to a sample of U.S. funds. Based on a sample of 115 funds between 1945 and 1964 the author concluded that fund managers had no ability to present excess returns above a passive (buy-and-hold) investment strategy.
The above performance measures present a serious limitation due to the assumption of stationary risk levels over time and therefore, focusing only on the manager’s security selection skills. Such assumption neglects the possibility of managers adjusting the portfolios risk levels as an anticipation of markets movements. Therefore, based on the above context the researchers developed new models to segregate the measure of performance in two components: selectivity and timing. The mentioned components are addressed in the following chapters.
2.2. The decomposition of performance: selectivity and timing
The active management strategy of investing aims to obtain abnormal returns by beating the index to which it relates. Forecasting skills are part of active investment and according to Fama (1972) can be divided in two components: microforecasting and macroforecasting. Microforecasting consists in price movements forecasts of individual stocks relative to stocks in general. This component can also be classified as security analysis or selectivity ability. The other component is macroforecasting that relates to forecasting price movements of general stock markets against fixed income securities. The latter is referred as market timing ability.
7
2.3. Methodologies and empirical evidence
As part of literature review we will provide an overview of the main methodologies that have been developed throughout the years to measure selectivity and timing skills and the main results from the respective methods.
2.3.1. Risk adjusted measures
Treynor and Mazuy (1966)
Following the CAPM approach, Treynor and Mazuy (1966) (hereafter TM) were the first to develop a model to separate market timing from selectivity ability. The authors defend that if the fund’s manager can anticipate market movements then he should hold a greater portion of market portfolio when the market returns are expected to rise and decrease when the market is expected to decline.
For the period of 1953 to 1962, the authors concluded that funds managers had no market timing skills. Out of 57 mutual funds only 1 displayed market timing ability.
“This is not to say that a skilful fund management cannot provide the investor
with a rate of return that is higher in both bad times and good than the return provided by the market averages, but it does suggest that the improvement in the rate of return will be due to the fund manager’s ability to identify underpriced industries and companies, rather than to any ability to outguess turns in level of the market as a whole.” (Treynor and Mazuy, 1966, p. 6)
Similar results were obtained in the following years by several authors while applying the same methodology in different markets. Nassir et al (1997) with a sample of Malaysian unit trusts, Nikolaos (2002) with a sample of Greek mutual funds, Drew et al (2005) analysed Australian mutual funds, Tripathy (2005) analysed Indian mutual funds, Kader and Qing (2007) analysed Hong Kong mutual funds, Casaccia (2009)
8
Brazilian mutual funds and Murhadi (2010) Indonesian mutual funds. All the mentioned authors found no evidence of market timing.
However, Bello and Janjigian (1997) obtained different results while using an extended version of TM’s model that controls to include non-S&P500 assets in the mutual funds portfolios. The authors studied the timing and selectivity abilities of US domestic equity funds and found evidences of positive and significant market timing abilities in contrast with negative market timing results from the original TM model. The security selection skills are equally positive and significant.
Similar results were also obtained by Bollen and Busse (2001) for U.S. and Kaur (2013) for India while testing market timing and selectivity ability by using daily data. The authors found positive persistent market timing ability.
Henriksson and Merton (1981)
In 1972, Fama proposed a methodology to analyse the market timing paradigm although the methodology used the CAPM as main model thus could not be tested empirically. To overcome this problem, Merton (1981) developed a basic model and analysed a theoretical structure to assess the managers timing ability. It was assumed that the market timer’s forecasts would be that either stocks would outperform bonds or vice-versa. Henriksson and Merton (1981) (hereafter HM) proposed a model that allows distinguishing managers’ timing and selectivity skills proposing both a parametric and a nonparametric test to investigate the market timing abilities.
The usefulness of the nonparametric test is quite questionable as it requires the forecaster predictions to be observed. As this information is rarely available, such procedure is difficult to test empirically. On the other hand, the parametric test is created under the assumption that the assets are evaluated in accordance with the CAPM model. The authors assume that managers can choose between two targets levels of systematic risk: η1 when he predicts Rm,t ≤ Rf,t and η2 when he predicts Rm,t > Rf,t. If the manager is rational, the condition η1 < η2 has to be verified, as the risk assumed for
9
a bear market (Rm,t ≤ Rf,t) has to be less than in the bull market (Rm,t > Rf,t). Since the managers’ forecasts are not observable, the beta of the portfolio at time t (βt) should be a random variable for a market timer, assuming a value η1 or η2 depending on whether the manager forecasts a down-market or an up-market.
Based on the above model, Henriksson (1984) performed an empirical study applied to the American market between 1968 and 1980, with a sample of 116 mutual funds. The results obtained supported the hypothesis that fund managers are not able to apply a market timing strategy.
Similar results were obtained in several studies while applying the same model such as Chang and Lewellen (1984), Rao (2000), Romacho (2004), Wah and Ghazali (2005) and Oliveira (2010).
Chang and Lewellen (1984) analysed 67 mutual funds from 1971 to 1979 while Rao (2000) analysed 570 U.S. mutual funds from 1987 to 1996 whereas only four at 1% of significance level display selectivity skills. The study suggests that mutual funds managers do not possess good market timing ability during a 10 year bull market. Both Romacho (2004) and Oliveira (2010) performed similar research on the Portuguese market from 1996 to 2001 and 2002 to 2009, respectively. No market timing skills were found in both studies, however Oliveira (2010) concludes that fund managers have little ability of selection (0.42%/year). In both studies a high negative correlation between the two components of performance is registered, meaning that fund managers are not capable of identifying underpriced stocks and time the market simultaneously. According to Henriksson (1984), the negative correlation between the two components can be either a possible misspecification of the benchmark portfolio and/or due to the omission of relevant factors.
Both TM and HM methodologies became market references while measuring market timing and selectivity ability of funds. Therefore, through the years most of the empirical research has been done by applying both models.
10
The studies are widespread in terms of markets covered. Nikolaos (2002) analysed 19 Greek mutual funds while Drew et al (2005) analysed 134 Australian mutual funds, Tripathy (2005) 31 Indian mutual funds, Casaccia (2009) 106 Brazilian mutual funds and Murhadi (2010) 55 Indonesian mutual funds. The results are in the same line of TM and HM findings. Silva and Silva (2010) performed a wider research by aggregating 14 markets and covering 9,929 funds from 1998 to 2007 nonetheless the number of markets covered, the results display weak market timing ability. The authors conclude that 2% of the funds seem to adopt a defensive strategy during bear markets while 22% increase their aggressiveness during such periods.
Govan (2011) and Calé (2011) performed similar studies in the Portuguese market and the results were in line with previous results that found no evidences of market timing or selectivity ability.
Most of the empirical studies on market timing show little or negative timing ability although those results should be considered with cautious due to data limitations (frequency). Bollen and Busse (2001) based on TM and HM model studied the timing ability using daily, weekly and monthly data for 230 US mutual funds. The results proved that there is a higher timing ability while using higher frequency data (daily). Moreover the persistence of market timing ability is statistically significant.
Chen (2006) and Chen and Liang (2006) replicated the study of TM and HM to a different class of funds: hedge funds. The authors found evidence of timing ability that seems quite significant in bear and volatile markets.
Chu (2007) and Wibowo (2009) found evidence of market timing ability as well, in aggregate analysis of 77 Hong Kong and 28 Indonesian mutual funds respectively.
Pfleiderer and Bhattacharya (1983)
Following the models developed by TM and HM, Pfleiderer and Bhattacharya (1983) presented an enhancement of TM model with a simple regression focusing on excess market return as an indication of timing skill. In this model, managers that have access
11
to specific information may be able to time the market therefore presenting excess market returns. This model requires only the returns earned on the fund and those earned on the market portfolio. Based on this model, several authors have performed empirical studies to assess the market timing ability: Lee and Rahman (1990) in the US, Armada (1992) in the UK and Armada and Cortez (1997) in Portugal. Even though some of these studies revealed some timing and selectivity ability, the results were constrained to be non-negative. Taking in consideration the non-negativity issue, Coggin et al (1993) allowed the model to obtain both positive and negative timing while applying this methodology to the US market. With such modification the results showed negative timing which was consistent with previous studies.
Imisiker (2004) and Imisiker and Ozlale (2008) applied the same methodology to a sample of 49 Turkish mutual funds during 2000 to 2003, however, using a shorter data frequency by employing weekly date. The authors found evidences of superior market timing ability and weak selection skills.
2.3.2. Nonparametric tests
More recently, Jiang (2003) developed a nonparametric test without the need to estimate α’s and β’s. The test which is considered to be complementary of TM and HM models is formed to proxy the probability that the manager will adjust the funds’ portfolio with market exposure when the market return soars. The author observes the probability that beta is higher in up markets than in down markets.
The nonparametric test requires only post returns and funds benchmarks. It is not affected by manager’s risk aversion as separates quality of timing information from the aggressiveness of the reaction and it’s more robust to different information, incentive structure, timing frequencies and underlying distributions.
Jiang (2003) found no evidence of timing ability in a sample of 1827 US domestic funds during 1980 to 1999.
12
Cuthbertson et al (2010) in recent study applied the nonparametric methodology of Jiang (2003) in the UK market to test the market timing ability however controlling for publicly available information (conditional approach). Similar to most of the literature, they found very weak evidence of positive timing ability as only 1% of the funds demonstrated timing skills. On the other hand, 19% of the funds revealed negative timing and on average funds mistime the market.
Similar results were found by Hayat and Kraeussl (2011) while studying the risk and return of Islamic Equity Funds (IEFs). IEFs differ from conventional mutual funds on their investment approach nevertheless while studying a sample of 145 IEFs over the period 2000 to 2009 the authors confirmed that IEFs are underperformers and bad market timers.
2.3.3. Conditional models
The importance of public information while predicting both stock and bond returns have been underlined initially by Fama and French (1989), Ilmanen (1995), Pesaran and Timmermann (1995). Some public information variables, such as dividend yield and interest rates can be used to assess the state of economy consequently use this public information to adjust predictions on future returns.
The traditional methods presented previously do not consider aspects related to public information available thus do not consider the possibility that systematic risk and expected return may vary over time.
In order to address the impact of public information on the performance measurement, Farnsworth (1997) developed a conditional model whereas both expected returns and systematic risk vary over depending on the public information.
The initial empirical research was done by Ferson and Schadt (1996) and concluded that conditional models provide an improvement on the model specification and mutual fund
13
estimates although displaying no timing ability. Similar results were also found by Schill et al (1999) while studying a sample of 400 US mutual funds finding little evidence of market timing ability.
Leite and Cortez (2006) and more recently Afonso (2010) applied the conditional models to the Portuguese market. The results are in line with the previous studies. The authors demonstrate that by using conditional models they observe a slight improvement in the mutual fund performance estimates and in the explanatory power of the models. Moreover, Leite and Cortez (2006) confirm that mutual fund managers do not possess timing ability, exhibiting negative or neutral performance. Additionally, the authors suggest that there is existence of distance effect, since managers who invest locally appear to outperform those investing globally.
Similar results were found by Afonso (2010) by analysing 33 Portuguese equity funds regardless the model applied.
In this chapter we covered the main methodologies to measure the selectivity and timing skills. The general evidence shows that regardless of the market studied the existence of timing and selectivity ability is rarely observed. The introduction of public information variables on unconditional models shows that those variables are statistically significant and provide an improvement on the mutual fund performance estimates and on the explanatory power of the models.
14
3. Portuguese capital markets
The aim of this chapter is to provide a brief overview of the Portuguese capital markets as an introduction to a more comprehensive analysis of the mutual funds industry in Portugal. The global and domestic economic conjunctures play a crucial role on the performance of the capital markets and its attractiveness to capture investment.
In order to gain a better understanding of the mutual funds industry and its development, it becomes pertinent to cover the major events in the financial markets during the period of analysis (June 2002 to March 2012). Such examination will support the ultimate analysis on size of the mutual fund sector and the evolution of assets under management.
3.1. Overview
As aforementioned there have been several events that impacted significantly the
performance of the most followed equity indices. The beginning of the 21st century was
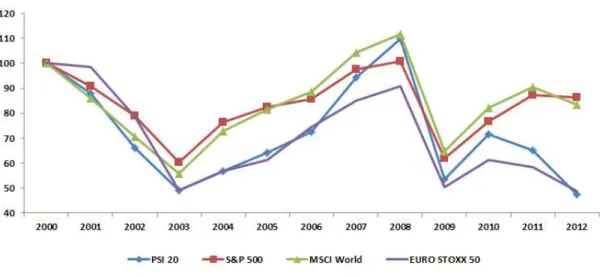
marked by the irrational exuberance of investors towards the information technology companies leading to dot-com bubble. As consequence to this event the major equity indices such as S&P 500, MSCI World and Euro STOXX 50 collapsed sharply. By the year of 2003 most of the indices had lost 40% to 50% of their value from previous highs as displayed in the Figure 1 below.
After the burst of dot-com bubble the United States were trying to avoid going into recession thus Federal Reserve System (Fed) changed the interest rates to historical lows (1%) leading to economy expansion. Its peer in Europe (European Central Bank) followed similar strategy lowering the interest rates to 2%.
The economies that we considered United States, European Union and Portugal recorded a significant growth until 2007. United States and European Union presented a
15
GDP annual average growth of 2.9% and 2.8% respectively while Portugal due to a slower consumption recovery recorded an average of 1.5%. (Table 1)
Figure 1 – Equity indices performance
Source: Thomson Reuters
Table 1 – GDP annual growth rate
This table presents the percentage of GDP annual growth from 2002 to 2012 for the following economies: European Union, Portugal, United States of America and Global.
Source: World Bank
The economic recovery was followed by the stock markets that registered a recover from the bear markets with an annual average growth above 10%. As displayed in the Figure 1 apart from Euro STOXX all the remaining indices reached or surpassed the levels previous to dot-com bubble burst.
16
The low interest rates in the United Stated led to economic expansion as both individuals and businesses could easily borrow money. This situation created great credit conditions during few years and proved to be a catalyst of subprime crisis. In 2007 the high risk mortgages caused massive defaults triggering major collapses within financial institutions in the following year.
The subprime crisis quickly spread worldwide distressing the financial markets globally. The major impact came in from 2008 to 2009 with the aforenamed indices registering drops above 38%. The Portuguese stock index (PSI 20) was significantly affected falling 51% from previous highs.
The year of 2010 was considered to be a breaking point to most of the economies coming back to economic growth (Table 1) thus the equity indices climbed between 21% (Euro STOXX 50) and 33% (PSI 20). Regardless the market expansion in 2010 there were signs of financial imbalance and economic fragilities in some countries. A combination of lack of competitiveness and growth with debt crisis in Europe led to the ongoing Eurozone debt crisis.
In May 2010 the Greek government secured one of its first bailout programs to sustain the government debt crisis. By the end of 2010 the Portuguese unemployment rate was
at 10.8%2, there was a significant contraction of internal and external consumption, the
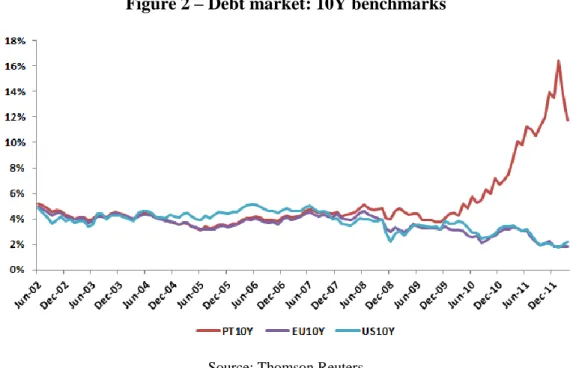
public debt rose from 70% of GDP in 2007 to above 90% in 20103, budget deficit was
9.1%, and the cost of issuing government debt (10 years) was close to the 7% hurdle (Figure 2).
2 The Portuguese Economy in 2011 – Bank of Portugal bulletin
3 Portuguese economy ensuring stability to support sustained growth.
http://www.bportugal.pt/pt-PT/OBancoeoEurosistema/IntervencoesPublicas/Lists/FolderDeListaComLinks/Attachments/153/intervp ub20120509.pdf
17
Figure 2 – Debt market: 10Y benchmarks
Source: Thomson Reuters
The growing risk of default and failure to issue government debt at sustainable interest rates motivated the Portuguese bailout request to secure government funding and provide capital to the domestic banks.
3.2. The mutual funds industry
The Portuguese mutual funds industry is relatively recent when compared to other most developed markets in Europe or to United States. The first fund was launched in 1964 although in 1975 due to the banking sector nationalization the capital markets activity was interrupted. The investment funds activity resumed in 1986 with the appearance of
a new fund named INVEST4. According to CMVM, 4 new funds were launched in the
following year and since then have recorded a fast growth and increasing magnitude. The investment funds sector can be segregated into mutual funds and real estate funds. According to APFIPP’s (Portuguese Association of Investment Funds, Pension Funds
18
and Asset Management) classification system there are 45 different categories of funds5.
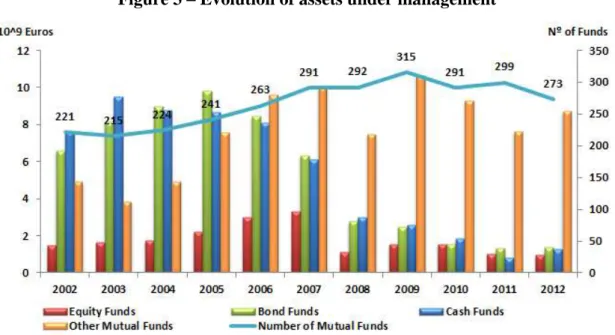
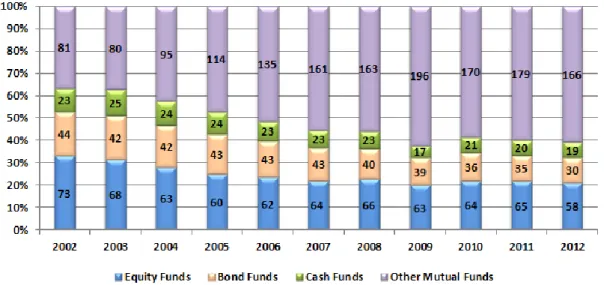
In terms of mutual funds we can divide them into 4 main categories according to their investment strategies: equity funds, bond funds, cash funds and other mutual funds. From 2002 to 2012 we have seen a significant change in the nature and size of Portuguese mutual funds. The number of active funds increased 24% in the mentioned period, from 221 to 273 as of 2012. Additionally, it’s important to highlight that the prominence of each category changed over time as displayed in the figure 3.
Figure 3 – Evolution of assets under management
Source: APFIPP - Annual reports from 2002-2012
The weight of each category shifted significantly from equity oriented to a more diverse range of categories/strategies. As of 2002 the equity funds represented 33% of the total investment in mutual funds while bond funds, cash funds and other mutual funds represented 20%, 10% and 37% respectively. Throughout the years these weights changed considerably as the number of other mutual funds rose 66% accounting 61% of
5
APFIPP Classification System –
19
the total number of mutual funds in 2012. The remaining categories equity funds, bond funds, cash funds represented then 21%, 11% and 7% of the total number of funds as shown in the figure 4.
Figure 4 – Nº of mutual funds by category
Source: APFIPP - Annual reports from 2002-2012
The economic and capital markets conjunctures play a key role in the investment attractiveness and in the amount of assets under management. The mentioned events in the overview chapter are expectable to have a significant impact on the value of assets under management. Based on the different business cycles (expansion and recession) there is a shift from riskier to risk free assets.
The Portuguese stock index registered a bull market from end of 2002 until mid of
20076 which led to an increase of 41% of assets under management (2006). With the
subprime crisis emerging the value of assets under management decreased significantly and a significant amount of capital was transferred to risk free assets such as bank deposits.
20
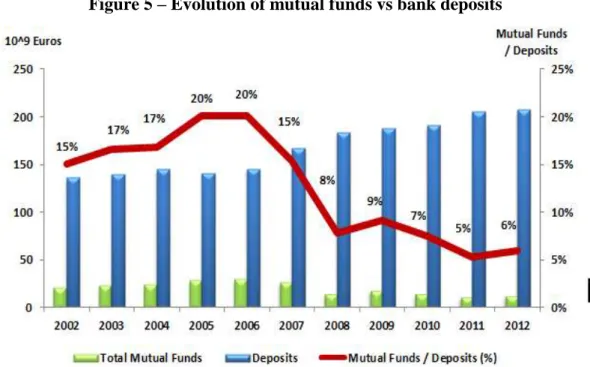
In the figure 5 it’s visible that the total value of mutual funds when compared to bank
deposits represented only 8% of its value, while during the bull market was 20%. The year of 2009 displayed a slight improvement nevertheless the Eurozone debt crisis had a huge impact on the performance of the Portuguese equity index with a loss of 54% of its value in the following years. As results of assets devaluation together with capital migration to riskless assets by 2012 the amount under management was 12,295 million of euros comparing to 207,500 million of euros in bank deposits.
Figure 5 – Evolution of mutual funds vs bank deposits
21
4. Methodology
In this chapter we will address the models that are applied to test empirically the performance of a sample of Portuguese mutual funds. The measurement of overall performance is based on Jensen’s (1968) methodology. The selectivity and timing ability analysis is measured based on TM and HM models.
The importance of accounting public information while predicting stock returns have been highly emphasized, consequently, a conditional version of TM and HM are also presented to improve the explanatory capacity of these models.
The aim of presenting several models to test selectivity and timing is to validate the robustness of the results.
4.1. Measure of global performance
Jensen’s (1968) measure of global performance takes in consideration not only the overall return of a portfolio but also the inherent risk.
Following the market equilibrium model (CAPM), the average return of a portfolio is the return of the market adjusted to its systematic risk. However the author assumes that due to market frictions or anomalies of the market a certain security may be under or overvalued on a certain period of time. Based on this assumption the author adds a parameter (α) to the CAPM regression to measure the excess return above the market return as result of selectivity ability (identifying underpriced assets). Jensen’s (1968) model is calculated by the following expression:
22
– Excess return of portfolio p over the period t
– Jensen’s alpha
– Systematic risk as an estimated sensitivity to market portfolio
– Excess return of market portfolio p over the period t – Residual variable
4.2. Measure of selectivity and timing
Treynor and Mazuy (1966)
The authors argue that if the funds’ managers exhibit timing ability they would be able to anticipate market returns successfully thus adjusting their portfolios accordingly. In an event of market decline (rise) the fund managers should manage the portfolio by switching from more to less (less to more) volatile securities. Meaning, reducing (increasing) the portfolio’s beta which can be considered the main hedging instrument of a portfolio.
Based on such assumption the authors developed a method based on a regression analysis that includes a quadratic term to the CAPM model. Therefore, the portfolio return is a nonlinear function of market return specified as:
where is the excess return of portfolio p in the period t; is the excess return of
market index in the period t; is Jensen’s alpha and represents the selectivity ability; is the systematic risk as an estimated sensitivity to market portfolio; γ is the measure of
market timing and it’s a residual variable.
A positive gamma (γ) represents a positive market timing ability while 0 indicates no ability and a negative gamma indicates negative timing skills.
23
Henriksson and Merton (1981)
The second model applied in this study is the HM approach which comes from Merton (1981) theoretical structure of the pattern returns from successful timing strategy. Merton (1981) then derived an equilibrium theory for market timing forecasting skills following the returns pattern of a protective put option strategy. The author assumes that there are only two possible predictions whereas either stocks will outperform bonds or bonds will outperform the stocks.
Based on the model mentioned above Henriksson and Merton developed statistical procedures, parametric and nonparametric, to test market timing and selectivity abilities of investment managers.
The nonparametric test is based on a forecast model that can be described in terms of conditional probabilities of accurate or inaccurate forecast. The investment manager
forecast will be that either stocks outperform bonds or bonds will
outperform stocks and it’s represented by the variable . The market
timer’s forecast variable will be = 1 if the forecast made in the period t –1 for the
period t is (bull market), and = 0 if the forecast made in the period t –1
for the period t is (bear market). The conditional probabilities of an accurate
forecast are:
It’s assumed that the conditional probability (P1,t and P2,t) is not dependent on the
magnitude of the performance ( | | ) but only on whether or not .
Unlike other studies, such model allows to study the market timing subject without using the CAPM framework.
24
The viability of the nonparametric test described above requires observable manager’s forecasts which are hardly available. Therefore to test the market timing ability the authors had to make additional assumptions about the equilibrium structure theory. To overcome the absence of observable manager’s forecasts, HM developed a parametric test assuming the CAPM framework and using a proxy for the unavailable forecasts. The authors assume as a function of forecast the different levels of systematic risk for the portfolio chosen by the forecaster.
Based on the above it’s assumed that there are two targets of risk level that depends on whether the investment managers predicts that the market portfolio return will exceed
the riskless securities return. Thus η1 denotes the target beta ( ) when investment
manager forecasts ; and η2 when investment manager forecasts .
The target beta (βt) will assume the η1 value on a bear market and η2 value on a bull market. On a rational market, the investment manager forecast shall be η2 > η1.
Since beta is not observable, ( ) will be a random variable that will assume the value
of η1 or η2 depending on the investment manager’s expectations of a bear or bull market. The return of portfolio in the period t is represented as:
where, = unconditional expected value of ; = – , representing the
unanticipated expected value of depending on the forecast value; = – ;
represents the excess return from selectivity; it’s a residual variable with such
characteristics: E( ) = 0; E( , ) = 0; E( , ) .
Following the suggested return process (4.5), a least-square regression analysis is used to identify and measure the contribution of both timing and selectivity components individually:
25
where,
As mentioned previously, the returns from a timing strategy would be similar to a protective put option strategy. The previous equation shows that α measures the
contribution of selectivity ability to the portfolio performance, β1 represents the
proportion invested in the market portfolio while β2 expresses the number of put options
on the market due to the investment manager’s timing ability.
4.3. Conditional models selectivity and timing
The predictability of returns using predetermined public information has been widely discussed concluding that conditional models provide an improvement on the model specification and mutual fund estimates. The conditional approach was firstly brought by Farnsworth (1997) and supported by empirical evidences presented by Ferson and Schadt (1996) and Schill et al (1999).
As the public information changes over time the conditional models will allow estimating time-varying expected returns and risk (conditional betas).
Ferson and Schadt (1996) assuming the market efficiency in the semi-strong form7
modified the market timing models to incorporate the conditional information. The idea behind such model is to distinguish market timing based on public information from market timing that is superior to the public information. Meaning, “that a managed portfolio strategy that can be replicated using readily available public information should not be judged as having superior performance”. (Ferson and Schadt, 1996, pp. 426)
26
Ferson and Schadt (1996) modified the traditional market timing models (equations 4.2 and 4.6) by adding a vector of lagged public information. The conditioning information
is represented by three lagged8 variables: benchmark dividend yield (DY), short-term
interest rate level (EUR) and the slope of the term structure (TS).
TM – Conditional Model
HM – Conditional Model
Where, β´p represents the response of manager’s beta to the public information, ,
available at for predicting returns. The vector in the equations
(4.7) and (4.8) controls the public information effect. Thus in conditional models, “the correlation of mutual fund betas with the future market return, which can be attributed to the public information, is not considered to reflect market timing ability.” (Ferson and Schadt, 1996, pp. 435)
27
5. Data sample analysis
5.1. Data description
Based on APFIPP classification system there are 45 different categories9 although for
this study the following 5 categories of funds that invest in equity were selected. Equity funds tend to have more active strategies that include stock picking and timing the market therefore are more relevant for this study. The following categories will be considered:
I. Domestic equity funds
II. European Union, Switzerland and Norway equity funds
III. North American equity funds
IV. Sector equity funds
V. Other international equity funds
In the last decades the markets have become more internationalized and globalized thus increasing the range of investments. Due to this diversity it has been considered beneficial to extend the analysis from the domestic investment focused mutual funds to a wider scope.
The sample of funds used on this study comprises 51 Portuguese mutual funds (Appendix 1) with historical monthly returns from June 2002 to March 2012, corresponding to a total of 118 monthly observations per fund. Taking in consideration the statistical significance we considered only mutual funds with at least one third (39) of the total number of observations (118).
28
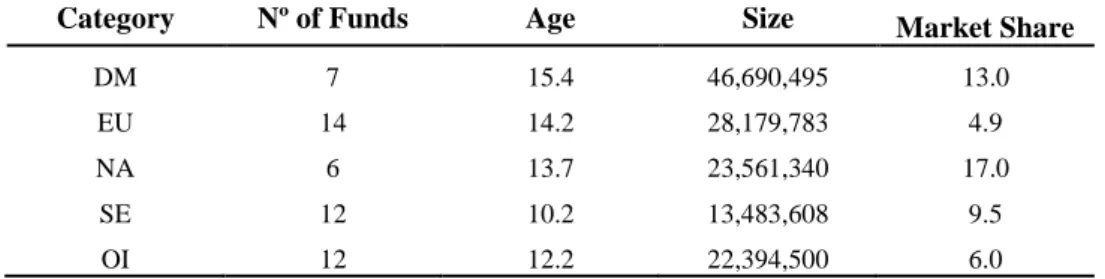
In table 2 it’s observed that the investment categories selected represent on average at
least 50% of the total universe of Portuguese funds during the period of analysis. Regarding the funds’ age, the domestic equity funds are on average the oldest funds in the sample (15 years of existence). Nevertheless, the age average of whole sample is 13 years which is in line with the comments in the chapter 3.2 stating that the Portuguese mutual fund industry is recent. The oldest fund is Postal Acções managed by
Caixagest10 with 26 years of existence. On the subject of size, similar to age, domestic
equity funds are on average the biggest of the equity funds with a size of 47 million euros. The significance of size on the domestic equity funds is mainly due to the contribution of Caixagest Acções Portugal (€ 86 million), Millennium Acções Portugal (€ 88 million) and Santander Acções Portugal (€ 103 million). Millennium Eurocarteira from the EU, Switzerland and Norway Equity Funds investment category is the biggest fund of the sample studied with an average of 150 million euros of net asset value.
Table 2 – Fund sample features
This table aggregates the funds characteristics age, size and market share categorized by its investment category (APFIPP). The average of the funds characteristics age, size and market share were calculated for the period of June 2002 to March 2012. Investment categories are: DM - Domestic equity funds; EU - EU, Switzerland and Norway equity funds; NA - North American equity funds; OI - Other Int. equity funds; SE - Sector equity funds.
Category Nº of Funds Age Size Market Share
DM 7 15.4 46,690,495 13.0
EU 14 14.2 28,179,783 4.9
NA 6 13.7 23,561,340 17.0
SE 12 10.2 13,483,608 9.5
OI 12 12.2 22,394,500 6.0
The market share is the average of weight of each fund in their specific investment category. It is interesting to mention that during the 10 year period of study only few funds managed to keep a considerable position in the market with a market shares above
29
25%11 (Appendix 2). The main descriptive statistics of each fund are represented in
Appendix 3.
One of the main aspects to take in consideration on aggregated mutual funds performance is the survivorship bias. The universe of funds analysed is subject to mergers and liquidations that do not survive to the whole period of analysis.
The survivorship bias was firstly analysed by Brown et al (1992) that argued that the funds that survive will have higher ex post returns than the ones that did not survived. Furthermore, it is expected that the survivorship bias effect is not significant. There are other studies such as Grinblatt and Titman (1989) and Goetzmann et al (2000) that support the same view. Grinblatt and Titman (1989) indicate that the survivorship account on average between 0.1% and 0.4% per year thus having a reduced impact on the analysis.
The survivorship bias concerning the Portuguese market has been studied by Romacho and Cortez (2006) concluding that during the sample period only 4.8% of funds were liquidated which could come down to 2.2% if the effect of mergers was excluded. Therefore the impact on the performance estimates would be minimum.
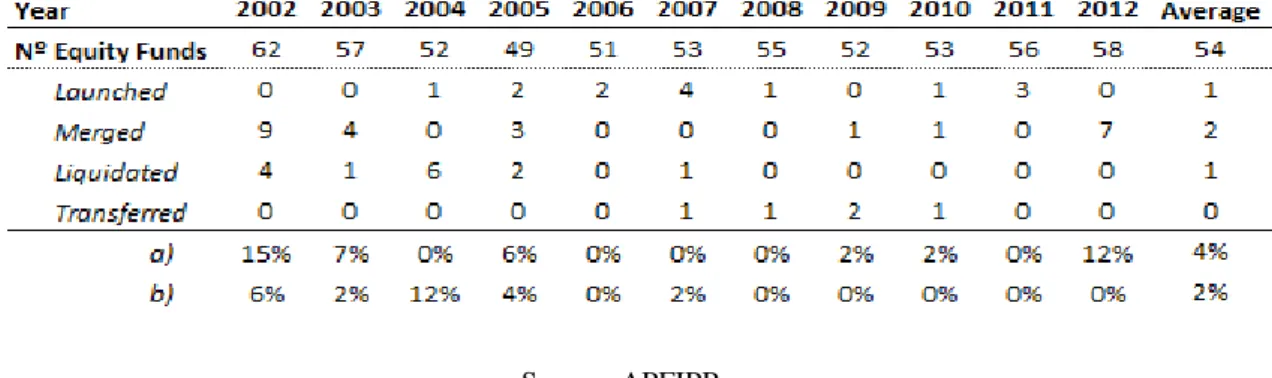
Regardless the general evidence of the limited impact of survivorship bias on the performance analysis, it’s still relevant to measure the universe of liquidated funds over
the period of analysis. The table 3 highlights the number of mergers and liquidated
funds in the 10 years of analysis. The results are consistent with previous studies
whereas the liquidated funds represent a small percentage12 of funds.
Our sample is subject to survivorship bias although, as mentioned above, the number of liquidated funds represents a small percentage of the total universe and therefore has a
11 Santander Acções Portugal: 29%; Millennium Eurocarteira: 26%; Caixagest Acções EUA: 31%;
Millennium Eurofinanceiras: 28%.
30
limited impact on our analysis. Nevertheless we may take in consideration that the aggregated results may be slightly upward biased by using only surviving timing funds.
Table 3 – Number of active and liquidated funds from 2002 until 2012 This table displays historical progress of active funds from 2002 until 2012. a) represents the percentage of merged funds per year while b) represents the percentage of liquidated funds per year.
Source: APFIPP
5.2. Benchmarks
There are several studies that suggest that superior portfolio managers consistently outperform the market although the persistence performance may be attributed to survivorship bias (Malkiel 1995) or benchmark selecting errors (Grinblatt and Titman 1989b).
The importance of selecting the appropriate benchmark portfolio has been reinforced by Grinblatt and Titman (1989b) and Elton et al (1996) therefore this was taken in consideration while selecting the most suitable equity indices.
In contrast to Romacho and Cortez’s (2006) approach that selected one benchmark per investment category, we decided to select one benchmark per fund to reduce the chance of having funds with a low fitted benchmark and low explanatory power.
The investment strategies used in the sample of our study are wide by aggregating five different mutual funds categories. The access to each portfolio’s holdings information is
31
very limited therefore we trusted on a better informed source, Lipper13, to select the
benchmark. Lipper products contain two different benchmark classifications: Fund
Manager Benchmark, which is self-selected by the fund’s manager, and Technical Indicator Benchmark (TIB), which is assigned by Lipper based on the fund’s
investment strategy and asset holdings.
For this study TIB was selected to avoid concerns regarding the conflict of interest of self-selecting a benchmark by the funds’ managers. Due to data access limitations whenever the TIB (monthly price values and dividend yields) were not available it was replaced by a competitor index with similar investment strategy.
Following Elton et al (1996) approach, an additional rule was implemented to eliminating certain funds whereas the selected benchmark had low explanatory power (Adjusted R-Square) on the selected period.
Therefore, a formula was developed to remove funds with low explanatory benchmarks. Only funds with a high adjusted R-Square were considered while applying the following formula:
where, represents the explanatory power of a benchmark used by the fund f,p;
represents the average of adjusted R-Square of each fund within the investment
category (c,p) and the standard deviation of adjusted R-Square within the investment
category (c,p).
Risk-Free Rate
In order to calculate the excess return of portfolio p in the period t (Rp,t) and the excess
return of market index in the period t (Rm,t) we used the risk-free rate proxied by the 1
13
Lipper, a Thomson Reuters company, is a global leader in supplying mutual fund information and fund ratings, fund analytical tools and fund commentary. www.lipperweb.com/
32
month Euro Interbank Offered Rate (EURIBOR) collected from Thomson Reuters
platform14. As the EURIBOR is an annual interest rate it’s required to calculate the
equivalent monthly rate. The proportionality calculations were performed as follows:
where, represents the risk-free rate of return and is the 1 month EURIBOR
rate.
Mutual Funds Returns
For the mutual funds returns calculations we have used the units’ price of funds obtained from CMVM. The sample funds selected for this study are capitalization funds therefore the dividends are reinvested and incorporated on the units’ price.
The monthly funds’ returns were calculated based on the following logarithmic expression:
where, is the monthly return of portfolio p in the period t, is the fund’s (p)
unit price in the period t, and is the fund’s (p) unit price in the preceding period
t-1.
Market Returns
The equity indices (benchmarks) assigned to each fund were used to calculate the market monthly market returns. As mentioned previously, the TIB used were assigned
by Lipper while the equity indices prices were retrieved from Datastream database15.
14http://thomsonreuters.com/thomson-reuters-eikon/ 15http://thomsonreuters.com/datastream-professional/
33
Taking in consideration the nature of the underlying funds (capitalization), the equity
indices selected are total return16.
where, is the monthly return of the mark in the period t, is the equity index
(m) in the period t, and is the Equity Index (m) in the preceding period t-1.
5.3. Conditional variables
We use three public information variables with one month lag: dividend yield (DY), slope of the term structure (TS) and a proxy of the risk-free rate of return (EUR). The selected variables are in line with major of empirical studies using the same approach such as Ferson and Schadt (1996), Schill et al (1999), Cortez and Silva (2002) and Leite and Cortez (2006).
Similar to Leite and Cortez (2006) we use European information variables instead of local ones due to the establishment of the European Monetary Union (EMU) and the increased integration of the European stock markets.
The dividend yield variable was equally obtained from Datastream database17 and refers
to the amount of dividend payments in the preceding 12 months divided by the current equity indices prices. The slope of the term structure is the spread between a 10 year
16 TR - Equity index that tracks the capital gains and assumes that any cash distributions, such as
dividends, are reinvested back into the index.
34
bund18 yield and the 1 month Euribor rate, also used as short term interest rate (EUR).
Both instruments were obtained from Thomson Reuters platform19.
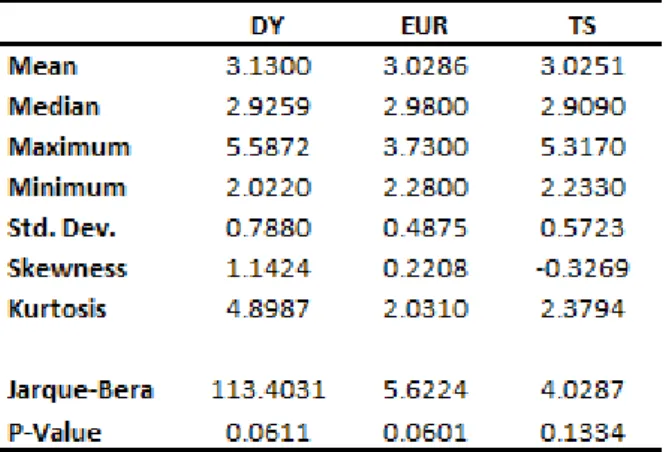
Table 4displays a statistics summary of the informational variables.
Table 4 – Informational variables statistics summary
This table displays the informational variables statistics and computed for the period of analysis (June 2002 to March 2012). The informational variables used are: dividend yield (DY), short term interest rate (EUR) and slope of the term structure (TS).
5.4. Robustness tests
In order to test the robustness of our data a few tests were performed to test stationarity, homoscedasticity and autocorrelation.
The first test performed was the Augmented Dickey Fuller (ADF) (1981), to test the null hypothesis (H0) of a unit root. Apart from the fund Orey Acções Europa (EUSTOXX.F04) all other funds rejected H0 with a 95% confidence level meaning that the data series is stationary. The fund EUSTOXX.F04 will hereafter be excluded from the funds sample as according to equation (5.2) the fund’s benchmark has low
18 A bond issued by Germany's federal government. 19http://thomsonreuters.com/thomson-reuters-eikon/
35
explanatory power. The remaining data series is considered not spurious. The detailed results can be found in the Appendix 4.
As part of the robustness data test, after implementing the ordinary least-squares (OLS) regressions of equations: 4.1, 4.2, 4.6, 4.7 and 4.8 to estimate the parameters, additional tests were implemented regarding homoscedasticity and autocorrelation. To test homoscedasticity property the White (1980) heteroskedasticity test was implemented whenever the null hypothesis (H0: there is homoscedasticity) was violated. Regarding the autocorrelation property the Newey–West (1987) test was used to overcome either autocorrelation or autocorrelation and heteroskedasticity together whenever the null hypothesis (H0: no autocorrelation) was violated.
Hereafter all the results presented and analysed are respectively corrected for heteroskedasticity and autocorrelation.
36
6. Empirical research results
In this chapter the results of Portuguese mutual funds’ performance for the selected sample are presented and discussed. Firstly we will analyse the estimates and how much a manager's forecasting skill contributes to the mutual fund’s return by applying Jensen’s (1968) risk-adjusted measure of portfolio performance.
Jensen’s model measures solely the selectivity ability therefore we will present two additional models to segregate and measure both selectivity and timing abilities of fund’s managers. We will use Treynor and Mazuy (1966) and Henriksson and Merton (1981) models on both unconditional and conditional versions to understand the impact of public information on overall mutual funds’ performance.
6.1. Unconditional models
The following table provides a summary of Jensen’s (1968) measure of performance
37
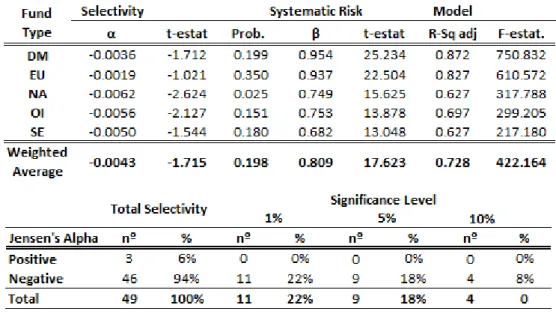
Table 5 – Performance measure through Jensen´s (1968) model
This table presents the mutual funds performance results for the period from June 2002 to March 2012 based on the estimates of the regression Rp,t = αp+ β(Rm,t)+ ep,t, where Rp,t is the excess return of portfolio
p in the period t; Rm,t is the excess return of market index in the period t; α is Jensen’s Alpha and
represents the selectivity ability; β is the systematic risk as an estimated sensitivity to market portfolio and ep,t it’s a residual variable.The funds estimates are aggregated by investment category and adjusted
for autocorrelation and heteroskedasticity according to Newey & West (1987) and White (1980). Investment categories are: DM - Domestic equity funds; EU - EU, Switzerland and Norway equity funds; NA - North American equity funds; OI - Other Int. equity funds; SE - Sector equity funds.
The overall funds’ relative20
performance is negative displaying an average of -5.16%21
a year. Performing a more detailed analysis, the North American equity funds category display the worst performance by exhibiting an alpha of -7.44% a year while EU, Switzerland and Norway equity funds reveal better performance though negative (-2.28 %/year). From a universe of 49 Portuguese mutual funds, 46 displayed negative alphas, 11 being statistically significantly at the 1% level, 9 at 5% level while 4 are statistically
20 Relative return/performance is the difference between the absolute return and the performance of the
market, which is measured by a benchmark.
38
significantly at the 10% level. The only funds displaying selectivity ability belong to EU, Switzerland and Norway Equity Funds category (Montepio Acções, Montepio Acções Europa and Postal Acções) however none of them have statistically significant alphas.
On the systematic risk (β) sphere, Domestic and EU, Switzerland and Norway equity funds reveal high levels of systematic risk (above 0.9) which is justified by the funds strategy with a high proportion of stocks in the portfolios. The remaining investment categories display significant lower levels of systematic risk (β) when compared to the mean (0.809) which can be explained by less aggressive investment strategies.
On average 73% of funds performance can be explained by the selected benchmark index indicating a good fitted model. The Sector and North American equity funds display a lower explanatory power which can be easily explained by the difficulty to find a better fitted index due to the diversity sectors and investment scope.
Overall the results suggest that Portuguese mutual funds do not possess selectivity ability. The results are consistent with international empirical evidence such as Jensen (1968), Ferson and Schadt (1996) and Rao (2000).
We now segregate the performance results by estimating both selectivity and timing coefficients by applying the TM (Eq. 4.2) and HM (Eq. 4.6) regression models. The empirical results from the TM regression model of Portuguese mutual funds are presented in the table 6. From the initial sample of 51 mutual funds, 2 funds were
excluded22 due to the low explanatory benchmarks according to equation 5.1. These 2
funds were equally excluded in the HM measurement that is presented in the table 7.
22 EUSTOXX.F04 – Orey Acçoes Europa: (Eq. 9) R-Sq adj 0.2836 ≯ 0.32701; STOXXEU.F03 –