Full Terms & Conditions of access and use can be found at
http://www.tandfonline.com/action/journalInformation?journalCode=rjus20
Download by: [Universidade Nova de Lisboa] Date: 27 December 2017, At: 04:15
International Journal of Urban Sciences
ISSN: 1226-5934 (Print) 2161-6779 (Online) Journal homepage: http://www.tandfonline.com/loi/rjus20
Climate projections and downscaling techniques: a
discussion for impact studies in urban systems
Marek Smid & Ana Cristina Costa
To cite this article: Marek Smid & Ana Cristina Costa (2017): Climate projections and downscaling techniques: a discussion for impact studies in urban systems, International Journal of Urban Sciences, DOI: 10.1080/12265934.2017.1409132
To link to this article: https://doi.org/10.1080/12265934.2017.1409132
© 2017 The Author(s). Published by Informa UK Limited, trading as Taylor & Francis Group
Published online: 27 Nov 2017.
Submit your article to this journal
Article views: 104
View related articles
Climate projections and downscaling techniques: a discussion
for impact studies in urban systems
Marek Smid and Ana Cristina Costa
NOVA IMS, Universidade Nova de Lisboa, Lisbon, Portugal
ABSTRACT
Urban systems are not only major drivers of climate change but also the impact hotspots. In the context of the planet currently undergoing a process of greenhouse warming, and simultaneously predominantly urban based ever continuing population growth, our agglomerations became vulnerable to chain reactions triggered by climate related hazards. Hence, the reliable and cost-effective assessment of future impact is of high importance. While the climate community has invested significant effort to provide downscaling techniques yielding localized information on future climate extreme behaviours, these methods do not remain widely exploited in the process of urban planning. In this work, we discuss the underlying reasons and main challenges of the applicability of downscaling procedures in the real process of urban planning. This paper attempts to help bridge the gap between the communities of urban planners and climatology. In the beginning, we summarize the rationale for such cooperation, supporting the argument that the scale represents an important linkage between urbanistic and climate science in the process of designing an urban space. Secondly, we introduce the main families of downscaling techniques and their application on climate projections, also providing the references to profound studies in the field. Thirdly, special attention is given to previous works focused on the utilization of downscaled ensembles of climate simulations in urban agglomerations. Finally, we identify three major challenges of the wider utilization of climate projections and downscaling techniques, namely: (i) the scale mismatch between data needs and data availability, (ii) the terminology, and (iii) the IT bottleneck. The practical implications of these issues are discussed in the context of urban studies.
ARTICLE HISTORY Received 30 May 2017 Accepted 20 November 2017
KEYWORDS
Urban climate; downscaling; climate change; impact assessment; adaptation planning; urban planning
1. Introduction
In the warming world, we are witnessing an urban population boom and an increasing number of megalopolis areas (Yang, 2007). Projections indicate that by 2050 urban systems will be home to 66% of the global population, representing 6.3 billon urban dwell-ers (United Nations [UN],2014). Urban systems act as important economic hubs and, as
© 2017 The Author(s). Published by Informa UK Limited, trading as Taylor & Francis Group
This is an Open Access article distributed under the terms of the Creative Commons Attribution License (http://creativecommons.org/ licenses/by/4.0/), which permits unrestricted use, distribution, and reproduction in any medium, provided the original work is properly cited.
CONTACT Marek Smid [email protected] NOVA IMS, Universidade Nova de Lisboa, Campus de Campolide, Lisboa 1070-312, Portugal
https://doi.org/10.1080/12265934.2017.1409132
such, they provide its inhabitants with higher quality of life, including health, cultural and psychological aspects (Murray, 2011). Urbanized areas are not only major drivers of climate change (CC), but are simultaneously hot spots of CC impact, and many of the world’s agglomerations are located in areas highly exposed to multiple hazards (Akbari, Konopacki, & Pomerantz, 1999; Haigh & Amaratunga, 2012). CC impacts on urban systems may cause the stagnation of the state or entire country (Malakar & Mishra,
2017). Climate change has major economic consequences in the form of reduction in labour productivity, disruption of transport systems and significant losses in energy pro-duction and its supply chains (Confalonieri et al.,2007). Mortality due to natural disasters is highest in developing countries, while overall economic damage is greatest in developed regions (Kousky,2014). However, economic development significantly decreased disaster damage (Choi,2016).
All the above-mentioned illustrates the importance of CC impact assessment in urban contexts. While impact assessments are commonly based on the output of state-of-the-art GCM-RCM simulations (Regional Circulation Models nested within General Circulation Model) providing information at scales varying between 12.5 and 50 km, the process of urban planning operates with finer scales exploiting detailed knowledge of neighbourhoods sometimes even at sub-street level. The GCM-RCMs are numerical coupled models describ-ing atmosphere, oceans, land surface, sea ice and interactions among those earth systems. Those models remain essential tools to assess climate change (Fowler, Blenkinsop, & Tebaldi, 2007). However, their coarse resolution and inability to resolve sub grid scale features limits their usability. A large portion of impact studies operates on scales finer than common resolution of global or even regional model outputs (Wilby et al.,2004).
The strong need for higher resolution climate data for impact assessment is a long time well-known issue (e.g. Cohen,1996; Kim, Chang, Baker, Wilks, & Gates,1984). This inter-est originated in the recognized discrepancy of course resolution GCMs (hundreds of kilo-metres) and the scale of interest of impact studies (an order or two orders of magnitude finer scale) (Hostetler,1994). The impact applications are highly sensitive to local climate variation, and as such they require information proportional to the point climate obser-vations. The fine-scale variations are parametrized in lower resolution models. The requirement of fine-scale information emerges particularly in regions of complex topogra-phy (Giorgi et al.,2001; Mearns et al.,2003; Wilby et al.,2004). Describing areas where information is needed in more detail, authors typically provide examples such as coastal areas, river mouths, islands or mountain regions. Until today, urban systems are not explicitly mentioned on such lists, even though they fulfil the requirements of the above definition (considering the term‘topography’in a broader sense).
When choosing an appropriate adaptation strategy, scale interdependency should be considered. Certain approaches (e.g. green roofs) provide micro-scale benefits, where most of the advantage is given to selected stakeholders concentrated in the vicinity of building rooftops. On the contrary, urban planners should be aware of synoptic and global climate change because this may significantly narrow down the portfolio of appli-cable micro-scale solutions (Georgescu et al.,2015). For instance, in urban systems period-ically exposed to dust storms, the effect of installation of highly reflective roofs will be significantly lowered by the decrease in albedo due to fine particle deposition (Getter & Rowe,2006). Moreover, climatological impacts occurring at a larger scale may unexpect-edly influence a metropolitan system. For example, high reflectivity can detrimentally
influence a hydrology cycle in an urban area and as such cause a decrease in regional-scale precipitation (Bala & Nag,2012). Georgescu et al. (2015), clearly states that not all adap-tation and mitigation measures should be given an equal weight across all spatial scales. In addition, there is still demand for deeper analysis, tool development and coordinated efforts, which should rise from the collaboration between global climate and urban com-munities and related disciplines.
GCM-RCM outputs are still insufficient for the analysis of many regional and local climate aspects, such as extremes. GCMs of very high resolution would indeed improve the simulations of regional and local aspects (Christensen, Carter, Rummukainen, & Ama-natidis, 2007), but they remain unreachable due to the enormous computational cost (Fowler et al.,2007), which leads to the accommodation of downscaling techniques (Rum-mukainen,2010).
The main aim of this paper is to contribute to closing the gap between various involved urban expert stakeholders–the communities of urban planners, climatologists, and policy makers. By providing the pointers towards appropriate tools and information sources we hope this work might serve as a shortcut to anyone new in the field of future climate impact assessment at a local scale. We also summarize crucial aspects and discuss some practical bottlenecks, which are seldom addressed in scientific literature, thus assisting with an initial phase to everyone facing the challenge of long-term urban adaptation planning.
The paper is organized as follows: in the Introduction, we recapitulate the problem background and the growing importance of CC impact on urban systems. Furthermore, tendencies towards fine scale, but simultaneously long term adaptation and mitigation planning are covered, thus justifying the utilization of climate projections and their deriva-tives delivered by downscaling techniques. In Section 2 we provide a general overview of the main broad families of downscaling techniques, including references to extensive works in the field. Their discussion focuses on the methods of statistical downscaling due to their utility, and the pros and cons of individual approaches are also discussed. In Section 3 emphasis is given to recent advancement in urban studies incorporating climate projections illustrating the variety of current approaches. The Discussion section is devoted to the applicability of climate data to urban planning practice, including a discussion on three practical bottlenecks of the wider utilization of downscaling tech-niques in impact assessment in context of urban space, namely scale mismatch, terminol-ogy and IT issues.
2. Downscaling of climate projections
Principally any data can be refined by downscaling techniques (Rummukainen, 2010). Coarse GCM output might be satisfactory, for example when the variation within a single grid cell is low or in case of global assessment. The main advantage of information directly obtained from GCM is the certainty that physical consistency remains unattached (Mearns et al.,2003). GCMs are valuable predictive tools, but they cannot account for fine-scale heterogeneity and reflect on features like mountains, water bodies, infrastructure, land-cover characteristics, convective clouds and coastal breezes. Bridging this gap between the resolution of climate models and regional and local scale processes represents a considerable challenge. Moreover, the uncertainties that characterize the GCMs/RCMs
are generally aggravated when these models are downscaled, which is the crucial step for identifying the city-specific impacts and, consequently, to identify vulnerabilities. Hence, the climate community put significant emphasis on the development of techniques for downscaling (Fowler et al.,2007).
There is no consensual and unique classification scheme to be applied in attempts to comprehensively review and summarize the downscaling techniques. In many studies (e.g. Fowler et al., 2007; Khan, Coulibaly, & Dibike, 2006; Trzaska & Schnarr, 2014), the methods are categorized into two main groups: Dynamical downscaling and Statistical downscaling. Dynamic downscaling is based on RCMs or fine spatial-scale numerical atmospheric models, such as Limited Area Models (LAM) (Feser, Rockel, von Storch, Winterfeldt, & Zahn, 2011; Fowler et al., 2007). Statistical downscaling is based on observed relationships between climate at fine and coarse resolutions that are used to transform global climate models’output to finer resolution. Alternatively, Mearns et al. (2003) distinguish three groups of approaches: High resolution GCMs; Nested LAM and RCMs; and Empirical/Statistical and statistical/dynamical methods. Within the group of Statistical downscaling, many approaches can be distinguished and classified according to different criteria. For example, Wilby et al. (2004) provide background infor-mation and guidance on the application of some Statistical downscaling methods, but also listed alternatives to downscaling techniques (thus somehow excluding those from the family of downscaling methods) including spatial interpolation of grid points (sometimes named‘unintelligent downscaling’), climate sensitivity analysis (frequently addressed as bottom-up approach), spatial/temporal analogues using historical data and simple change factor (known as Delta method). Giorgi et al. (2001) provide a survey of statistical downscaling techniques focusing on studies published between 1995 and 2000.
2.1. Dynamical downscaling
In a nutshell, dynamical downscaling represents a group of methods originally used in numerical weather forecasting (Rummukainen,2010). The first studies establishing the foundation of regional modelling are Dickinson, Errico, Giorgi, and Bates (1989) and Giorgi and Bates (1989). Since then, the field has undergone massive development (e.g. Christensen et al.,2007; Feser et al.,2011; Giorgi et al.,2001; Hong & Kanamitsu,2014; Xue, Janjic, Dudhia, Vasic, & De Sales, 2014; Yuqing et al., 2004). Dynamical models address data and physical processes equivalent to GCMs, but at finer scales, and provide results only for selected limited regions of the globe (Trzaska & Schnarr,2014). RCMs utilize the same physical-dynamical definitions of the key climate processes as GCMs. Atmospheric fields representing the output of a global model (e.g. surface pressure, wind, temperature and humidity) are loaded into vertical and horizontal boundaries of the RCM. Administering of boundary conditions represents a major challenge of dynamical downscaling (Rummukainen, 2010). The physics-based equations and locally specified data are used to gain regional climate outputs (Trzaska & Schnarr,2014). The unresolved inner-cell variabilities are pushed to RCM output rather than fully taken into account. All the inner-cell fine scale processes are approximated in a procedure called parametrization (Rummukainen,2010).
Two major streams are recognizable in dynamical downscaling. In the first, the resol-ution is increased over the entire domain of the atmospheric global model (e.g.
Christensen et al.,2007). The second strategy is based on the utilization of a global model with variable grid cell size (Fox-Rabinovitz et al.,2008; Lal, McGregor, & Nguyen,2008). This technique maintains a coarse grid over the majority of the globe, but increases the resolution within a particular area of interest (Rummukainen,2010).
The earlier RCMs resolution used to vary between 100 and 50 km, and at its best 25 km grid cells (Rummukainen,2010). The more recent development proved that RCMs are capable of delivering high resolution results (20 km or less) (Leung, Mearns, Giorgi, & Wilby,2003; Mearns et al.,2003). Consequently, increasing resolution also entails increas-ing computational cost and data volume. RCMs also require a high level of expertise to interpret the results. Moreover, the RCM experiments require high frequency (e.g. 6 hours) GCM fields supply for boundary conditions. These data are not usually stored due to mass-storage demand (Mearns et al., 2003). Due to these practical limitations, the regional dynamical downscaling models remain out of reach for a vast majority of researchers. Accordingly, the emphasis in this paper is given on the application of statisti-cal downsstatisti-caling techniques.
2.2. Statistical downscaling
Statistical downscaling, also known as ‘Empirical/statistical’ or ‘Statistical/dynamical’ downscaling (Mearns et al., 2003), is based on the perspective that regional climate is mainly conditioned by two factors: the large-scale climate and the local/regional features such as topography, land-sea distribution or land use (Fowler et al.,2007; Mearns et al.,
2003; von Storch,1999; Wilby et al.,2004). The large scale climate variables are used as ‘predictors’ to regional or local variables named ‘predictands. Fowler et al. (2007) expressed the essence of the idea of statistical downscaling as the following descriptive equation:
R=F(X)
whereRrepresents the local climate variable which is subject to downscaling,Xis the set of large climate variables, andFis a function which relatesRandXbeing validated by the use of point observations or/and gridded reanalysis data. This equation represents the most common form, but other relationships have been used, such as relationships between pre-dictors and the statistical distribution parameters of the predictand (Pfizenmayer & von Storch,2001), or the frequencies of extremes of the predictand.
Statistical downscaling allows one to simultaneously simulate multiple outputs such as precipitation, maximum and minimum temperatures, solar radiation, relative humidity and wind speed (e.g. Parlange & Katz, 2000), which is of great importance, particularly for impact studies (Wilby et al.,2004). It is also possible to downscale predictors indepen-dently, but in such a case, it is crucial to ensure that inter-variable relationships remain intact.
The performance of downscaling techniques depends on the choice of the regional domain (Wilby & Wigley, 2000), which in practice is often not considered (Benestad,
2001), and also depends on the regionalization methods (Wilby et al.,2004). Gutiérrez, San-Martín, Brands, Manzanas, and Herrera (2013) assessed the performance of statistical methods commonly used for downscaling temperature (including Analogue methods, Weather typing techniques, Multiple linear regression, and Regression conditioned on
weather types) with respect to their robust applicability in climate change studies. These authors established a new validation framework exploiting the anomalous warm historical periods. Based on this framework the study concluded that regression methods are the most appropriate in regard to climate change studies. Weather typing was found to under-estimate the temperature in moderately warmer conditions and Analog methods, even though best reproducing the observed distributions, significantly underestimate the temp-eratures for warm periods in comparison with observed values.
Operational weather forecasting approaches, such as Perfect Prognosis (Perfect Prog; von Storch, Zorita, & Cubasch, 1993) and Model Output Statistics (MOS; Wilks,1995,
1999), may also be incorporated in statistical downscaling (e.g. Feddersen & Andersen,
2005). These approaches, also named statistical post-processing methods, have been suc-cessful in correcting many deficiencies inherent to forecasts from numerical weather pre-diction models (Marzban, Sandgathe, & Kalnay,2006). Both groups of methods use large multiple regression equations, taking advantage of the correlations between predictand and regressors. The classification has its foundation in the character of the employed pre-dictors (Maraun et al.,2010).
Perfect Prog was developed to exploit the deterministic nature of dynamical Numerical Weather Prediction (NWP) models. Large scale observational data are often replaced by the reanalysis products, and the MOS approach is also rooted in NWP (Glahn & Lowry,
1972). The main principle is to exploit statistical relationships between local observational data and simulated output of the numerical model, in order to correct for RCMs errors (Maraun et al., 2010). This approach allows for the impact of a particular dynamical model to be directly reflected at different projections. A limitation of MOS models is that the data set must contain both the historical records of the predictand and the corre-sponding stored records of the forecast produced by the dynamical model.
2.3. Discussion
The choice of an appropriate method, or even deciding whether or not it is convenient to apply a downscaling procedure, is often not straightforward (Mearns et al.,2003). Never-theless, frequently, the global or continental scale information is implemented directly, which negatively affects the resulting local scale impact maps (Trzaska & Schnarr,
2014). We acknowledge that the most cutting edge approach to provide future localized climate information is to combine dynamical downscaling with further statistical advance-ment and bias corrections, as Lemonsu, Kounkou-Arnaud, Desplat, Salagnac, and Masson (2013) did when assessing the evolution of Parisian climate. However, these authors had access to a luxurious retrospective dataset with high spatial–temporal resolution for evalu-ation purposes. Moreover, their skills, expertise and the access to (funding, time and com-putational power) resources were arguably outstanding. Those advantages are usually associated with larger cities hosting universities and other institutions able to help with such sophisticated planning. Smaller urban systems often struggle to obtain such support, mainly in terms of expertise (Georgi et al.,2016). This is of high importance since consistent long-term urban policy should be based on systematic local participation. On the other hand, the major practical limitation of regional dynamical downscaling, which is its high computational demand (Mearns et al.,2003; Fowler et al.,2007; Rummu-kainen, 2010), is not so impactful in the case of empirical/statistical downscaling
techniques. Furthermore, statistical downscaling allows to simultaneously simulate mul-tiple outputs such as precipitation, maximum and minimum temperatures, solar radiation, relative humidity and wind speed (e.g. Parlange & Katz,2000), which is of great impor-tance, particularly for impact studies (Wilby et al., 2004). This flexibility, together with their reachability to wider urban stakeholder communities, determines the focus of this paper in terms of practical bottlenecks discussed below. In the following, we outline the strengths and weaknesses of statistical downscaling approaches.
The climate community invested significant effort to compare the methods of statistical downscaling (e.g. Benestad,2001; Dibike & Coulibaly,2005; Huth,1999; Khan et al.,2006; Schoof & Pryor,2001; Widmann, Bretherton, & Salathé Jr,2003; Wilby & Wigley,1997; Zorita & Von Storch,1999). Schoof (2013) provides a broad overview of statistical down-scaling for studies on regional climate change, focusing on downdown-scaling assumptions, choices of predictors and predictands, and methodological approaches.
The strengths and weaknesses of distinct approaches of statistical downscaling are sum-marized inTable 1. The basic assumption of stationarity is essential, but it also represents the major theoretical weakness of statistical downscaling (Wilby et al.,2004). The concept of stationarity assumes that the statistical relationship between the predictor and predic-tand will not change in future climate (Fowler et al.,2007). However, there is evidence that this may not occur (e.g. Fowler & Kilsby,2002; Slonosky, Jones, & Davies,2001). Statio-narity of the predictor-predictand relationship can be tested using long records, or a period of different climate characteristics can be used for model validation. Non-stationar-ity is introduced by an incomplete set of predictors, which does not reflect the low fre-quency behaviour, or has an inappropriate sampling or calibration period, or by real changes in the climate system. However, in projected climate change, the circulation dynamics may be robust to non-stationarities and the associated degree of non-stationar-ity is relatively small (Hewitson & Crane,2006).
When applied to a changing climate, another key assumption inherent to statistical downscaling is that the predictors should‘carry the climate change signal’ (Giorgi et al.,
2001). Selected predictors should be physically meaningful and reflect the processes which subsequently control variability in the climate. The selected predictor variables should also be those that are well represented by GCMs (Fowler et al.,2007). Appropri-ately selecting variables is in the equilibrium between the relevance in the physical climate reality and the accuracy with which the predictor is reproduced by the climate model (Wilby & Wigley, 2000). Partial correlation analysis, step-wise regression or an information criterion are examples of procedures that may be preliminarily applied in order to identify the most promising predictor variables (Wilby, Tomlinson, & Dawson,
2003). Also, local knowledge and expert opinion are priceless information sources in attempts to assemble the most effective set of predictors (Wilby et al.,2004).
When the statistical downscaling model is not able to consolidate land surface forcing, meaning that the simulated regional climate is determined solely on the basis of free atmospheric variables, the CC scenario will omit changes in land-surface feedback. However, it is acknowledged that local land use management influences regional climate, vegetation cover and runoff regimes (e.g. Chase et al., 2001; Kalnay & Cai,
2003; Reynard, Prudhomme, & Crooks,2001).
Statistical downscaling methods tend to underestimate the variance and poorly rep-resent extreme events. Therefore, the techniques that introduce additional variability
are frequently utilized (Fowler et al.,2007). A method magnifying the variability by mul-tiplication by a suitable factor is known as‘Variance inflation’(Karl, Wang, Schlesinger, Knight, & Portman,1990). The randomization method adds variability in the form of white noise, and provided good results in returned values of surface temperature for central Europe (Kyselý, 2002). A more sophisticated approach to add variability to
Table 1.Strengths and weaknesses of statistical downscaling methods with sample studies (adapted from Wilby et al.,2004).
Strengths Weaknesses Sample studies
Weather typing
. Yields physically interpretable
linkages to surface climate.
. Versatile (e.g. can be applied to
surface climate, air quality,
flooding, erosion, etc.).
. Compositing for analysis of
extreme events.
. Requires additional task of
weather classification.
. Circulation-based schemes can
be insensitive to future climate forcing.
. May not capture intra-type
variations in surface climate.
. Empirical Orthogonal Functions (EOFs)
(Goodess & Palutikof,1998)
. Cluster analyses (Cheng, Auld, Li,
Klaassen, & Li,2007; Cheng, Yu, Li, Li, & Chu,2009; Osca, Romero, & Alonso, 2013)
. Fuzzy methods (Bárdossy, Bogardi, &
Matyasovszky,2005; Bárdossy, Stehlík, & Caspary,2002; Teutschbein, Wetterhall, & Seibert,2011)
. Analogue method (Zorita & Von Storch,
1999)
. Hybrid approaches (Enke,
Deutschländer, Schneider, & Küchler, 2005)
Weather generators
. Production of large ensembles
for uncertainty analysis or long simulations for extremes.
. Spatial interpolation of model
parameters using landscape.
. Can generate sub-daily
information.
. Arbitrary adjustment of
parameters for future climate.
. Unanticipated effects to
secondary variables of changing precipitation parameters.
. Markov chains(Camberlin, Gitau,
Oettli, Ogallo, & Bois,2014; Kim, Kim, & Kwon,2011)
. Markov processes of second order
(Mason,2004; Qian, Hayhoe, & Gameda, 2005)
. Markov processes of third order
(Dubrovský, Buchtele, &Žalud,2004) Regression methods
. Relatively straightforward to
apply.
. Employs full range of available
predictor variables.
. ‘Off-the-shelf’solutions and
software available.
. Poor representation of observed
variance.
. May assume linearity and/or
normality of data.
. Poor representation of extreme
events.
. Regression-based and Generalized Linear Models (GAM)(Bergant & Kajfež-Bogataj,2005; Hellström, Chen, Achberger, & Räisänen,2001; Korhonen, Venäläinen, Seppä, & Järvinen,2014)
. Principal Component Analyses (PCA)
(Kidson & Thompson,1998; Sarhadi, Burn, Yang, & Ghodsi,2017)
. Artificial Neural Networks (ANN) and machine learning algorithms(Dos Santos, Mendes, & Torres,2016; Joshi, St-Hilaire, Ouarda, & Daigle,2015)
. Canonical Correlation Analysis (CCA)
(Karl et al.,1990; Skourkeas, Kolyva-Machera, & Maheras,2013)
. Singular Value Decomposition (SVD)
(Chun, Sung, Woo-Seop, Oh, & Hyojin, 2016; Huth,1999; Liu & Fan,2012; Zwiers & Von Storch,2004)
. Kriging and other spatial interpolation approaches(George, Janaki, & Gomathy,2016; Ramos, St-Onge, Blanchet, & Smargiassi,2016)
statistical models is a variant of canonical correlation analysis called‘Expanded downscal-ing’(e.g. Huth,1999; Müller-Wohlfeil, Bürger, & Lahmer,2000). Each of the abovemen-tioned approaches have different drawbacks (Bürger & Chen,2005). Variance inflation does not adequately reflect spatial correlations. Randomization poorly transfers change in variability that influences expected future change. Expanded downscaling is highly sus-ceptible to the choice of statistical processes during its own application (Fowler et al.,
2007).
Generic weakness of statistical downscaling is high demand on available data. On the other hand, the computational cost of statistical downscaling is relatively low. Therefore, it may appear to be an advantageous alternative for projects where the computational capacity, technical expertise or time represent significant restriction (Trzaska & Schnarr,2014). Statistical downscaling may be appropriate for impact studies in hetero-geneous regions with complex topography and steep environmental gradient (e.g. islands, mountains, land/sea contrast), or in cases where point scale information is required (e.g. local flooding, soil erosion, urban drainage, etc.), or to produce large ensem-bles and transient scenarios (Wilby et al.,2004).
3. Climate projections and urban studies
This section illustrates the variety of current approaches available to study potential impacts of CC in urban systems, thus it provides a typological summary rather than a comprehensive review of the field. The studies are organized from the point of view of the scale and the complexity of deployed downscaling techniques with highlights of unique features. We start with relatively simple studies utilizing the data from only one weather station. Then we move to works assessing climate change in more than one metropolitan system, but sometimes considering each city as a point feature. Finally, we focus on complex studies deploying various techniques of statistical and dynamical downscaling, exploiting a range of environmental indices and (apart from the climate simulations) deploying sophisticated models of future evolution of urban land cover.
The first group of urban studies commonly uses observational data from just one or few measurement stations (weather or rain gauge stations) for validation purposes. These time series are used to correct bias in dynamically simulated GCMs or RCMs in order to obtain more reliable projections of urban climate. This approach is widely used in hydrology and the term downscaling frequently refers to temporal disaggregation of the data (e.g. Hingray & Haha,2005; Huang & Lu,2015; Willems & Vrac,2011).
Sunyer, Madsen, and Ang (2012) considered future scenarios for a location north of Copenhagen (Denmark) using simulated data from a set of RCM projections of the ENSEMBLES project (Van der Linden & Mitchell, 2009) with spatial resolution of 25 km. This study compares five statistical downscaling methods: two regression models and three weather generators. The regression methods exploit the different statisti-cal properties, namely changes in mean and changes in mean and variance. The Weather Generators (WGs) are a Markovian chain model, a semi-empirical model and a Neymar-Scott Rectangular Pulses (NSRP) model. The paper by Sunyer et al. (2012) is also out-standing for its highlights of the importance of the limitations and advantages of different downscaling techniques.
Somewhat related is a study of Onof and Arnbjerg-Nielsen (2009), but with focus given solely to WGs. The rainfall generator in this method is composed of two features: the storm structures are captured by the hourly generator and then the disaggregator provides hourly information at finer temporal scales. Another difference from Sunyer et al. (2012) lies on the method of transformation of the areal information (RCM output) to the point scale. Here, the areal information is represented by a grid-squared product of the Danish Meteorological Office with a resolution of 10 km. For each gauge, the RCM cell containing the gauge and the eight neighbouring cells are considered. Than the mean and standard deviation over those nine grid-squares are used in the fitting of the hourly generator. This strategy was also applied by Willems and Vrac (2011). These authors used two sets of methods. One of them was the direct usage of climate models output with compu-tation of quantile perturbations on extreme events. The study tested the assumption that the same perturbations remain constant for finer temporal scales. The second group of methods belong to the family of Weather typing approaches, which account for low accu-racy of daily precipitation in current climate models by considering that change in precipi-tation is not only a function of change in atmospheric circulation but it also depends on temperature rise.
Recently, Batista, Gonçalves, and da Rocha (2016) assessed the impact of future heat in the metropolitan region of São Paulo (Brazil) based on the Indoor Perceived Equivalent Temperature (IPET) index. The IPET was computed on the adjusted cutting-edge multi model climate project CORDEX, which is an international initiative for downscaling climate projections from different parts of the world. More specifically, Batista et al. (2016) deployed CREMA (CORDEX REgCM4 hyper-Matrix experiment) simulations. This study is unique considering the use of measurements from two weather stations for validation purposes, which is justified by the varying wind conditions in the city.
Another group of studies focused on the impact of CC in urban systems by assessing multiple metropolitan areas simultaneously. Such studies, apart from their conclusions regarding specific cities, also allow for judgments at broader spatial domains (e.g. state or regional). For example, a study by Martin, Cakmak, Hebbern, Avramescu, and Trem-blay (2012) assessed the potential temperature-related mortality under climate change for fifteen Canadian cities. This study shares some aspects with previously mentioned works, namely the strategy of the eighth neighbouring grid-cells centred at the observations’ locations – in this case the airports. A distinctive feature of this work is the linkage between temperature and mortality, which was possible due to the cooperation between the authors and the Public Health Agency of Canada that provided the mortality data.
Fallmann, Wagner, and Emeis (2017) analysed various climate indices for eleven urban areas in Central Europe. This work used climate simulations of a non-hydrostatic Weather Research and Forecasting (WRF) model with the Advanced Research WRF-ARW dynamic solver version 3.1.1. of 7 km grid cell resolution. The E-OBS dataset (Haylock et al.,2008) was used for validation purposes. Another highlight of the study by Fallmann et al. (2017) is that it provides some hints on the technical / IT execution of the exercise, which is seldom addressed in scientific literature.
A very different study by Huang and Lu (2015) assessed the effect of Urban Heat Island (UHI) on climate warming in the Yangtze river delta in China, which covers many metro-politan areas. The analyses were based on measurements from forty-one meteorological stations that uniformly covered the study area with data from 1957 to 2013. The
authors provide the warming rates and estimates of the UHI contribution to observed warming. Another aspect of this study is the classification of the cities into levels according to population size and subsequently derived conclusions within those categories.
Another study for China region using climate simulations in the context of urban systems is the work of Li, Gu, Bi, Yang, and Liu (2015). The authors projected heat-related mortality for cardiovascular diseases and respiratory diseases. The interesting feature to be highlighted is that this work targets the specific causalities within those disease categories instead of the total heat-related mortality. On the other hand, the limit-ation of this study might be the usage of the ensemble consisting of only five GCMs (the rule of thumb recommends at least ten models). However, Li et al. (2016) have improved the study by utilizing thirty-one downscaled climate models for the same area. More importantly, they included the trend of aging population in the estimate of future heat-related mortality. Consequently, this study provides the first evidence of the synergy in hybrid question of global warming and population aging in China.
Completely unparalleled is a study by Früh et al. (2011). Firstly, the RCMs runs were used as input for a dynamical model to obtain data at urban scale (horizontal resolution varies from 500 m at the outskirts to 50 m at the city centre), and then the microscale simulations covering thirty-year time slices (past and future) were delivered via the Cuboid method. This method considers the assumption that it is possible to reduce the problem into three degrees of freedom: the 2-m air temperature, the 2-m humidity and 10-m wind speed. This approach is related to the family of envelope models used in Ecology. Only a small set of meteorological conditions are being simulated and the specific day characteristics are derived by means of interpolation. According to Früh et al. (2011), this pragmatic approach provides approximated results but significantly decreases the computational cost.
A complex study by Hayhoe et al. (2004) assessed CC impacts on a medium size area of interest in California (USA), where one of the four locations considered for extreme heat analyses is located in the city of Los Angeles. This study used one lower (B1) and one higher (A1fi) Special Report on Emission Scenarios (SRES), which bracket a large pro-portion of various future emission scenarios. Dynamical models were statistically down-scaled to a grid of 1/8° (∼13.5 km) by a still popular downscaling method based on probability density functions. This approach belongs to the family of empirical-statistical downscaling techniques. Furthermore, simple regression was used to downscale to the locations of selected weather stations. The observed monthly regression relations were then applied to future projections to ensure that the approximated information on future climate shared the same weather statistics. Hayhoe et al. (2004) also reported that the extrapolation beyond the range of observed values were rarely needed because the simulated climate behaviour involves higher occurrence of warm days rather than an increase in expected absolute maxima. This study represents one of the most complex CC impact assessments in terms of impacted sectors: extreme heat, heat related mortality, snowpack, runoff, water supply, agriculture and general vegetation dis-tribution. The most relevant conclusions in an urban context are about extreme heat and related mortality, but the authors also provide insights on future precipitation, snowpack, runoff, water supply, agriculture and vegetation cover.
Even though the study by Lee, Park, Lee, and Kim (2016) is not urban specific, it used RCM simulations and has several unique aspects. The authors computed the Probable
Maximum Precipitation (PMP) deploying data from 64 weather stations dispersed all over South Korea, which were interpolated into a 5 km × 5 km grid by inverse distance weight-ing. The bias included in RCM simulation was corrected by the quantile-mapping method. First, the major storm events on the record were identified assuming that their associated precipitation efficiency was maximal. The storm efficiency is a function of perceptible water (total mass of water vapour in vertical column of the atmosphere). However, the direct measurement of this quantity is very challenging and perceptible water is also not a common variable provided by RCMs. The first unique feature of this study is the overcoming of the issue of lacking perceptible water information by exploiting the corre-lated relationship with surface dew point temperature. Second, this article provides a very detailed and intelligible explanation of a cutting edge bias correction method.
Kusaka, Masayuki, and Takane (2012) evaluated future heat stress in the world´s largest metropolitan system – Greater Tokyo. This sophisticated study deploys the dynamical WRF model with 3 km horizontal spacing. The boundary forcing is created by averaging the ensemble of three different GCMs. To express estimated future heat stress this study uses the concept of Wet-Bulb Globe Temperature (WGBT). WGBT is an empirical heat index developed to control heat-related causalities in military training, and supposedly it correlates better with heat stroke occurrence than simple air temperature. Another simple but interesting indicator of future heat stress used by Kusaka et al. (2012) is the frequency of Heat-induced Sleeping Discomfort (HSD) nights. Another highlight of this work is an approach to account for the complexity of the urban system. The WRF model is coupled to a single layer Urban Canopy Model (UCM), which considers the urban geometry, green fraction and anthropogenic heat emission with diurnal variation. There are many studies confirming that land cover has a significant impact on climate (e.g. Fallmann et al.,2017; Huang & Lu,2015; Solecki & Oliveri,2004). Some works proved its impact on rather local scales (Cui & Shi,2012; Früh et al.,2011; Hu & Jia,2010; Wolters & Brandsma,2012; Zhang, Gao, Wang, & Chen,2010). Other studies provided evidence of climate being influenced by urbanization and related land cover changes on regional or even global scale (e.g. Batista et al., 2016; Da Rocha, Reboita, Dutra, Llopart, & Coppola, 2014; Llopart, Coppola, Giorgi, Da Rocha, & Cuadra, 2014). On the other hand, a global study by Peng et al. (2012), considering 419 large cities, states that no relation has been confirmed between the size of the metropolitan system or population density and the UHI effect. Rather than that, those authors emphasized the importance of urban design and urban vegetation cover within the city.
One of the most complex approaches for downscaling urban climate data involving land use modelling is the work of Solecki and Oliveri (2004). As a part of the New York Climate & Health Project, these authors describe a procedure to downscale CC scenarios in urban land use models. The land use models considered in this study are part of the SLEUTH programme (Clarke, Hoppen, & Gaydos,1997), which deploys a probabilistic cellular automata protocol, and consists of two core components: the Land Cover Delta-tron Model (LCDM) is nested within an Urban Growth Model (UGM). An alternative to those mostly not user friendly cellular automata models was recently introduced by Bununu (2017).
Finally, Lemonsu et al. (2013) used a very sophisticated approach to investigate the evolution of Parisian climate. This study was conducted as part of the EPICEA project (French acronym for Pluridisciplinary study of the impacts of climate change at the
scale of Parisian region). The aforementioned authors combined dynamical downscaling with the quantile-quantile (q-q) correction method. The long term urban climate simu-lations were calculated by the SURFEX land surface modelling system. The analyses were done for a 48 km × 48 km study area with a spatial resolution of 1 km. The land use/land cover scheme followed the CORINE classification. For evaluation purposes, the high spatial–temporal resolution (8 km, hourly) retrospective dataset (1958–2008) generated by the SAFRAN system was utilized. This study by Lemonsu et al. (2013) assessed possible aspects of future climate in winter and summer seasons separately by exploiting a wide range of climate indices, and provided information on the UHI effect as well.
4. Discussion
Climate change is expected to have significant impacts on urban systems and built infra-structure (Chapman, Howden-Chapman, & Capon,2016; Hunt & Watkiss,2011; Rosenz-weig, Solecki, Hammer, & Mehrotra, 2011), such as energy systems (Spandagos & Ng,
2017), water supply and wastewater treatment (Howard, Calow, Macdonald, & Bartram, 2016; Wang et al.,2016), transportation systems (Dulal, Brodnig, & Onoriose,
2011; Kwan & Hashim, 2016; Peterson, McGuirk, Houston, Horvitz, & Wehner,2008), public health and human comfort (Araos, Austin, Berrang-Ford, & Ford,2016; Batista et al.,2016; Li et al.,2015; Molenaar, Heusinkveld, & Steeneveld,2016).
What climate-related challenges does the city face? Where are adaptation policies and actions the most urgently needed? Those are key questions faced by decision makers but the answers often lead to short or medium term solutions. Actions like establishing a plan for the mobile dams’deployment belong to coping measures and are based on the experi-ences of past extreme events. Incremental adaptation represents another approach, when the already existing solutions are improved step by step considering the future evolution of the climate conditions. Coping and incremental adaptation measures certainly have their value but do not grant the functionality in the long term future. In extreme cases, these approaches might lead to a scenario where the urban system is locked-into an unsustain-able situation (e.g. the capacity of already existing dykes or conventional sewerage system is not ever-increasable). On the other hand, urban systems last for decades and certain fea-tures such as valuable heritage remain for centuries. Hence, broader and systematic approach to address long term adaptation planning is needed. Transformative adaptation combines coping and incremental strategies, while addressing the root of causes and acknowledging the future potential magnitude of various risks. Transformative adaptation aims to multipurpose solutions and, as an integral part of urban planning turns challenges to opportunities and boosts overall quality of life.
Adaptation to climate change is currently becoming an integral part of urban planning and infrastructure development at city and district levels. While the short and medium term perspective is usually considered, long-term planning often remains omitted by man-agers and decision makers. There are several reasons for the lack of long term adaptation planning and action. Firstly, for example in European cities, administrators operate with reduced budgets and high unemployment resulting from economic crises. Globally, while some cities already experienced dramatic impacts of CC, others view the matter as a distant future challenge, thus their focus is on more urgent problems. In fact, in scientific
literature the evidence of the current lack of appropriate policy targeting the urban climate can be found (Hughes,2017). Moreover, even though integrated long-term transformative adaptation strategy makes the action more affordable, these investments are rewarding after a long time beyond political mandates. Long term adaptation planning operates with periods of approximately 50–100 years and represent a difficult challenge owing to the uncertainty associated with future climate, as well as because of the socioeconomic evolution of complex urban environments (Georgi et al.,2016).
4.1. Linking climate data and urban planning
Climate information should be considered in the planning practice of different sectors, such as cultural heritage protection, disaster risk reduction, food security, public health, energy, transport, tourism, water resources and coastal management. However, rec-ommendations on how to incorporate climate data into the urban planning process often remain rather holistic. A few major entities (e.g. WMO – World Meteorological Organization, IPCC – Intergovernmental Panel on Climate Change, FAO – Food and Agriculture Organization of the United Nations), among other authors (e.g. Akbari et al., 2016; Davoudi, Crawford, & Mehmood, 2009), provide general information on adaptation and mitigation planning. For example, the Implementation Plan of the Global Framework for Climate Services (WMO,2014) provides some insights, but they are still general as they typically reflect the purpose of the actions or they are limited to a few urban systems.
Eliasson (2000) investigated if, how and when knowledge about the climate is used in the urban planning process. The study showed that the use of climatic information was unsystematic and that climatology had a low impact on the planning process. Carter et al. (2015) discuss the use of weather data and climate projections by urban planners from Greater Manchester (UK) for adaptation planning. Those authors also stress practi-cal limitations in the data that are constraining its wider use, such as the need to provide simpler messages with an accompanying narrative to explain what CC means locally. Lorenz, Dessai, Forster, and Paavola (2017) explored the usability and adoption of climate projections within local adaptation planning in England and Germany. Their con-clusions regarding the English context raised the question to what extent the discussion on the usability of climate projections at a local level is sensible at the moment. Lorenz et al. (2017) also concluded that Germany makes substantial use of past and present climate data for spatial planning, but the strictly regulated nature of planning prevents the use of climate projections, due to their inherent uncertainties.
How exactly can uncertain probabilistic information be included in a decision support system? A basic concept, still widely used in engineering, considers the climate variability but only with constant properties through time, and based on the severity of the past events. This stationarity assumption is still a common practice when designing new infra-structures (Klein Tank, Zwiers, & Zhang, 2009). Therefore, the capacity to endure extremes is accounted for up to a magnitude that might not realistic at locations where that assumption is not met. In fact, urban planners often take into account spatially course projections of climate events and then apply general adaptation measures across the whole metropolitan area (e.g. the utilization of certain thickness of insulation of elec-tric wires or the usage of pipes with specific diameter or/and of certain material when the
replacement takes place). Such adaptation measures are not location-specific. Hence, they may be effective but not efficient. Instead (or additionally), urban planners could use loca-lized climate projections to prioritize projects according to areas with strongest future impacts (i.e. the conjunction of hazards exposure and vulnerabilities). Detailed climate projections could assist with major infrastructures development to ensure their safety. For example, industries with high potential to contaminate water resources and soil could be located in areas of low risk of extreme climate impacts. Urban planning should give a greater emphasis to the locations exhibiting higher impacts on the vulnerable part of society, such as children, elderly and low income communities. Furthermore, close attention should be given to land-use planning to prevent new urbanization in high-risk areas (including high-risk areas in distant future).
The important reason why the localized climate information is being incorporated to urban planning rather slowly is that data providers and data users need to interact better. It can also be due to the uniqueness of each urban system, or because climate adap-tation is still somewhat new in the policy making agenda (Carter et al.,2015). Climate experts often do not have a mandate to influence the decision-making process, while urban decision makers need assistance with data handling and interpretation. In urban space, various programmes, institutes and private stakeholders typically address individual aspects of adaptation planning, but the coordination between them is generally week (WMO,2014). Due to the novelty of this agenda, the interaction between stakeholders should have a form of long-term bidirectional communication to allow for feedback and further adjustments. Moreover, Schoof (2013) suggested to establish new expert pos-itions within decision-making bodies. Those climate professionals would help to increase the utility of localized climate projections.
To successfully tackle the impacts of CC in urban systems, climate projection data with a suitable spatial scale are vital. For example, while water management studies require an inter-regional approach, UHIs or stormwater related challenges are by their nature local (Georgi et al.,2016). Local stakeholders often have very fine scale information regarding vulnerabilities to changing climate, while at the same time local decision makers have a key responsibility to deliver space-specific adaptation measures to address the environmental, social and economic implications of CC (Carter et al.,2015).
Currently, we are witnessing two parallel tendencies. The first one is a push towards localized city/district level planning (Georgi et al.,2016), and a second one is a need for long-term adaptation planning (Davoudi et al.,2012). The lack of information that can be used as a basis for impact studies addressing these two requirements represents a certain gap. Different communities are mentioning this gap, each of them from their own perspective. The environmentalist community often refers to a gap in knowledge (e.g. Martins & Ferreira, 2011) and urban planners state that cities do not have skills and expertise, whilst decision makers address the shortage of financial resources to bridge this gap by consultancy (Georgi et al.,2016). However, the two above-mentioned requirements are bounding this gap.
The usual approach to dealing with uncertainties in future projections of climate change and its impacts is to consider a range of possible future scenarios under different Representative Concentration Pathways (RCPs) (e.g. RCP 4.5 or RCP 8.5) described by Van Vuuren et al. (2011). The temporal scope of most of the impact studies based on such CC projections is the end of the century. These studies are particularly useful for
long-term sustainable development planning, because it must account for vulnerability to extreme weather events, disaster management and adaptation, particularly in developing countries (Mirza,2003). Nevertheless, Vautard et al. (2013) argue that the medium term future period of 2050 corresponds to the societal demand of climatic projections useful for adaptation purposes. Regardless of the time scope of the climate projections (2050 – medium term future; 2100 – distant future) or the range of possible future scenarios, important is the need for downscaling scenarios and projections at spatial scales that are relevant for adaptation policies, particularly at city scale.
Carter et al. (2015) advocate that, for effective adaptation, decision makers should develop responses to recent trends in weather and climate, as well as to future projections. Those authors support this claim on a detailed case study of CC impacts and urban adap-tation responses linked to spatial planning in Greater Manchester (UK). Research methods employed included downscaling climate projections, spatial analysis with Geographic Information Systems, land use modelling, energy balance modelling, social network analy-sis, participatory workshops, scenario development, among other approaches. We agree that their conclusions and recommendations are relevant to cities in general.
Another successful multidisciplinary approach is the Rotterdam Climate Initiative (http://www.rotterdamclimateinitiative.nl), which aims to have reduced CO2 emissions by 50% and to have made the region 100% climate proof by 2025. Four potential climate scenarios are used for all climate research and policy-making in the Netherlands, such as the urban CC adaptation plans (City of Rotterdam, 2013). For example, two extreme climate scenarios are used to determine the upper and lower limits for the rise in sea level and the normative river flow, as well as to analyse flood protection measures. One of the scenarios assumes 1°C temperature rise on earth in 2050 compared to 1990 and no change in air circulation patterns, and the other one assumes 2°C temperature rise, milder and wetter winters due to more westerly winds and warmer and drier summers due to more easterly winds. These CC scenarios are also linked to two socioeconomic scen-arios. This combination has led to four delta scenarios looking ahead to 2050 and 2100. The Rotterdam Climate Change Adaptation Strategy is based on these delta scenarios (City of Rotterdam,2013).
4.2. Mismatch between data needs and data availability
In localized long-term future climate impact assessment, there is no alternative to deploy-ment of climate projections. Swart et al. (2014) emphasized the need to enclose the gap in available climate simulations data by calling for making the projections more precise. Moreover, Olazabal et al. (2014) highlight the problem of the lack of knowledge on specific local future climate conditions. The quantitative knowledge relevant to local priorities is pivotal in urban planning, urban design and the adaptation strategy implementation pro-cesses. Space-specific information can be used for the development of map-based inter-faces, which is very effective in communication. This is important because local level tools and decision support systems foster citizens’ participation, and allow them to embrace the change and tackle the adaptation as a positive opportunity rather than an issue solely bringing additional costs.
Evidence based knowledge of previous events, general climate change information, localized climate projections and vulnerability assessment of exposure features represents
the main components of urban adaptation strategy. While local and regional governments have very fine scale information on urban systems and their vulnerability at their disposal, data with the adequate spatial scale regarding future climate behaviour, as simulated by GCM/RCM models, are often lacking to address its relation with various aspects of urban systems.
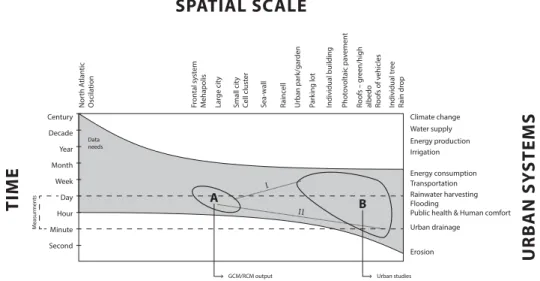
This mismatch between data needs and data availability is schematically depicted in
Figure 1, which also illustrates the magnitude of the need for applying downscaling tech-niques to the already available GCM/RCM data. The discrepancy between features A and B (Figure 1) express the general mismatch at spatial and temporal scales. Ideally, A and B would overlap.
Figure 1can provide insights on questions like: Is the available data sufficient to address a particular urban challenge? Is there a need to apply downscaling techniques, and if so, what would the satisfactory spatial and temporal target resolution be? For example, there is a great variation in the requirements on space and time resolution in hydrology. Water management operates on broader areas at catchment scales, thus the common RCM output with 50 × 50 km cell size might be feasible. Conversely, stormwater and urban draining analyses require a much finer spatial and temporal scale, coming down to point scale representing individual rain gauges. Similarly, on the temporal axis of
Figure 1, flash floods analysis calls for hourly and sub-hourly data. Overall, the needs for urban hydrological studies are located in the right-bottom part of object B (Figure 1). For example, heat waves (in dependency on what kind of environmental index is being used) are typically defined as certain days during which the temperature does not drop under a certain threshold. Hence, daily temperature data would be effective for such an assessment and subsequent adaptation planning. Additionally, the dotted lines in Figure 1 represent examples of the mismatch between raw GCM/RCM output and the needs of urban studies. The line marked as I illustrates the situation where cutting-edge RCM simulations are available (e.g. EURO-CORDEX data with 12 × 12 km/day
Figure 1.Mismatch between data needs and data availability in urban systems (inspired by Bi et al.,
2017).
resolution) and the UHI effect is of main concern. The longer line II depicts GCM/RCM of 50 × 50 km/6 hourly, and the subject to be analysed is a stormwater discharge. These illustrative examples assist in readingFigure 1, where the length of lines I and II represents the magnitude of the scale mismatch, which emphasize the current need for the deploy-ment of downscaling techniques.
4.3. Climate change adaptation practices and scale interdependency
Grimmond et al. (2010) identify current capabilities to observe and predict urban atmos-pheric processes across a range of spatial scales. In future urban climate assessment, there is a need to not only estimate the climate behaviour, but also the socioeconomic evolution of the urban system. Those two are bind since they are bidirectional inter-dependent. Therefore, the modelling should also be coupled. Land use and land cover represent pro-minent observable tokens of the socioeconomic situation. Generally, land use in the context of complex urban fibre is a phenomenon occurring (and being managed) at finer scale than typical GCM/RCM output, thus downscaling techniques have their value for urban planning and design. Moreover, land-use changes are not considered in RCMs, which are usually run with static vegetation (Rössler et al.,2017). For example, when designing an urban square, decision makers having the localized information on future climate conditions (including the influence of e.g. amount of sealed surface to water run-off and UHI) may design the square differently. The positioning of circumfer-ential buildings, the excessive water draining vegetation or shading trees can be added, tar-geting the areas of likely future high exposure. Street design can incorporate the corridors following the main local wind directions (Georgi et al.,2016). Such decisions are difficult to be made based on coarse resolution decision making supporting materials, particularly in a city context, where conditions might differ street by street (Ali-Toudert & Mayer,
2007).
Specific climatic conditions predefine effective adaptations. The strategies should be harmonious within a large spatial sustainability context. Hence, for example, utilizing non-native flora (aiming for local temperature reduction) with high water demand in arid zones may result in the reduction of city water supply (Ruddell & Dixon, 2014). According to Georgescu et al. (2015), the balance between localized cooling and water scarcity in cities should be subject to further research.
Even individual buildings can have decadal or century-times scale impact. Decisions of urban planners also have climate-related spatial impacts. Planning processes should con-sider the limits on parallel or concurrent development resulting from scale interdependent phenomena (Mills et al.,2010). Buildings relatively taller than surrounding constructions would alter shading, near-surface temperature and the wind regime which consequently influence the thermal comfort and the air quality in the area, particularly in the case of cumulated impacts related to rapid development. The study of the Pearl River delta in East China, serves as an example which documents the impact of the sum of rapid devel-opment onto regional air quality (Lu, Chow, Yao, Lau, & Fung,2010). Decision makers should be aware of scale interdependency dimension of development in order to optimize strategies across various spatial scales.
Both climate and land cover models carry large uncertainties. This uncertainty must be kept in mind during the decision making. Hence, the action taken on the basis of localized
future projections should favour the so called robust and low-regret measures. Those measures are of relatively low cost and bring large benefits. For example, instead of increasing the capacity of a sewerage system, which does not guarantee sufficient function-ality under long-term climate change, the city may deploy a green infrastructure at a lower cost. Such a solution also brings additional benefits and is more flexible, therefore it allows the urban system to avoid locking itself in the unsustainable strategy (Georgi et al.,2016). Moreover, due to the complexity and long-term nature of climate, the integration of a monitoring, reporting and evaluation (MRE) system is vital (UNFCCC Secretariat,
2010). MRE does not only represent a procedure to systematize experience and extend knowledge, but also provides an emphasis on learning. Hence, MRE allows for necessary continuous adjustments in future decision making (Bours, McGinn, & Pringle,2014).
4.4. Practical bottlenecks for geographers, urban planners or statistics practitioners
Terminology represents the very first bottleneck for everyone new to the field of downscal-ing of climate projections. von Storch, Zorita, and Cubasch (1991) might have been the first ones to use the term downscalingand it has been widely used since then, but the termsdisaggregationandregionalizationare also frequently used in Europe. In parallel, the namerefinementwas proposed by Environment Canada (Hengeveld,2000). Neverthe-less, the downscaling concept has been increasingly utilized in Canada (Barrow, Maxwell, & Gachon,2004).‘Statistical/empirical’downscaling is commonly addressed by simplified terms ‘statistical’ or ‘empirical’ downscaling, while ‘Dynamical downscaling’ can be referred to as‘numerical’downscaling (Bi, Gachon, Vrac, & Monette,2017).
Downscaling and climate modelling represent a multidisciplinary field, where researchers from various backgrounds intersect their efforts, resulting in specific termi-nology, which may be somewhat confusing. For instance, Polynomial Regression (also called the Surface Trend Analysis) is a statistical technique. In the context of spatial interpolation procedures, it is commonly classified as a deterministic technique, and kriging approaches are classified as stochastic. Furthermore, the terms ‘statistical’ and ‘stochastic’ (frequently used as names of sub-classes in downscaling methodological reviews) are not always considered as synonymous, even though both terms could be seen as identical since they are referring to methods handling input modelling factors as variables with certain probability distributions. In addition, recent development is moving towards multi-step methodologies containing deterministic and stochastic com-ponents. This evolution leads to the introduction of new terms like hybrid or semi-sto-chastic approaches, which makes the efforts of initial exploration of various downscaling methods even more challenging. Consequently, we present perhaps the most compre-hensive graphic in Figure 2. Not all classification terms found in the literature are included, but it is helpful when one tries to orient oneself in the main sub-categories of statistical/empirical downscaling.
Wilcke and Bärring (2016) argue that many climate impact modellers are simply not able to handle the data generated by GCM-RCM simulations. This topic is seldom dis-cussed in urban climate scientific literature (e.g. Wilcke & Bärring, 2016; Rössler et al.,
2017). Here, we hypothesize that the underlying reason largely lies in certain entrance bar-riers within the IT domain. Sometimes, one can find pointers, for example when Fallmann
et al. (2017) state that calculations were carried out using Climate Data Operators (CDO) tools. However, the comprehensive know-how is not that straightforward to find. This IT bottleneck is possible to divide into two related areas. First, is the data structure / format, and the second is the amount of data generated by GCM-RCMs (meaning both data volume and large quantity of files).
Future climate projections data are commonly provided in NetCDF (Network Common Data Form) format. This is a set of interfaces, libraries, self-describing, machine-independent and array-oriented data formats supporting creation, access and sharing of scientific data (Rew et al.,2011). NetCDF has its origin in the University Cor-poration for Atmospheric Research (UCAR) consortium, under the Unidata programme. NetCDF is a successor of Common Data Format developed by NASA, but it is no longer compatible (Rew et al.,2011). All above-mentioned entities represent supreme sources of information. The various versions of NetCDF data can be encountered (NetCDF-3, NetCDF-4/HDF5, NetCDF-4/HDF5 classic and 64-bit Offset format), which may easily lead to confusion (Rew et al., 2011, Appendix C). Since March, 2011 the NetCDF-4/ HDF5 file format is standard and has been approved and recommended by NASA Earth Science Data Systems (http://earthdata.nasa.gov/standards; accessed: 13/03/2017), and NetCDF Classic and 64-bit Offset Format are standards recognized by the Open Geos-patial Consortium (OGC; http://www.opengeospatial.org, accessed: 13/03/2017). In general, NetCDF data is binary, self/describing and portable–meaning that all computer platforms, regardless of their approaches towards integer storage, characters and floating point numbers can access such data (Rew et al.,2011). A variable represents a multidimen-sional array of values of the same type. The dimension specifies the variable shape, common grid and coordinate system. An attribute holds the properties of data sets (global attribute) or specific variable (e.g. units), but attributes cannot be multidimen-sional (Rew et al., 2011). The other important role of attributes is the implementation of conventions. Typically, it is a name of an attribute rather than the name of the variable
Figure 2.Main families of empirical/statistical downscaling (adapted from Bi et al.,2017).
that is subject to standardization. The NetCDF Climate and Forest Conventions dictates the organization of the data in the climate domain (Eaton et al.,2011).
The NetCDF-4/HDF5 represents the file format providing the most enhanced capabili-ties. The deployment of HDF5 as storage layer removes many of the restrictions common to the 64-bit offset and the classic NetCDF files. The model allows for user-defined data types including more primitive types as strings, larger variable sizes and supports multiple unlimited dimensions. Furthermore, the HDF5 storage layer allows for per-variable com-pression, multidimensional tailing and dynamic scheme changes, meaning that there is no need to copy data when adding a new variable. Finally, when reading and writing NetCDF-4/HDF5 files, the parallel I/O (input/output) is supported, thus the computational per-formance is significantly improved [7.3.4. Parallel I/O], which is of extraordinary impor-tance when handling large multi-model ensembles of climate projections due to large number of files.
The cost of the above-mentioned power and flexibility comes in software applicability. Most of existing NetCDF software is only compatible with the classic data model and it is not capable of handling the additional complexity [triangle/diagram reference]. This brings the necessity of installation of multiple SW libraries, but the more important chal-lenge, reported by NetCDF users, is the shortcoming of Windows platform support in comparison with Linux (https://earthdata.nasa.gov/standards/netcdf-4hdf5-file-format; accessed: 15/03/2017). Additionally, some of GCM/RCM simulations come on unconven-tional grids (e.g. False North Pole rotated native grid for European domains of EURO-CORDEX experiment). They can be easily re-rotated (https://www.earthsystemcog.org/ projects/cog/faq_data/; accessed: 17/03/2017), but not by tools commonly used by classical geographers, urban planners or statistics practitioners. Somewhat extensive lists of SW tools to conveniently handle NetCDF data can be found in https://www.unidata.ucar. edu/software/netcdf/software.html(accessed: 23/03/2017).
Apart from data format, the second practical challenge of the deployment of the full multi-model climate ensembles is simply the amount of data in terms of both-data volume and large quantity of files generated by GCM/RCMs. We will use an example to illustrate the data amount necessary to work within the context of climate projections. Multiple variables such a precipitation, maximum and minimum temperatures, solar radi-ation, relative humidity and wind speed are of interest for impact studies (Wilby et al.,
2004). Here, for simplicity, only one variable will be considered for illustration purposes. We selected the EURO-CORDEX (Jacob et al.,2014) multi-model ensemble since it rep-resents the cutting edge, fine scale set of climate simulations and it is openly available. Fur-thermore, for the sake of simplicity, we are only considering a single climate scenario (e.g. RCP 8.5), but note that in a real climate impact assessment exercise all the following numbers would be multiplied by the number of required variables, and then the data for each scenario would also be added. Searching the data internet portal ( https://esg-dn1.nsc.liu.se/projects/esgf-liu/; accessed: 03/10/2016) with the following specifications returns approximately 620 files with 620 GB: CORDEX experiment, daily data, EUR-11 domain, historical plus RCP 8.5 runs, average temperature, time span between 1971 and 2100, and only 10 GCM/RCM models as a minimum number of ensemble members. The data comes in the form of NetCDF-4/HDF5 files–each one containing a time slice of 5 years covering the whole European domain. In Windows environment, users have an option to add the files, one by one, to the basket as in a common e-shop. However, it is