Bose-Einstein Condensation in
87Rb: Characterization of the Brazilian Experiment
E. A. L. Henn,∗ J. A. Seman, G. B. Seco, E. P. Olimpio, P. Castilho, G. Roati,† D. V. Magalh˜aes, K. M. F. Magalh˜aes, and V. S. Bagnato
Instituto de F´ısica de S˜ao Carlos, Universidade de S˜ao Paulo, Caixa Postal 369, 13560-970, S˜ao Carlos-SP, Brazil
We describe the experimental apparatus and the methods to achieve Bose-Einstein condensation in87Rb atoms. Atoms are first laser cooled in a standard double magneto-optical trap setup and then transferred into a QUIC trap. The system is brought to quantum degeneracy selectively removing the hottest atoms from the trap by radio-frequency radiation. We also present the main theoretical aspects of the Bose-Einstein condensation phenomena in atomic gases.
Keywords: Bose-Einstein condensation, quantum fluids, quantum phase transition, laser cooling and trapping, evaporative cooling.
I. INTRODUCTION
Bose-Einstein condensation (BEC) is a phase transition which only can take place in bosonic systems. In last years, the study of BEC in atomic gases has become one of the most active research topics which links together different ar-eas of physics. In quantum mechanics, BEC appears as a monochromatic giant matter wave [1]. In thermodynamics, it represents an important phase transition where a gas under-goes a change of observables, allowing the determination of a critical temperature [2]. In quantum field theory, BEC is an important demonstration of spontaneous symmetry break [3]. Condensed atoms are also an interesting window to the world of three body and many body interactions [4]. In statistical physics, BEC is a macroscopic occupation of a single quan-tum state [2]. Many other fields have advanced a lot from properties which are peculiar from BECs, and those include modern quantum computation among others.
Bose-Einstein Condensation became possible due to the great advances on laser cooling and magnetic trapping [5]. The ability to transfer light momenta to the atomic systems, in a controlled way, made possible the construction of atomic coolers, where atomic clouds at microkelvin of translational temperature are relatively easy to be obtained. Those samples are the starting point in the routes towards BEC.
A large number of atomic systems have been Bose con-densed using a combination of techniques based on laser cool-ing, conservative trapping and evaporative cooling. Rb87[6] was the first atomic species led to quantum degeneracy in 1995. Recently, Yb170[7] and K39 [8] were also Bose con-densed and now twelve different atomic species have already been Bose condensed (for the complete list prior to 2008 see Ref.[7]).
To obtain a sample Bose condensed it is necessary to build up density as well as lower the temperature in a way that the De Broglie wavelength becomes of the order of the mean dis-tance between particles. In other words,nλ3
dB≥2.612, with
∗Electronic address:[email protected]
†LENS and Dipartimento di Fisica, Universit`a di Firenze, INFN and
CNR-INFM, 50019 Sesto Fiorentino, Italy
λdB=h/
√
2πmkBT, being the thermal de Broglie wavelength.
A non homogeneous confining potential is a convenient way to reach such condition. Once there is a localized minimum for the potential, spatial compression is naturally achieved as the sample temperature lowers. One normally starts with a large number of atoms, held in a magneto-optical trap (MOT) and transfer the atomic cloud to a conservative trap. Follow-ing the conservative confinement, runaway evaporation allows to reach the necessary compromise between density and tem-perature.
To reach BEC in an atomic sample, a sequence of condi-tions has to be fulfilled. The preparation of the experimental system to have the necessary conditions is what determines the necessary time to bring a BEC experiment to function.
In a previous work [9] we have reported the observation of BEC in a gas of23Naatoms. Our experimental apparatus had instabilities mainly related to technical limitations on the laser systems and mechanical layout, which prevent us to keep it running continuously. Indeed, this lack of reproducibility was not related to the atomic species itself. Experimental systems that produce BEC in23Naatoms can be as well succeded as any other system [10]. In our case, because of these technical reasons, we decided to move to a simpler system to observe and study BEC in a gas of87Rbatoms.
In this paper we present a detailed description of the exper-imental setup that led us to observe BEC in a gas of 87Rb atoms. In fact, our system is very similar to the double-chamber systems for producing BEC, which is a very com-mon setup with several variants. Nevertheless this is not the only way to design it: Zeeman slowed beams for loading the trap is another very common setup and both these configura-tions cover most of the experimental setups presently work-ing. Special attention is given to provide basic concepts on the parameters evaluated in our system.
II. EXPERIMENTAL SETUP
Transference
tube Second
cell
MOT
FirstMOTcell
To ion and Ti-Sublimation pumps
To ion pump
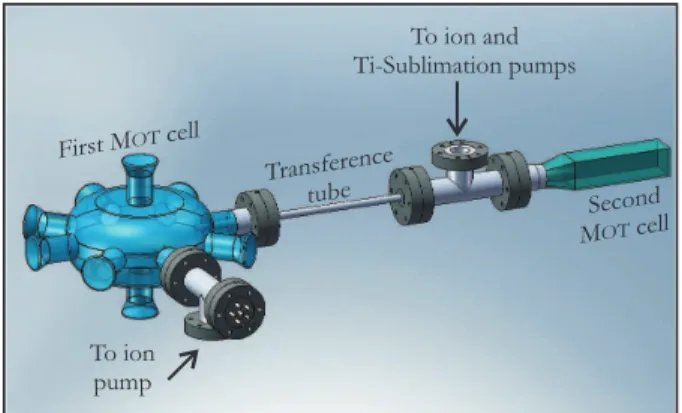
FIG. 1: Schematic view of the vacuum system showing the first and second chambers, the transference tube and the pumping ports.
a large number of trapped atoms in a conservative trap and a very low background pressure of untrapped atoms. These two conditions usually exclude each other unless one uses a slowed beam of atoms ending in a single chamber or a double-chamber configuration like ours.
The overall view of the vacuum system is shown in Fig. 1. The first chamber is made of Pyrex and contains ten windows and a vacuum port. Atoms collected in this first chamber are pushed through a narrow tube (4mmwide and 40 cmlong) to a second chamber. The connection of the first to the sec-ond chamber through this narrow tube allows a differential pressure of the order of 102, which means keeping the second chamber at a very low pressure even when the first one is filled withRb-vapor. The first chamber pressure (∼10−9Torr) is kept by an ion pump, while the second chamber (with a pres-sure smaller than 10−11 Torr) has a combination of ion and Ti-sublimation pumps. This second chamber is a Hellma cell also made of Pyrex, 6cmlong and with 3×3cmsquare cross-section.
We useRb-metal dispensers [11] to coat the first cell walls with aRbfilm. With the dispensers turned off we turn on six UV-LEDs [12] placed around the first cell. Each LED pro-vides around 350mW of light at 395nmand acts like desor-ber for the Rbfilm. ThisRbgas is collected in a MOT and up to 109atoms are trapped in this way. As soon as the LEDs are turned off, the vapor is readsorbed by the walls. This tech-nique is known asLIADand has been well described and char-acterized elsewhere [13].
The first MOT acts like a cold atom source for loading the second MOT. A continuous, 1 mW power push beam [14] transfers the atoms through the tube from one cell to the other, where they are captured. This second MOT loads up to 109 atoms in 35s, that gives a mean flux of 3×10⁷atoms/s.
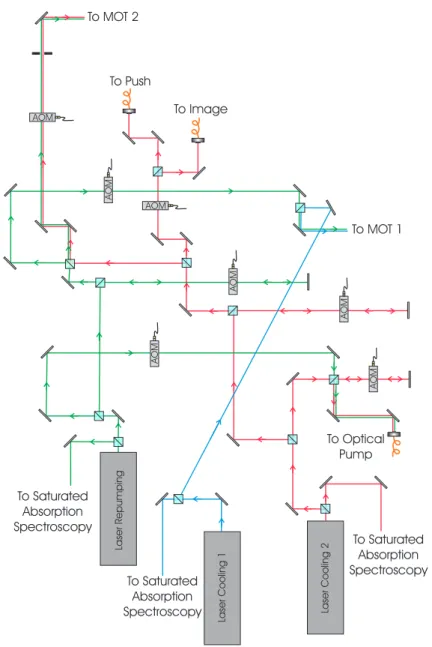
Three different laser systems (TOPTICA DLX-110L) and several AOMs provide all necessary frequencies for the exper-iment. A layout of the laser system and the employed optics is presented in Fig. 2 and all the laser frequencies for this exper-iment are represented in Fig. 3. All the lasers are locked ex-ternally using saturated absorption technique, and all of them have linewidths better than 1 MHz. Optical isolators with sup-pression on the level of 60 dB prevent feedback from
backre-flection or backscattered light.
One laser system is fully dedicated to generate the cool-ing light for the first MOT. Only just before the beam ex-pansion stage it is superimposed to the repumper light. The repumper frequency is generated by other laser system and after being produced, its light is divided and a small por-tion passes through an AOM, in order to generate one of the frequencies for the optical pumping process (5S1/2(F = 1)→5P3/2(F =2)). The major portion goes through an AOM in double-pass configuration, so the frequency of the laser can be tuned with minimal misalignment. This light is then almost equally divided, so part goes through a switching AOM, and then to be superimposed to the first MOT ing light, and part is superimposed to the second MOT cool-ing light. The coolcool-ing light for the second MOT is generated by the third laser system. Like the repumper, a small por-tion is taken to generate the other optical pumping frequency (5S1/2(F =2)→5P3/2(F =2)), then light goes through a double-pass AOM to allow frequency sweep with minimal misalignment for the optical molasses and imaging processes. Afterwards, another small portion is taken and goes through a switching AOM, then is divided and each of these is inserted into a PM optical fiber. These beams correspond to the push and imaging frequencies. The largest portion is then super-imposed to the repumper light and both go through a switch AOM and a 50µmpinhole, so we obtain 100mW of cooling light and 20mWof repumper light with a good gaussian spa-tial profile. This beam is then expanded and goes to the second MOT chamber. Both optical pumping frequencies are also su-perimposed and inserted into a PM optical fiber.
After the second MOT load is completed, the atoms are transferred into a full magnetic trap. Connecting these two stages, three different processes take place: MOT compres-sion, optical molasses and spin-polarization. The first con-sists of changing the cooling laser frequency from its original ∆=−20MHzdetuning to∆=−50MHzfor 6ms. The rate of photon scattering is tremendously lowered and the atoms are compressed to the center of the trap. Following this, the mag-netic field is turned off for 4msand sub-doppler cooling takes place. Finally, both cooling and repumper light are turned off, a homogeneous bias field is applied and a two-frequency light pulse pump all the atoms to the state|2,2 . This spin-polarization is needed because the pure magnetic trap holds only low-field-seeker states.
Once the cloud is spin-polarized, the magnetic field is turned on and the atoms are held in a spherical quadrupole with an axial gradient of 180Gauss/cm which is raised to 600Gauss/cmin 500ms. The atoms are then transferred into a QUIC trap [15] in 800ms.
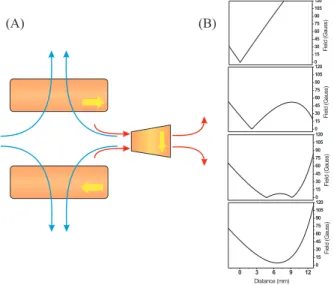
The QUIC trap, shown in Fig.4(A), is composed of a quadrupole field generated by two coils operating in anti-Helmholtz configuration and an Ioffe coil. A current Iq
through the quadrupole coils produces a spherical quadru-pole trap. This trap can be converted into a QUIC by turn-ing on the currentIIo f f e, which circulates through the Ioffe
coil. On the sequence of profiles in Fig.4(B) one can ob-serve the evolution of the magnetic potential as IIo f f e
mag-Laser
Cooling
2
AOM
AOM
To Saturated Absorption Spectroscopy To Optical
Pump To Image
To Push To MOT 2
AOM
AOM
AOM
To MOT 1
Laser
Cooling
1
To Saturated Absorption Spectroscopy
AOM
Laser
R
epumping
To Saturated Absorption Spectroscopy
AOM
FIG. 2: Layout of the laser system, showing the three laser systems and main optical components. Waveplates and lenses are not shown for simplicity.
netic zero existent on the quadrupole center is progressively shifted towards the coil. At some current level, a second zero appears closer to the coil. At the final level of current (24A) the two minima merge together, generating the quic trap with a bias field at the center. At the end stage, the overall trapping potential felt by weak-field-seeker atoms is given byU(x,y,z) =U0+1
2m
ω2
xx2+ω2yy2+ω2zz2
, where ωx∼ωy=9ω0andωz∼ω0, withω0∼23Hz. Such a large
anisotropy produces a cigar-shaped atomic cloud.
Once atoms are transferred to the QUIC, evaporation is used to obtain lower temperatures. Evaporation is done using an antenna irradiating Radio-Frequency (RF), that produces a spin-flip transition, transforming trappable into untrappable atoms. For a given value of RF only atoms at specific mag-netic field amplitude are affected and ejected from the trap. Sweeping from a high to a low value of frequency we can
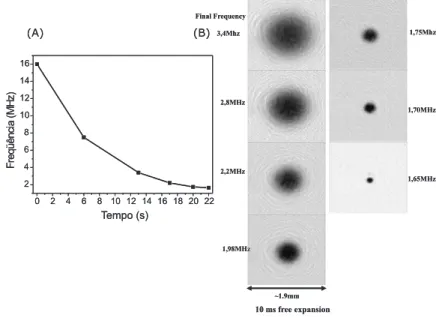
force evaporation while colder atoms accumulate at the trap center. If this sweeping of RF is performed in an optimized rate, a great increase of phase-space density is achieved. The RF was scanned from 16MHzdown to the point where BEC takes place (∼1.6MHz). To optimize the RF sweeping, one must investigate the best time-dependence for the frequency. Fig. 5(A) shows the optimized ramp for our experiment and Fig. 5(B) exhibits a sequence of Time-of-Flight absorption measurements showing a considerably degree of cooling and phase-space increasing.
The cooling process on the atomic cloud is observed through absorption of a probe laser beam resonant with the F =2 →F′ =3 transition. The propagation of the probe beam on the y-direction, produces a two-dimensional intensity profile I(x,z) =I0exp[−α(x,z)], where α(x,z) =
−σ
5 S
2 1/25 P
2 3/2 F=3 F=2 F=1 F=0 F=2 F=1780nm
T
rapping
R
epumper
Push
Probe
Op
.
P
ump
.
F=2
F=2
Op
.
P
ump
.
F=1
F=2
FIG. 3:87Rb D2transition hyperfine structure, with frequency
split-tings between the hyperfine energy levels. The frequencies used in the experiment are shown.
0 15 30 45 60 75 90 105 120 F iel d (G auss) 0 15 30 45 60 75 90 105 120 F iel d (G auss) 0 15 30 45 60 75 90 105 120 F iel d (G auss)
0 3 6 9 12
0 15 30 45 60 75 90 105 120 Distance (mm) F iel d (G auss) (B) (A)
FIG. 4: (A) Schematic configuration of coils of the QUIC trap and (B) a sequence of magnetic field profiles as the Ioffe current is in-creased.
n(x,y,z) its density. An integration of α(x,z) along the xz plane provides the total number of atoms in the sample:
N=1 σ
α(x,z)dxdz (1)
whereσ is the absorption cross section for a near resonant light. For the transition 5S1/2→5P3/2,σ≈σ0/1+4∆Γ2 withσ0=1.4×10⁻⁹cm2[16].
Figure 6 summarizes the techniques used in this process and all the related time scales.
III. OBSERVING BOSE-EINSTEIN CONDENSATION
To observe BEC in the sample, it is necessary an efficient evaporative cooling. To achieve efficient evaporation the first requirement is that the rate of elastic collisions, γ=nσelv,
which are responsible for the rethermalization of the sam-ple, overcomes the rate of inelastic collisions, which remove atoms from the trap, wherenis the particle density,σelis the
elastic collision cross-section, andvdenotes the average ther-mal velocity [17]. Then, to well succeed in evaporation it is necessary to haveγovercoming the loss rate during the whole process, even with the decreasing in the atomic number. The important parameter to be observed is the phase-space-density (D), or the number of atoms per cubic de Broglie wavelength. One can calculateDasD=nλ3
D, which for87Rb can be
ex-pressed as
D=6.67n T3/210−
24 (2)
wherenis expressed asparticles/cm3andT in Kelvin. For a harmonic trap, density varies with temperature asn∝N/T3/2, such thatD∝N/T3. An efficient evaporation demands that T decreases faster thanN, to increaseD. One can show that the evolution ofN withT must obey a relation likeN∝Ts withs≤1 to fulfill the conditions for an efficient runaway evaporation [18]. Smaller the value ofs, greater evaporation efficiency is achieved. For a harmonic trap, it is shown that the critical temperatureTcis related to the number of particles
bykBTc=0.941ωN1/3[19]. This relation sets, in some sense,
the critical line for the observation of BEC.
The graph shown in Fig. 7 represents the route followed by the number of trapped particles as a function of tempera-ture in our experiment. The first fact to be observed is that s≈0.73±0.04, showing the occurrence of runaway evapora-tion. For a temperature around 160nK the quantum degen-eracy border is crossed and condensation is observed, with a number of about 7×10⁵particles. At the critical temperature, the peak density of atoms corresponds to 4×1013cm−3. Pure condensates containing 2×10⁵atoms are observed.
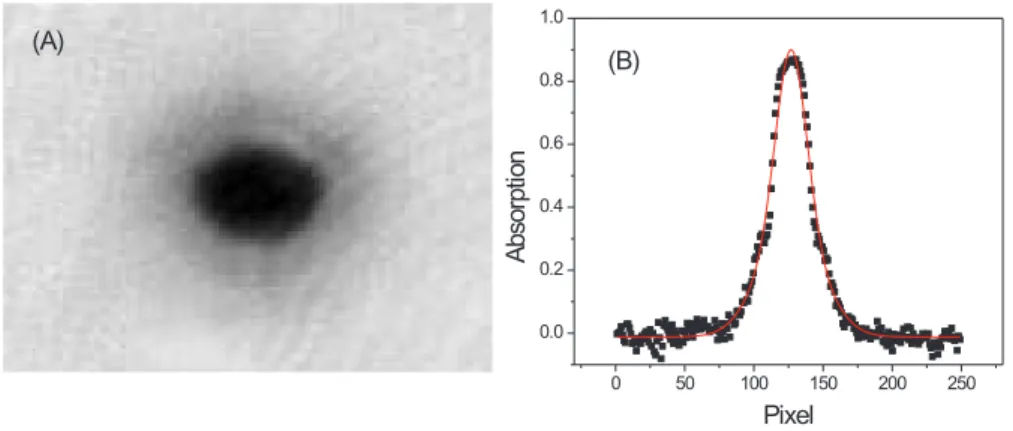
Besides reachingD≥2.6, there are a few signatures that happen together with the occurrence of BEC. A dramatic change in the shape of the spatial density profile, as observed by absorption, is the most important signature of BEC. As recorded by our CCD camera, the point just below BEC is shown in Fig. 8(A), together with the cut of the density profile (Fig. 8(B)). At condensation, the traditional Gaussian density profile for the trapped cloud is suddenly changed by the ap-pearance of a peak, with a great deviation. The observed peak has a parabolic shape and it is due to the dominance of inter-actions in this sample at the existent conditions of density and temperature.
~1.9mm Final Frequency
3,4Mhz
2,8MHz
2,2MHz
1,98MHz
1,75Mhz
1,70MHz
1,65MHz
10 ms free expansion
0 2 4 6 8 10 12 14 16 18 20 22 2
4 6 8 10 12 14 16
F
re
qüênci
a
(M
H
z)
Tempo (s)
(A) (B)
~1.9mm Final Frequency
3,4Mhz
2,8MHz
2,2MHz
1,98MHz
1,75Mhz
1,70MHz
1,65MHz
10 ms free expansion
0 2 4 6 8 10 12 14 16 18 20 22 2
4 6 8 10 12 14 16
F
re
qüênci
a
(M
H
z)
Tempo (s)
(A) (B)
FIG. 5: (A) Evaporation frequency as a function of time, and (B) sequence of 10mstime-of-flight absorption measurements showing the cloud evolution as the evaporation frequency is decreased.
Magneto Optical Trapping
MOT compression, Sub-Doppler Cooling and spin-polarization
Magnetic Trapping
Evaporative Cooling
TOF imaging BEC observation
Loading ~ 35s
~10ms
~22s
~15ms
FIG. 6: Experimental and time sequence of the experiment.
−
2 2M∇
2+U(r) + g|Ψ|2
Ψ=µΨ, (3)
which is basically the Schr¨odinger equation with an extra term, proportional to|Ψ|2, from interactions. The coupling constant is
g=4π 2Na
M , (4)
withabeing the s-wave scattering length. The chemical po-tential µ represents the energy of an individual atom in the presence of all the others.
At ultra-low temperatures, the Gross-Pitaevskii equation can be approximated by an algebraic equation when interac-tion is the dominant term. This is the so-called Thomas-Fermi
FIG. 7: Evolution of the number of trapped particles as the tem-perature of the sample decreases, showing an efficient evaporative cooling and the crossing of the transition boundary.
regime, where the kinetic energy term can be neglected when compared to the others. In this case
U(r) +g|Ψ|2Ψ=µΨ,
(5)
such that for the region whereΨ=0,
|Ψ|2=µ−U(r)
g , (6)
since N|Ψ|2=n(r), forU(r) = 1 2m
ω2
xx2+ω2yy2+ω2zz2
(A)
0 50 100 150 200 250 0.0
0.2 0.4 0.6 0.8 1.0
Ab
so
rp
tio
n
Pixel (B)
FIG. 8: Onset of condensation just below critical temperature, showing (A) the absorption CCD camera picture and (B) absorption profile showing the double spatial distribution, which is well fitted by a combination of a gaussian profile for the thermal cloud and an inverted parabola profile for the condensed cloud.
n(r) =n0
1−
x Rx
2
+
y Ry
2
+
x Rx
2
, (7)
wheren0is the atomic density at the center of the condensate andRiis determined as 12mω2iRi2=µ, fori=x,y,z.
FIG. 9: Sequence of images showing the apperance of BEC as the evaporation Radio-Frequency is lowered. The first image is well fit-ted by a gaussian profile as it is above the transition. The last image is fitted by an inverted parabola characteristic of the Thomas-Fermi profile.
In Fig. 9, we observe a sequence of images going from a pure thermal cloud until an almost pure sample of condensate atoms. Observe that while the thermal cloud (non-condensate fraction) is well fitted by a Gaussian function, the condensate is well fitted by the inverted parabola.
The combination of fitting within the density profile, allows separating the condensate fraction. On Fig. 10, the condensate fraction as a function of temperature is presented. For a repul-sive harmonic trapped gas, a first order approximation pre-dicts that the expected fraction of condensate atoms is given
byN0
N =1−
T Tc
3
−4λa dB
T Tc
7/2
[19], applying this relation
FIG. 10: Condensed particles fraction as a function of the temper-ature of the sample and theoretical fitting from which we obtain 142nK for the critical temperature.
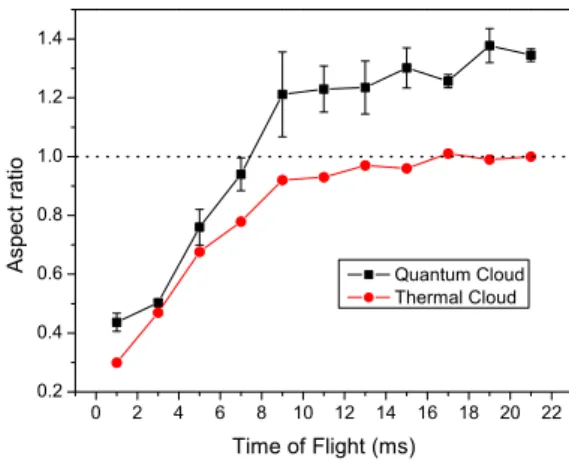
FIG. 12: Expansion of a BEC as a funtion of time showing the typical inversion of aspect ratio of the quantum cloud.
FIG. 13: Aspect ratio for a classical (circles) and a quantum (squares) cloud as a function of the expansion time.
to our data, we observed a good adjustment with λa
dB ≈0.01. For87Rb,a≈5nmand atT≈160nK,λdB≈0.5µm, showing
good agreement in first order correction.
The asymmetric velocity distribution of the expanded cloud is another clear indication of BEC. Before reaching BEC (aboveTc), the cloud expands spherically, as expected from
thermal atoms. An example of such expansion is shown on Fig. 11. We start having the aspect ratio between the two di-mensions of the cloud as the ratio of the trap frequencies. As the cloud expands it turns into a spherical expanding cloud. On the other hand, for a condensate cloud of atoms, during the expansion, the cloud suffers an inversion of the aspect ra-tio, as presented in Fig. 12. For the condensate, as the ex-pansion takes place, the conversion of interaction energy into motion does not follow the thermal equilibrium arguments for the thermal clouds. A better comparison can be made observ-ing Fig. 13, where the numerical aspect ratio for a thermal cloud and for a condensate are plotted as a function of the expansion time. At the beginning, the aspect ratio for both clouds evolves in a similar way. Sooner the quantum gas and the thermal gas start to deviate from each other. After a time in which the thermal cloud starts to expand isotropically (as-pect ratio equal to 1) the condensate shows the inversion ratio and the aspect ratio becomes larger than unity.
The observation of the aspect ratio inversion is an undoubt-edly signature for BEC, which could not take place otherwise.
IV. CONCLUSIONS
In this paper we have described step by step the experimen-tal realization of Bose-Einstein Condensation for a sample of 87Rbatoms held in a QUIC-type trap. The typical number of atoms in the BEC is 2×10⁵and the critical temperatureTcis
about 100nK.
We have started to use the condensate sample to pursue studies involving different aspects of the condensate, like non-zero temperature corrections and topological-like excitations. The experimental observation of these excitations will be pub-lished in future works [20].
[1] M.-O. Mewes, M. R. Andrews, D. M. Kurn, D. S. Durfee, C. G. Townsend, and W. Ketterle, Phys. Rev. Lett.78, 582 (1997). [2] K. Huang,Introduction to Statistical Physics(Taylor & Francis,
New York, 2001).
[3] J. I. Kapusta, Phys. Rev. D24, 426 (1981).
[4] I. Bloch, J. Dalibard, and W. Zwerger, arXiv:0704.3011v2 [cond-mat.other] 17 Oct 2007.
[5] H. J. Metcalf, and P. van der Straten, J. Opt. Soc. Am. B20, 887 (2003).
[6] M. H. Anderson, J. R. Ensher, M. R. Matthews, C. E. Wieman, and E. A. Cornell, Science269, 198 (1995).
[7] T. Fukuhara, S. Sugawa, and Y. Takahashi, Phys. Rev. A76, 051604(R) (2007).
[8] G. Roati, M. Zaccanti, C. D’Errico, J. Catani, M. Modugno, A. Simoni, M. Inguscio, and G. Modugno, Phys. Rev. Lett.99, 010403 (2007)
[9] K. M. F. Magalh˜aes, S. R. Muniz, E. A. L. Henn, R. R. Silva, L. G. Marcassa, and V.S. Bagnato, Laser Phys. Lett.2, 214 (2005). [10] E. W. Streed, A. P. Chikkatur, T. L. Gustavson, M. Boyd, Y. Torii, D. Schneble, G. K. Campbell, D. E. Pritchard, and W. Ketterle, Rev. Sci. Instrum.77, 023106 (2006).
[11] Alkali Metal Dispensers - SAES getters. [12] Ultravioet Edixeon, model EDEV-3LA1.
[13] C. Klempt, T. van Zoest, T. Henninger, O. Topic, E. Rasel, W. Ertmer, and J. Arlt, Phys. Rev. A73, 013410 (2006).
Eur. Phys. J. D15, 245 (2001).
[15] T. Esslinger, I. Bloch, and T. W. H¨ansch, Phys. Rev. A, 58, R2664 (1998).
[16] D. A. Steck, Rubidium 87 D Line Data,
http://steck.us/alkalidata (2003)
[17] W. Ketterle, and N. J. van Druten, in Advances in Atomic, Molecular and Optical Physics, edited by B. Bederson and H. Walther (Academic Press, San Diego, 1996), No. 36.
[18] J. E. Lye, C. S. Fletcher, U. Kallman, H.-A. Bachor, and J. D.
Close, J. Opt. B: Quantum Semiclass. Opt.4, 57 (2002). [19] V. Bagnato, D. E. Pritchard, and D. Kleppner Phys. Rev. A35,
4354 (1987).