Printed in Brazil - ©2006 Sociedade Brasileira de Química 0103 - 5053 $6.00+0.00
Article
*e-mail: [email protected]
Thermal Analysis of Brazilian Tropical Soils Originating from Different Sources
Silvana A. M. Critter and Claudio Airoldi*
Instituto de Química, Universidade Estadual de Campinas, CP 6154, 13084-971 Campinas - SP, Brazil
As amostras de solos tropicais brasileiros foram analisadas pelas técnicas térmicas termogravimetria (TG) e calorimetria exploratória diferencial (DSC) em atmosferas de ar sintético ou argônio. Nesse processo foi investigado o solo eutrudox Ródico com vegetação de floresta, queimado ou não em plantação de cana de açúcar, e aquele de fase arenosa com vegetação de cerrado. A partir da fração orgânica do solo, foram extraídos ácidos húmicos que se decompõem similarmente ao produto comercial, de acordo com as etapas: i) água adsorvida, desidratação, descarboxilação e perda de moléculas orgânicas,
ii) decomposição da fração termolábil, iii) matéria orgânica macromolecular e iv) resíduos acima de 950 oC. As curvas de DSC deram correspondentes picos de perda de água perto de 100 oC e exotérmicos em temperatura maior que 300 oC, atribuídos à combustão de fração de matéria orgânica termolábil. As curvas TG dos solos são mais complexas que os ácidos húmicos, devido aos componentes inorgânicos, caracterizando os estágios: i) desidratação, ii) matéria orgânica termolábil, iii) domínio orgânico macromolecular, e iv) resíduos de óxidos. Essas decomposições correspondem a três picos endotérmicos em DSC e um exotérmico mostrado em atmosfera de ar sintético, atribuído à combustão da fração orgânica macromolecular na região de 300 oC. As curvas de DSC dos solos provenientes de plantação de cana de açúcar mostraram picos endotérmicos mais intensos do que aqueles de solo de floresta. Os resultados térmicos demonstram a influência do material orgânico, que é altamente influenciado pelo componente mineral com alto teor de resíduo, pelo uso na atividade da terra e também pelos processos de queimadas.
Brazilian tropical Latosol soil samples were thermally analyzed associating thermogravimetric (TG) and differential scanning calorimetric (DSC) techniques under synthetic air or argon atmospheres. Rhodic eutrudox soils with forest vegetation, from unburnt and burnt cane plantations and that of a sandy phase having cerrado vegetation were investigated. From the organic soil fraction humic acids were extracted that decompose similarly to the commercial product, following the steps: i) adsorbed water, dehydrations, decarboxylations and release of organic molecules, ii) thermolabile decomposition fraction, iii) macromolecular organic matter and iv) residues. The DSC curves gave the corresponding peak for water release near 100 oC and exothermic peaks at temperatures higher than 300 oC, attributed to the combustion of thermolabile organic matter. The TG curves for all soil samples are more complex than those of the humic acids due to the inorganic components, being characterized by stages i) dehydration process, ii) thermolabile organic matter, iii) macromolecular organic domain and iv) oxide residues. These steps of decomposition correspond to three endothermic DSC peaks and one exothermic peak clearly shown under a synthetic air atmosphere, being attributed to the combustion of the macromolecular organic fraction near 300 oC. The DSC curves from burnt and unburnt red Latosol soils from sugar cane cultivation showed more intense endothermic peaks than those of the forest. These thermal results show the influence of both the type and the organic matter contents on curve profiles, which are highly influenced by the soil mineral compositions and land-use activities, as well as the burning processes.
Keywords: latosol soil, inorganic compounds, organic fraction, cane sugar plantation,
thermogravimetry, differential scanning calorimetry
Introduction
Thermal analytical techniques are useful to obtain information on physical and chemical properties of a given
influenced by heating rate, mass of samples, gas flow rate, sample packing and the gaseous atmosphere. This technique can contribute to understanding the heating effects on soil components such as loss of water, organic matter combustion and clay dehydroxylation, in order to compare the relative abundance of more and less labile carbon sources.1-3 The differential scanning calorimetric
(DSC) method is convenient for such studies as it is a rapid technique to give characteristic curves, whose variation in enthalpy is associated with phase changes in mineral or soil organic matter (OM), reflecting events
related to structures and chemical compositions.4
Normally, these technique associations offer a convenient advantage to obtain a relatively rapid analysis for trace variations in a given system, originating from different soil samples.5
The major soil constituents include carbonates, organic matter, sand and clay,4 that can undergo thermal reactions
when heated from 25 to 1000 oC. The original OM
components are closely related to many properties of soils such as structure, moisture content, release of nutrients
for plants and agrochemical immobilizations,6 and
strongly influences the type and amount of soil biomass.7
OM composition and molecular structure is an exciting analytical problem due to the small concentrations found in samples, organo-mineral complex formation and
stabilization by minerals.8 The thermal behavior of soil
components is influenced by the stable microstructure caused by aggregation of negatively charged kaolinites and positively charged gibbsite and goethite, as observed for the savanna oxisols.7 For example, the DSC applied to
kaolinite presented two endothermic peaks attributed to
water elimination and dehydroxylation processes.9
Meanwhile, studies involving structural modification and OM loss in soils after an Atlantic forest fire showed organic fraction decomposition and the ignition temperature was estimated.10
The application of TG-DSC experiments can examine the burnt and unburnt soil samples, originated from different sources, with the purpose to show how land-use can impact damages to the ecosystem. However, this approach is closely related to soil preparation for diverse cultivations in Brazil. During the last few decades, the annual burning of weeds and residues has been common practice in agriculture to reduce insect populations and also to clear the terrain, for example, to cultivate sugar
cane.11 However, fire damage can modify physical
properties and cause soil organic matter destruction. The change in OM content presumably depends on the fire intensity, but it is not easy to determine the temperature reached by soil during a fire, because many factors are
involved, such as the amount, quality, and humidity of fuel, wind conditions, soil characteristics and fire
duration.12 Organic matter destruction by fire causes
principally nitrogen volatilization, loss of phosphates, carbonates and other important nutrients for plants that maintain the sustainability of soils, and reintroduction of these components can take many years. The wildfire process not only destroys the organic matter and produces soil erosion, but also results in dynamic changes of the
organic matter that remains in the soil after the fire.13
Moreover, the results of this practice change the vegetation and, consequently, the soil fertility and stability decrease.14,15
Amongst the components involved in soil comple-xities, the OM fraction content is influenced by several factors, including the composition, an aspect that can be demonstrated through calorimetric determinations. A study concerned with pristine, management and compost soil samples showed a stimulated enrichment of the microbiota community at room temperature, by using degradable carbon and nitrogen sources, in the presence of humidity. Under these conditions, the microbial growth closely correlated with carbon dioxide evolution, in agreement with the soil composition.16,17 On the contrary,
indiscriminate fire can drastically disturb an ecosystem, for example, as done in managing sugar cane plantations. Thus, the aim of the present investigation is to report the thermal effect caused on OM fraction during processes of burning soil, when compared with natural Latosol, forest and savanna vegetation soils. In addition, the main organic fraction extracted from soil, the humic acid, was also thermally investigated in order to establish similarities with soil sample decompositions.
Experimental
Soil samples
Samples of red Latosol (RL), a Rhodic eutrudox soil,
were collected from: i) covered bush vegetation on the
campus of the State University of Campinas, São Paulo, Brazil, from 0 to 10 cm, ii) unburnt sugar cane plantation soil (RSQ) at 0 - 10 cm, which was used as control; and burnt soil (RQ) from the same plantation. Sampling was collected in two distinct layers from the surface, RQ1 at 0 to 2 and RQ2 at 2 to 5 cm. The other soil sample was a red-yellow sandy phase (CL) Latosol from typical Brazilian savanna vegetation (cerrado), taken at Corumbataí, state of São Paulo, Brazil. In all cases the soil sample collections followed well-established
< 0.149 mm to separate roots, fragments and large
particles, then stored in polyethylene bags at 20 ± 2 oC
until thermal analysis.16,17,19 This procedure had been
previously established for microbial investigations.16,17,20
Commercial humic acid (HA) (Aldrich) was assayed as received. This material was acquired as an indicative sample to compare its thermal analysis with those obtained with the soils.
Soil analysis
Routine methods were used to characterize all soil samples. The percentage of moisture content was determined by drying the soil sample to a constant mass
at 110 ± 2 oC. The organic matter was determined by
titrating samples in an acidic medium, following the end point by redox reaction with potassium dichromate. The pH was obtained in a strong electrolyte, 1.0 mol dm-3 CaCl
2
in a proportion of 1:2.5 for soil/solution. The cation exchange capacity (CEC) and total acidity represent the sums of exchangeable bases (Mg2+, K+, and Na+) and of
(H+ + Al3+), respectively. The total acidity was determined
by percolating 5.0 g of dry fine soil in air with 0.10 dm3
of 2.0 mol dm-3 calcium acetate at pH 7.0. The CEC and
total extracted bases (SB) were obtained by extracting a percolated fraction of 10.0 g of the soil with 0.10 mol
dm-3 nitric acid solution. The content of magnesium,
aluminum and calcium was obtained with a model 5000 Perkin Elmer atomic absorption spectrometer with automatic absorption control while flame photometry was employed to determine sodium and potassium cations, using a previously established calibration curve. Each measurement was performed in triplicate, with an uncertainty less than ± 5%.18,20
Humic acid extractions
Humic acids were extracted from red Latosol (HR) and red-yellow sandy phase Latosol (HC) soils. The soil
samples were treated with 0.10 mol dm-3 Na
4P2O7 with a
soil:solution ratio of 1:100 for humic substance extraction.
The alkaline solution was acidified to pH 1 with H2SO4
and centrifuged at 3000 rpm to separate fulvic and humic acids. The separated humic acid was dissolved in 0.1% (m/m) NaOH solution and was twice precipitated by
acidification to pH 1 with H2SO4. Mineral material was
removed by shaking with a 1:1 HCl/HF solution for 5 h. The purified humic acid samples were washed with distilled water, dissolved in 5.0×10⁻³ mol dm-3 NaOH and
centrifuged at 3000 rpm to remove all inorganic salts and finally air-dried and then freeze-dried, as recommended
by the International Humic Substances Society.21 The grain
size fraction used was smaller than 0.149 mm.
Thermal analyses
The TG and DSC curves were carried out in duplicate using a DuPont model 9900 system. The samples varied in weight from 5.32 to 16.38 mg for humic acids and, 9.11 to 18.65 g for soil samples. For DSC assays, in duplicate, the samples were heated continuously from room temperature up to 600 oC. Heating was up to 1100 oC for TG at a heating
rate of 10 oC min-1 under synthetic air or argon atmospheres.
The DSC samples were encapsulated in standard platinum sample cups and indium was used as the standard for calibrating the temperature axis and the corresponding enthalpy output.22
Results and Discussion
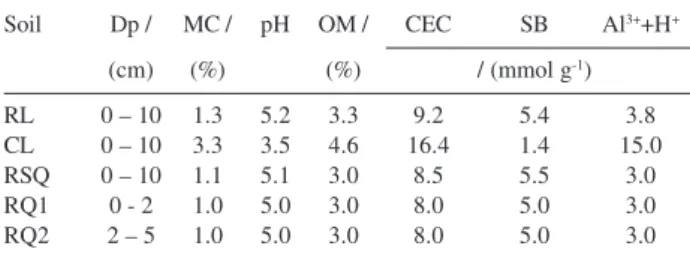
The main soil properties are listed in Table 1 and reflect the distinct chemical characteristics of red Latosol (RL) soil in comparison with red-yellow sandy phase (CL) Latosol.16,17,23 Both soils are acidic with pH of 5.2 and 3.5,
and rich in organic matter, 3.3 and 4.6%, respectively. The CL soil presented the largest total acidity behavior,
15.0 mmol g-1. The red Latosol soil from a sugar cane
plantation (RSQ, RQ1 and RQ2) presented pH, OM, CEC and SB values lower than those of a typical red Latosol soil. On the other hand, the soil properties are influenced by mineralogical components, which consider the silica/ aluminum ratio to classify them. From the agricultural view point, red Latosol soil is most intensively cultivated with mineral percentages of 14.0 to 23.4 for gibbsite, 47.0 to 33.8 for kaolinite and 31.0 and 23.0 for the amorphous part, and these mineral amounts reflect the effect of weathering on soils.24
Independent of the chosen soil, it is supposed to have a considerable organic composition constituted by humic Table 1. Characteristics of red Latosol soil (RL), red-yellow sandy phase (CL), unburnt RSQ and burnt RQ1 and RQ2 red Latosol soil from a sugar cane plantation. Depth (Dp), moisture content (MC), pH, soil organic matter (OM), cation exchange capacity (CEC), sum of bases (SB) and potential acidity (Al3+ + H+)
Soil Dp / MC / pH OM / CEC SB Al3++H+
(cm) (%) (%) / (mmol g-1)
RL 0 – 10 1.3 5.2 3.3 9.2 5.4 3.8
CL 0 – 10 3.3 3.5 4.6 16.4 1.4 15.0
RSQ 0 – 10 1.1 5.1 3.0 8.5 5.5 3.0
RQ1 0 - 2 1.0 5.0 3.0 8.0 5.0 3.0
acid.25,26 With the purpose to confirm the main properties
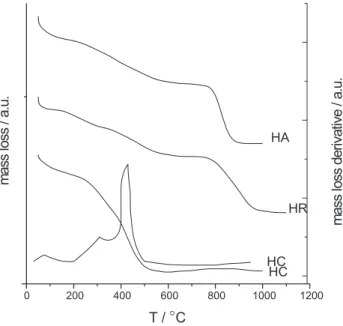
associated with the extracted fractions from two distinct sources, the properties were compared with the commercial product. In fact, the degradation stages are very similar when comparing the decomposition processes that occurred under the two different atmospheres, as shown by the results listed in Table 2, and by the TG curves in a synthetic air atmosphere for commercial humic acid and those isolated from RL and CL soils, shown in Figure 1. First mass losses of 16.6, 7.6 and 3.6% in argon and of 11.9, 3.1 and 11.1% in synthetic air were obtained. These data refer to the release of water of hydration and other reactions like dehydrations, decarboxylations of the most labile organic compounds, including volatile organic
molecules in the interval of temperature 25 to 171 oC.
This phenomenon for humic acid is supported by a low
broad peak in the 25 to 150 oC range in DTG for HC as
shown in Figure 1. The second mass losses of 22.7, 21.2 and 20.6% in an argon atmosphere and of 25.0, 33.1 and 76.4% for synthetic air, for the same sequence of humic acids were also observed. The mass loss for each set of humic acid in the specified atmospheres presents similar TG curve profiles, but with larger content of labile organic compounds for HR and HC than for HA in synthetic air. This mass loss can be attributed to the more thermolabile
character in humic acid decomposition and it refers to the phenolic groups, found in lignin units, alkylaromatics, aliphatic moieties (alkyl and O-alkyl) and other
compounds.27 The final mass losses for humic acids of
26.6, 39.6 and 33.0% in an argon atmosphere for HA, HR and HC, and 37.1, and 45.4% under synthetic air for HA and HR, respectively, were detected. In this range a greater mass loss for HR than HA is observed and attributed to an organic substance fraction of greater diversity with a higher degree of polymerization, thus having higher thermal stability and resistance to heating.
The TG curve for HC showed a rapid, continuous and large mass loss from 100 to 1000 oC and it was not easy to
establish distinct ranges of temperature. However, in the same region in the DTG curve, an inflection around 400
oC, shown in Figure 1 for synthetic air and another one
around 800 oC for the argon atmosphere were observed.
The organic matter decomposition at high temperature is an indicative behavior that could be associated with its corresponding macromolecular domain, with an expected increase in structural stability.
All decomposition processes displayed residual fractions
from 950 oC that varied from 29.0 to 42.9% under argon
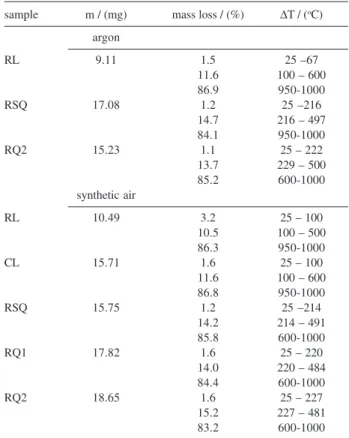
and from 12.5 to 26.0% under a synthetic air atmosphere. As expected, the incomplete decomposition is more evident in argon, when the humic acid samples are considered. Thus, the change of atmospheric from argon to synthetic air resulted in more complete oxidation due to the presence of gaseous oxygen. It is likely that these humic acid residues Table 2. Thermogravimetric data for commercial humic acid (HA) and
humic acids extracted from red Latosol soil (HR) and red-yellow sandy phase (HC), with initial mass of sample (m), mass loss in the respective ranges of temperature (ΔT) with a heating rate of 10 oC min-1
sample m / (mg) mass loss / (%) ΔT / (oC)
argon
HA 5.32 16.6 25 – 92
22.7 92 – 600
26.6 600 – 800
29.0 950-1000
HR 11.72 7.6 25 - 74
21.2 74 – 354
39.6 354 – 878
31.1 950-1000
HC 6.70 3.6 25 – 171
20.6 171 – 570
33.0 570 – 900
42.9 950 -1000
synthetic air
HA 16.38 11.9 25 – 102
25.0 102 – 493
37.1 493 – 800
26.0 950-1000
HR 8.17 3.1 25 – 160
33.1 160 – 493
45.4 493 – 800
18.4 950-1000
HC 11.91 11.1 25 – 100
76.4 100 – 800
12.5 950-1000
Figure 1. Thermogravimetric curves showing percent of mass loss at a heating rate of 10 oC min-1 under a synthetic air atmosphere for
can be represented by biomacromolecule fractions. Such aromatic heterocyclics are macromolecular compounds resistant to thermal degradation, which explains their long permanence times in soils.27
The thermogravimetric data for all soils are presented in Table 3. An illustration of TG/DTG curves is shown in Figure 2 under argon atmosphere for RL, RSQ and RQ1 soils. The first mass loss at temperatures to 222 and 227
oC under argon or synthetic air can be attributed to the
loss of water molecules, such as crystalline lattice water, that is hygroscopic water of salts belonging to organic matter.1,3 The low initial mass losses in argon and synthetic
air present similar behavior for RL and CL, corresponding to forest and cerrado vegetation, respectively. These values suggest that the mechanisms of water release are very close to each other, indicating that these molecules are weakly-bonded and their removal implies dehydration processes. The water molecule elimination occurred from the external sphere and not from the internal layers of the organic-mineral matrices and did not cause modification of the mineral structure or the organic fraction of the soils. This process is associated with a reversible phenomenon and depends not only on the thermolabile mineral content, but also on the organic components.1 In the present study,
these fractions varied from 1.2 to 3.2% and are in agreement with experimental data on moisture content, which gave values from 1.3 to 3.3%.
The second mass loss presented a very well-defined percent value that corresponds to 11.6 and 10.5, 14.7 and 14.2, and 13.7 and 15.2% for RL, RSQ and RQ2, for argon and synthetic air atmospheres, respectively. These values are similar for these Brazilian soils, including CL type with 11.6%, but the forest soil (RL) presented a smaller percent mass loss, in comparison with those from cane management (RSQ). The second mass loss process in this temperature range can be influenced by the thermally labile OM fraction and also to the presence of organic macrostructures with higher macromolecular domains in the soil.1,3
The organic matter content determined by the TG technique differs from those obtained by chemical titration with potassium dichromate. This fact implies that the peaks on the thermal analysis curves represent not only the thermolabile compounds, but also other organic constituents inherent to the soil composition in this decomposition. However, clay-mineral phase transitions could also be overlapped with these decompositions, affecting the overall decomposition process.1,3 Therefore,
the OM determination by oxy-reduction reactions can result in lower values than the actual amount, due to Table 3. Thermogravimetric data for red Latosol soil (RL), red-yellow sandy phase (CL), unburnt RSQ and burnt red Latosol soils at two depths RQ1 and RQ2, with initial mass of sample (m), mass loss in the respec-tive ranges of temperature (ΔT) with a heating rate of 10 oC min-1
sample m / (mg) mass loss / (%) ΔT / (oC)
argon
RL 9.11 1.5 25 –67
11.6 100 – 600
86.9 950-1000
RSQ 17.08 1.2 25 –216
14.7 216 – 497
84.1 950-1000
RQ2 15.23 1.1 25 – 222
13.7 229 – 500
85.2 600-1000
synthetic air
RL 10.49 3.2 25 – 100
10.5 100 – 500
86.3 950-1000
CL 15.71 1.6 25 – 100
11.6 100 – 600
86.8 950-1000
RSQ 15.75 1.2 25 –214
14.2 214 – 491
85.8 600-1000
RQ1 17.82 1.6 25 – 220
14.0 220 – 484
84.4 600-1000
RQ2 18.65 1.6 25 – 227
15.2 227 – 481
83.2 600-1000
Figure 2. Thermogravimetric curves showing percent of mass loss at a heating rate of 10 oC min-1 under an argon atmosphere for red Latosol
incomplete chemical oxidation of the organic matter, and the changes in the redox potential of soil are different from those of a standard compound. Finally, the residue for all soils, varying from 83.2 to 86.9%, refers to the components represented by a series of oxides, such as those of iron, aluminum, and manganese, as well as
silicates, quartz and others.21 These oxide components
influence the TG curves, to give a more complex profile, as expected, when compared with those obtained with the extracted humic acids, whose principal decomposition steps are basically in the same region of temperature. This behavior is in agreement with similar decomposition processes, however, with a pronounced difference in residue quantities, which is reinforced under synthetic atmosphere conditions.
The DSC curves under a synthetic air atmosphere for all humic acids are shown in Figure 3, presenting an
endothermic peak with maxima at 125, 100 and 115 oC
with variation in enthalpy (ΔH) values of 456, 157 and
169 J g-1 for HA, HR and HC, respectively. This peak is
very well-defined for HA but broad for other acids,
suggesting an overlap of phenomena: i) the mass loss of
sorbed water and ii) the possible lower organic molar mass compounds. Three other exothermic peaks at 325, 375
and 451 oC for HA are also observed. However, HR and
HC presented only a single peak at 540 and 550 oC,
respectively. These exothermic events can be attributed to the decomposition of the remaining thermolabile OM,
as previously observed using the DTA technique,28,29
indicating also differences in the curves among the three acids. As expected, the exothermic peaks are in agreement with the existence of possible aromatic components in the sample. However, less energy is involved, in comparison with the organic matter formed under tropical
temperature conditions.29 The curve for HC did not
presente well-defined peaks, reflecting instability and a continuous increase in the baseline was observed, without showing expressive changes under synthetic air.
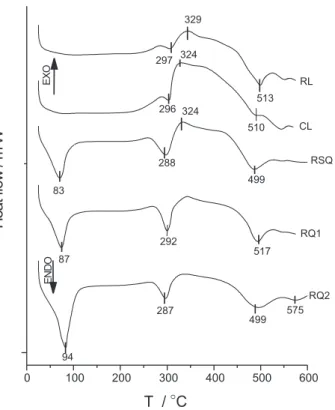
The DSC curves for all soils under synthetic air are shown in Figure 4. The endothermic profile curves for RSQ, RQ1 and RQ2 soils are very similar, presenting a set of endothermic peaks at 83, 288 and 499; 87, 292 and
517, and 94, 287 and 499 oC, respectively. However, not
well-defined peaks also appeared at 297 and 513, and 296
and 510 oC for RL and CL soils, respectively. For the
curves obtained under an argon atmosphere only two
endothermic peaks were obtained at 289 and 513 oC for
RL and 300 and 546 oC for RSQ. The first endothermic
peak could be attributed to remaining hygroscopic water and some evaporation of organic compounds during the
Figure 3. Differential scanning calorimetry for commercial humic acid (HA) and those isolated from red Latosol (HR) and red-yellow sandy phase Latosol (HC) soils. The curves were obtained with heating rates of 10 oC min-1 under a synthetic air atmosphere.
decomposition stage, as supported by TG data. The less intense and broad peaks observed for RL and CL, as shown in Figure 4, probably result from the presence of ions in the organic-mineral interlayer space and also may be due to organic compounds sorbed onto minerals that retain water molecules. On the other hand, its profile can be associated with the structure of native soils from forest and cerrado vegetation, due to the presence of micro and macroaggregates and the amount of water found in dispersible clays.30
The first well-defined peak for RSQ, RQ1 and RQ2 differs from RL and CL soils in Figure 4. Such differences can be related to the amount of OM between the typical soil and that under cane management. These results can be connected to the change in chemical and physical properties due to the management of soil. The use of soil for agricultural practices can influence the infiltration of water, affecting the covered soil by disruption of labile macroaggregate fractions, with changes in aggregation and the structure of soils30 and, consequently, resulting in a
rapid loss of water molecules. The second and third endothermic peaks for burnt (RQ1, RQ2) and unburnt (RSQ) sugar cane management soils presented a more pronounced intensity than for RL soil. This result can be attributed to an increase of bulk density of mineral soils at large depth due to management effects and compaction from machinery traffic. Thus, it is very probable that these more intense peaks are related to the large density of minerals in the sugar cane plantation soil.31
Taking into account the peaks for RL, RQ1 and RQ2
in Figure 4, the ΔH values were calculated to give 164,
140 and 169 J g-1 for the second peaks and 186, 227 and
350 J g-1 for the third ones, showing larger values for this
latter set. These dehydroxylation results imply in more thermally resistant mineral fractions than those shown in the second peak, because a large amount of energy per gram of soil is necessary for decomposition. RQ2 presented values higher than those of the control RQ1, sampled near the surface. These results indicated a possible change in the mineral fraction of soil, resulting from the annual burning process.
As a general behavior, the temperature range from 200
to 580 oC can embrace endothermic peaks that could be
associated with conversion of inorganic compounds, for example, kaolinite to metakaolinite.9,32 Previous report on
Brazilian kaolinitic clays33 attributed the endothermic
peaks in the 268 to 276 oC range to the removal of gibbisite
crystallization water, by transforming the aluminum hydroxide through dehydration to a transition aluminum
phase. The other endothermic peak in the 499 to 503 oC
range corresponds to the formation of metakaolinite due
to the water chemically bonded to the silicate lattice.33 A
support for this same mineral composition was also
determined for other Oxisol samples,34 in which the same
sequence of thermal events was assigned.35 From Figure
4 the same characteristic peaks, are observed of both gibbsite and kaolinite minerals in the soil samples.
These large and intense peaks permit their charac-terization, even though only a small amount of mineral is present in the soil. The knowledge of a given soil clearly informs whether the hydroxyl anions are present as individual species fixed on metals as tetrahedral or octahedral species or whether they are bonded in 1:1 or 1:2 metallic structural arrangements. On the other hand, the
mineral goethite shows an endothermic peak near 320 oC,
similar to that of gibbsite. However, if iron is not present, the peak characterizes the existence of gibbsite. But, in soil samples, like those studied here, unremoved iron indicates the possibility that the decomposition takes place from the components in a partly or completely overlapping way. This problem can further increase if the amount of components that accompany the main matrix is very small.36
The endothermic peaks found in the 287 to 297 and
499 to 513 oC temperature ranges are attributed to the
presence of gibbsite and kaolinite, in agreement with other
data in the 290 to 350 and 520 to 530 oC ranges. The
presence of quartz is described in the 575 oC region10,37
and, in this investigation, it was found from 540 to 575 oC
as weak peaks, shown at 575 oC for RQ2, 555 and 540 oC
for RL and CL soils, respectively. Based on these results, it is possible that the first peak, referring to the gibbsite form, is superimposed on the goethite one.
Exothermic peaks also appeared for all soils studied
over 300 oC, being broad and well-defined under a
synthetic air atmosphere. With the exception of RL soil that presented a large broad peak without defining a
maximum in argon and at 329 oC in synthetic air, all
other soils presented this maximum at 350 and 324 oC
for RSQ, 310 and 335 oC for RQ1, 310 and 328 oC for
lower molar mass present in the OM can enter into the interlayer of clay minerals and the structure is stabilized, making thermal oxidation difficult. The intensity of these effects of protection depends on the type and amount of minerals and of the OM sorbed by first layer, due to the type of bonding between the organic compounds and
the minerals.5 These exothermic peaks under both
atmospheres may be also related to the oxidative effect of minerals on organic matter combustion, mainly when related to the types of minerals, like ferrous hydroxides, montmorillonite and aluminum hydroxides, where the heating process can promote thermal decomposition of organic compounds. The oxidative effect can be directly
verified, as in the case of [Fe(OH)3], which can promote
the oxidation of organic matter. In contrast, [Al(OH)3]
will not be involved in redox reactions due to its low redox potential, but is indirectly involved in the oxidative process via a catalytic effect.38
Some information involves the relationship between the temperature reached by the soil during the burning and alterations in its OM.12 Thus, for RL soil a OM fraction
more thermolabile than those of the RSQ, RQ1 and RQ2 is expected. It is possible that cane plantation management, due to mechanical stresses, has lost part of the thermolabile OM in this set of soils. Another possibility is that soil heating caused by the burning practices can accelerate the humification process with more aromatic substances, while all other types of carbon compounds are
prefe-rentially decomposed.38 However, it is clear from Figure
4 that the red forest, burnt and unburnt Latosol soils,
presented the second peaks in the 287 to 297 oC range
due to the mineral dehydroxylation process.
Conclusions
The major organic components of soils, the humic acids, extracted from red Latosol and red-yellow sand phase soils, decompose similarly to the commercial product. The slight difference in mass loss can be attributed to thermolabile fraction with higher macromolecular domain, whose composition can affect the thermal curve profiles, to give a small amount of residue under synthetic air atmosphere.
The TG curves for forest soil presented OM percent mass losses lower than soils from cane sugar management and similar values for unburnt and burnt soils collected from layers on the surface, with differences in ΔH values
from the DSC curves.
Differences in the initial decomposition of OM confirmed that the profiles of DSC curves depend on the type of OM and on the soil mineral components. This
result can be attributed to interactions among the available ions in colloidal suspension, the type of compounds present in OM and mineral components that constitute the soils. Consequently, the magnitude of change produced by the heating of the organic material composition is strongly dependent on the temperature reached during the heating process.
Amongst these soil samples, the red Latosol presented the more thermolabile organic matter, which is affected by the burning process. The soil with cane sugar cultivation can be mechanical stressed with loss of thermolabile organic matter. The burning practices induce the humification process to yield aromatic substances, a situation in which all other carbon containing components were already decomposed. The information obtained from simple, inexpensive and rapid application of thermo-analytical techniques to soil samples can provide valuable data concerning to an ecosystem, and infer orientation for the use of the land for agricultural practices.
Acknowledgments
The authors are indebted to FAPESP for financial support and to CNPq for fellowships.
References
1. Siewert, C.; Soil Sci. Soc. Am. J. 2004, 68, 1656.
2. Miyazawa, M.; Pavan, M. A.; Oliveira, E. L.; Ionashiro, M.; Silva, A. K.; Braz. Arch. Biol. Technol.2000, 43, 475. 3. Gaál, F.; Szöllosy, I.; Arnold, M.; Paulik, F.; J. Thermal Anal.
1994, 42, 1007.
4. Gibbs, H. A. A.; Garro, L. W.; Newton, A. M.; Thermochim. Acta2001, 374, 137.
5. Lopez-Capel, E.; Sohi, S. P.; Gaunt, J. L.; Manning, D. A. C.; Soil Sci. Soc. Am. J. 2005, 69, 136.
6. Sposito, G.; The Chemistry of Soils, Oxford University Press: New York, 1989.
7. Westerhof, R.; Buurman, P.; van Griethuysen, C.; Ayarza, M.; Vilela, L.; Zech, W.; Geoderma1999, 90, 277.
8. Sparks, D. L.; Geoderma2001, 100, 303.
9. Gardolinski, J. E.; Martins Filho, H. P.; Wypych, F.; Quim. Nova 2003, 26, 30.
10. Salgado, J.; Gonzalez, M. I.; Armada, J.; Paz-Andrade, M. I.; Carballas, M.; Carballas, T.; Thermochim. Acta1995, 259, 165. 11. Bertoni, J.; Lombardi Neto, F.; Conservação do Solo,
Livroceres: São Paulo, 1999, pp. 25-79.
12. Fernandez, I.; Cabaneiro, A.; Carballas, T.; Geoderma2001,
104, 281.
13. Fernandez, I.; Cabaneiro, A.; Carballas, T.; Soil Biol. Biochem.
14. Abu-Zreig, M. M.; Al-Akhras, N. M.; Attom, M. F.; Appl. Clay Sci. 2001, 20, 129.
15. Gollchin, A.; Clarke, P.; Baldock, J. A.; Higashi, T.; Skjemstad, J. O.; Oades, J. M.; Geoderma1997, 76, 155.
16. Critter, S. A. M.; Freitas, S. S.; Airoldi, C.; Thermochim. Acta 2004, 410, 35,
17. Critter, S. A. M.; Freitas, S. S.; Airoldi, C.; Thermochim. Acta 2004, 417, 275.
18. Airoldi, C.; Critter, S. A. M.; Clays Clay Miner. 1997, 45, 125. 19. Triegel, E. K.; Principles of Environmental Sampling, American
Chemical Society: Washington, 1988.
20. Critter, S. A. M.; Airoldi, C.; J. Environ. Qual. 2001, 30, 954. 21. Tan, K. H.; Hajek, B. F.; Barshad, I. In Methods of Soil Analysis: Part 1; Klute, A., ed., American Society of Agronomy and Soil Science: Madison, 1986, pp. 151-181.
22. Lima, C. B. A.; Airoldi, C.; Solid State Sci. 2002, 4, 1321. 23. Critter, S. A. M.; Airoldi, C.; Geoderma2003, 111, 57. 24. Lopes, A. S.; Solos sob Cerrado – Características,
Propriedades e Manejo, Instituto de Potassa & Fosfato: Piracicaba, 1983.
25. Dell’Abate, M. T.; Benedetti, A.; Brookes, P. C.; J. Sep. Sci.
2003, 26, 440.
26. Dell’Abate, M. T.; Benedetti, A.; Trinchera, A.; Dazzi C.; Geoderma2002, 107, 281.
27. Leinweber, P.; Schulten, H. R.; Thermochim. Acta1992,200, 151.
28. Leinweber, P.; Schulten, H. R.; Horte, C.; Thermochim. Acta 1992, 194, 175.
29. Grisi, B.; Grace, C.; Brookes, P. C.; Benedetti, A.; Dell’Abate, M. T.; Soil Biol. Biochem.1998, 30, 1309.
30. Westerhof, R.; Buurman, P.; van Griethuysen, C.; Ayarza, M.; Vilela, L.; Zech, W.; Geoderma1999, 90, 277.
31. Neufeldt, H.; Ayarza, M. A.; Resck, V. S.; Zech, W.; Geoderma 1999, 93, 99.
32. Okada, K.; Shimai, A.; Takei, T.; Hayashi, S.; Yasumori.; Mackenzie, J. D.; Microporous Mesoporous Mater. 1998, 21, 289.
33. Souza, G. P.; Sanchez, R.; Holanda, J. N. F.; J. Therm. Anal.
Calorim. 2003, 73, 293.
34. Ketterings, Q. M.; Bigham, J. M.; Laperche, V.; Soil Sci. Soc.
Am. J. 2000, 64, 1108.
35. Dixon, J. B.; Clays Clay Miner. 1966, 14, 83.
36. Moniz, A. C. In Elementos de Pedologia, Polígono: São Paulo, 1972, pp. 391-408.
37. Salgado, J.; Mato, M. M.; Vasquez-Galiñanes, Paz-Andrade, M. I.; Carballas, T.; Thermochim. Acta2004, 410, 141. 38. Miltner, A.; Zech, W.; Org. Geochem. 1997, 26, 15.
Received: December 12, 2005
Published on the web: August 11, 2006