• Nenhum resultado encontrado

J. Braz. Chem. Soc. vol.17 número7

N/A
N/A
Protected

Academic year: 2018

Share "J. Braz. Chem. Soc. vol.17 número7"

Copied!
27
0
0

Texto

(1)

J. Braz. Chem. Soc., Vol. 17, No. 7, 1281-1290, 2006. Printed in Brazil - ©2006 Sociedade Brasileira de Química 0103 - 5053 $6.00+0.00

Article

*e-mail: edson@dq.ufscar.br

Dereplication of Glycosides from

Sapindus saponaria

using Liquid Chromatography-Mass

Spectrometry

Michael Murgu and Edson Rodrigues-Filho*

Departamento de Química, Universidade Federal de São Carlos, CP 676, 13565-905 São Carlos-SP, Brazil

Frutos de Sapindus saponaria (Sapindaceae), uma planta amplamente distribuída nos trópicos, foram coletados a cada trinta dias, durante seis meses. Estudos usando cromatografia a líquido com detecção por UV e EM (CLAE/UV/ESI-EM) e fragmentações por EM/EM, mostraram que os principais glicosídeos presentes nesses frutos são saponinas (SAP) derivadas dos triterpenos hederagenina e ácido oleanólico, e oligoglicosídeos de sesquiterpenos acíclicos (ASOGs). Usando esses métodos de análise, foram detectados até trinta SAPs e sessenta e três ASOGs. A planta produz esses compostos como uma mistura complexa de glicosídeos naturalmente acetilados de forma não regiosseletiva. Hidrólise alcalina dos glicosídeos naturais produziu uma mistura, constituída de apenas quatro SAPs e cinco ASOGs. Análise quantitativa dos glicosídeos saponificados mostrou que a quantidade de SAPs acumulada durante a maturação dos frutos permaneceu constante (~110 mg g-1) enquanto a quantidade de ASOGs é

consideravelmente maior e chega a uma acumulação máxima de 540 mg g-1 aos três meses de

idade.

Fruits of Sapindus saponaria (Sapindaceae), a widespread tree throughout the tropics, were collected each 30 days during six months. Liquid-chromatography with UV and MS detection (LC/UV/ESI-MS) and MS/MS fragmentation studies showed that the main glycosides present in these fruits are saponins (SAP) derived from the triterpenes hederagenin and oleanolic acid, and acyclic sesquiterpene oligoglycosides (ASOGs). Using these methods of analysis, we detected up to thirty SAPs and sixty-three ASOGs. The plant produces these compounds as a complex mixture of naturally non-regiosselective acetylated glycosides. Alkaline hydrolysis of the natural glycosides produced simplified mixtures of compounds formed of only four SAPs and five ASOGs. Quantitative analysis of the saponificated glycosides showed that the amount of SAPs accumulated during fruit maturation was almost constant at

ca. 110 mg g-1 while the quantity of ASOGs are considerably higher and hits a maximum

accumulation of ca. 540 mg g-1 at an age of ca. 3 months.

Keywords:Sapindus saponaria, saponin, sesquiterpene oligoglycoside, electrospray, HPLC

Introduction

Sapindus saponaria (Sapindaceae) is a medium size tree distributed all over the tropics and produce yearly small fruits in large amounts. These fruits accumulate in its pericarps great quantity of a sap that foam when shaken in water. Many people in the tropics use this sap as a soap substitute, not only for cleaning procedures itself but also for treatment of skin lesions caused by fungi. Also, fruits of S. saponaria contain molluscicidal saponins and can be used for schistosomiasis control.1 The antigastric ulcer

potential of extracts obtained from S. saponaria fruits was recently demonstrated.2

Earlier phytochemical studies using fruits of S. saponaria collected in Brazil1,3,4 led to the identification of

five monodesmosidic saponins derived from hederagenin (23-hydroxyoleanolic acid) (Table 1). Some of these saponins were acylated with acetic anhydride in pyridine prior to isolation procedure.3 The glycoside composition is

similar to other Sapindus species (Tables 1 and 2),5-11 but

we recently found that S. saponaria produces large amount and variety of naturally acetylated glycosides.

Despite the potential importance of Sapindus plants as a good source of bioactive saponins,12-16S. saponaria lacks

(2)

for detection and identification of saponins and related glycosides 17-19 in plant extracts. Therefore, this paper

describes the results of the qualitative and quantitative analysis of the glycosides contents of fruits of S. saponaria

by HPLC coupled to electrospray ionization and tandem mass spectrometry. A seasonal study and isolation of some of the glycosides are also reported.

Results and Discussion

In Sapindus species the saponins accumulate in their fruits.12-16 For the present study collections were done monthly

covering a complete maturation cycle, from the time they had just emerged from flowers (early May), until late October (spring), when the fruits start to fall from branches. During this period, the fruits go through great changes both in color, from green to dark-brown, and in weight, from ca. 1.2 g to 3.8 g at an age of 80-100 days and ca. 1.0 g at the end of the cycle. We found that the glycoside composition also change significantly accompanying these changes in weight.

Figure 1a shows a mass spectrum obtained by electrospray in negative ion mode of a SAP aliquot from one fruit in the early stage of development. The spectrum was acquired by direct infusion of the sample into the ion source (no clean-up procedure, no chromatographic resolution) and is composed of two different regions, one being formed of clusters of intense peaks (m/z 1100 to 1550) with each peak in the cluster separated by 42 Da. This first region was later named ASOG (acyclic sesquiterpene oligoglycoside) region. The other region, named saponins region (SAP), contains lesser intense peaks from m/z 650 to m/z 1000 with some of the peaks also showing the pattern of 42 Da mass differences.

The sample, which gave rise the mass spectrum shown in Figure 1(a), was subjected to an analytical reverse phase HPLC separation. The chromatogram obtained is shown in Figure 2. This analysis confirmed that the major components in the sample were formed of a mixture of ASOG, which are more polar than the saponins. The normal phase TLC analysis, shown in Figure 1(b), also shows the presence of compounds of different polarities.

Qualitative analysis of glycosides

The glycosides present in fruits of S. saponaria were efficiently fractionated in two separated classes (ASOG and SAP) using solid phase extraction (SPE) in a reversed phase (ODS) cartridge. The compounds in these two classes were eluted from the SPE cartridge with 30 and 60% acetonitrile respectively. Some of these glycosides were also isolated and identified by NMR methods. The knowledge gained with the study of fragmentation by collisional induced dissociation (CID) of the well

Figure 1. ESI-MS (a) and TLC (b) of an extract obtained from young fruits of S. saponaria.

Figure 2. Chromatogram (UV, 205 nm) of a crude methanol extract

(3)

1283 Murgu and Rodrigues-Filho

Vol. 17, No. 7, 2006

characterized glycosides, was used for a tentative identification17-19 of related compounds present in the

extracts and fractions of S. saponaria fruits. The SAPs and ASOGs were analyzed separately by LC-MS using ESI-MS or ESI-MS/MS modes, and these data are discussed below.

Identification of saponins (SAP). Most of the saponins detected in the fruits extracts (Table 3) have hederagenin as the aglycon. This was deduced by MS, which showed that the ion at m/z 471 ([aglycon]-) is a product of most of

the precursor ions identified as [M-H]-. This was also

corroborated by the NMR data. Thus, the most intense sp2 hybridized 13C signals appeared at ca. δ 122.7 (C-12)

and 144.8 (C-13) in the NMR spectrum obtained of the saponins fraction confirming oleanolic acid instead of ursanic acid (δ 125.5 and 139.5 for C-12 and C-13, respectively)20 as the main precursor of the aglycon in

these saponins. Saponins derived directly from oleanolic acid (m/z 455) were minoritary in both quantity and variety. Bisdemosidic saponins were detected only in trace quantities and were not identified. This is in agreement

with the literature, which shows that the majority saponins in Sapindus plants are modesmosidic (see Table 1).

Suggestions of sugar sequences and diagnose for the presence of acylation were made based on interpretation of CID-MS data, as shown in Figure 3 for s1-2a. Neutral sugar monomers were eliminated as dehydrated units (e.g. 132 Da of arabinose or xylose, 146 of rhamnose). The presence of acetate group is readily seen in the ESI spectra, which contains clusters of peaks separated by 42 (loss of ketene) and 60 (loss of acetic acid) Da, suggesting the classical 1,2-elimination (Scheme 1) as the probable mechanism for these fragmentations. The sequences of sugar units in the saponins were established considering a fragmentation to that sugar loss occurs from the end of the carbohydrate chain to the aglycon. Internal elimination of sugar was detected as low abundant fragments and was not considered or interpreted. Arabinose (ara) and rhamnose (rha) were the most frequent sugars found in the carbohydrate chain of the saponins, but glycose (gly) and xylose (xyl) were also found.

The saponins were found frequently acylated with acetic acid. The positioning of these acetyl groups was made based on NMR data discussed below for some of

Figure 3. Product ion spectrum obtained by CID (35 eV) of the

precur-sor ion at m/z 965 produced by electrospray ionisation of SAP s1-2a, and suggestion for the origin of the fragments in this spectrum.

Table 1. Structures of saponins produced by Sapindus species

S. mukurossi produces s1, s2, s3, s4, s1-1b, s2-2a, s1B, s2B, s4B, sB;5S.

delavayi produces s1, s2, s3, s4, s5, s6, s1-1a, s1-1b, s1-2a, s2-2a, s3

-2a;6 S. saponaria produces s1, s2, s1-1b, s7 e s8;1,3,4 and S. rarak

(4)

the saponins listed in Table 3. Furthermore for some of them it was impossible to separate acetate isomers in preparative scale. Figures 4A and 4B show the chro-matographic resolution of some SAPs derived of hederagenin (4A) and oleanolic acid (4B). They were detected as clusters of peaks for isomeric glycosides with very closed retention times.

Table 3 resumes the compounds identified under this study of saponins contents of fruits pericarps of S.

saponaria. Among the thirty peaks detected and

identified, twelve were related to saponins not described for Sapindus species previously. The presence of acetate groups was very common. Although it was clear that the acetates were located in the sugar portion of the saponins, their exact position in the carbohydrate chain was not possible to determine by mass spectrometry only, unless when the saponin was isolated and studied by NMR. Thus, a saponin rich fraction was subject to a preparative HPLC separation. This procedure let to purify the saponins s1-1b, s1-2a and s2-2a, and a sub-fraction containing the nonresolved saponins s1, s2 and s3 (see

m/z 881 in Figure 4A).

The aglycon hederagenin was unequivocally identified in saponins s1, s2 and s3 by 13C NMR analysis and

comparison with data published in the literature.6,9 These

three saponins showed [M-H]– at m/z 881, whose CID MS

spectra contains peaks at m/z 749 ([M-H-xyl] for s1, or

[M-H-arap] for s2, or [M-H-araf] for s3), m/z 603

([M-H-xyl-rha] for s1, or [M-H-arap-rha] for s2, or

[M-H-araf-Scheme 1. Suggested general mechanism for the fragmentation of free

or acetylated sugar chain in SAPs and ASOGs.

Table 2. Structures of acyclic sesquiterpene oligoglycosides produced

by Sapindus species

S. mukurossi produces a1, a2, a7, a8;7S. delavayi produces a1, a2, a3,

a4, a5, a7, a8, a9;8 and S. trifoliatus produces a6.22

Figure 4. Selected ion recorded chromatograms of acetylated oleanolic

(5)

1285 Murgu and Rodrigues-Filho

Vol. 17, No. 7, 2006

rha] for s3), and m/z 471 ([agly]). These saponins have

been described previously for three Sapindus species.1,5,6,9

Four saponins with molecular weight 924 Da ([M-H] at m/z 923) were detected as three peaks in the

LC-MS analysis (Figure 4A). Their CID spectra indicated alternative structures ara or Hed-ara-rha-xyl with one acetyl group attached to the sugar chain ([M-H-42] at m/z 881 and [M-H-60]- at m/z 863) for

these saponins. The difference between the four saponins probably relies on the positioning and/or stereochemistry of the acetyl group. One of these saponins (s1-1b) was efficiently isolated by preparative HPLC. The isolated saponin had its molecular weight confirmed by the presence of the ions at m/z 1037 ([M+TFA]), 959 ([M+Cl]) and 923 ([M-H]) in its

ESI-MS. Analysis of the CID spectrum for this saponin monoacetate (listed in Table 3) confirmed the ara-rha-xyl sugar sequence attached to C-3 of hederagenin. The NMR data obtained for s1-1b is in agreement with those of 3-O-(4-O-acetyl-O-β-D-xylopiranosyl)-(1→3)-α -L-rhamnopiranosyl-(1→2)-α -L-arabinopyranosil-hederagenin, previously reported for S. mukurossi,5 S. delavary,6S. saponaria1 and S. rarak. 9 Another fraction

containing saponin s1-1b, but rich in a second isomeric saponin (same MS data, different retention time), was obtained by preparative HPLC and identified by the following NMR data: the presence of the acetyl group at C-4 of the terminal xylose in s1-1b deshield C-4 but shield C-5 and C-3 compared to NMR data of the nonacetylated saponin s1.1,6 The analysis of the 13C

NMR data obtained for the second saponin present in this fraction shows difference only for carbons of the terminal xylose, when compared with s1-1b. For this saponin, the carbon at δ 79.0 (C-3) is correlated (HSQC) with a deshielded hydrogen (δ 5.53, dd J = 9.0 and 9.5Hz) in the 1H NMR spectrum, which is in its turn

correlated (HMBC) with an acetyl carbonyl carbon (δ 170.1). These correlations allowed the identification of this saponin as s1-1a, also co-produced with s1-1b by the Sapindus species cited above.

Two of the five saponins with molecular mass 966 ([M-H] at m/z 965) detected as four peaks by LC-MS (Figure

4A, Table 3), were isolated by preparative HPLC. The saponins s1-2a and s2-2a are the major saponins in the extract studied. The same sugar sequence of s1-1b (Hed-ara-rha-ara or Hed-ara-rha-xyl) was suggested after analysis of the CID spectra of these saponins, and it was clear by the MS data that two acetyl groups are present in both glycosides sugar chain of s1-2a and s2-2a. Thus, the precursor ion at m/z 965 produced ion fragments at m/z 923 ([M-H-42]), m/z 605

([M-H-42-60]), m/z 881 ([M-H-2x42]), m/z 863

([M-H-60-42]-) and m/z 845 ([M-H-2x60]-) indicating the presence of

two acetates. The two isolated saponins s1-2a and s2-2a behave the same way under CID-MS. The NMR data of these two saponins are almost the same. The only difference is in regard the 1H signal of the H-4

xyl, that appears in spectrum of

s1-2a as a double-triplet at δ 5.28 (J 5.5 and 10.0 Hz) while for s2-2a it is a doublet of double-doublet at δ 5.21 (J 5.5, 9.5 and 3.0 Hz). Although saponin s1-2a is an abundant glycoside in S. saponaria, it is not yet reported in literature for this specie, but was reported for S. mukurossi5 and Gliricidia sepium, a Leguminoseae21. Its stereoisomer s2-2a

was previously described for S. mukurossi,5 S. delavayi6 and S. rarak.9

The other saponins listed in Table 3 could not be isolated due to their small amount in the extracts and/ or poor resolution in the preparative scale HPLC. But the sugar sequence and the aglicone moiety were suggested by the CID data. The highest degree of acetylation (three acetates, [M-H] at m/z 1007) was

observed for Hed-ara-rha-ara (or Hed-ara-rha-xyl), producing several different compounds (Figure 4A).

Table 3. Identification of saponins detected in fruits of S. saponaria

[M-H] (m/z) CID spectrum Suggested structure No. of peaks

detected

881 881, 749, 603, 471 Hed-ara-rha-ara or Hed-ara-rha-xyl (s1, s2 and s3) 3

923 881, 863, 749, 603, 471 Hed-ara-rha-ara or Hed-ara-rha-xyl w/ 1 OAc (s1-1a and s1-1b) 4 965 923, 905, 881, 863, 845, 749, 603, 471 Hed-ara-rha-ara or Hed-ara-rha-xyl w/ 2 OAc (s1-2a, s2-2a and s3-2a) 5 1007 965, 947, 923, 905, 887, 881, 863, 845,

749, 603, 471 Hed-ara-rha-ara or Hed-ara-rha-xyl w/ 3 OAc (not described) 7

749 603, 585, 471 Hed-ara-rha (s4) 1

911 749, 603, 471 Hed-ara-rha-glc (not described) 1

953 911, 893, 749, 603, 471 Hed-ara-rha-glc w/ 1 OAc (not described) 1

995 953, 935, 911, 875, 893, 749, 603, 471 Hed-ara-rha-glc w/ 2 OAc (not described) 1

865 733, 587, 455 Olean Ac-ara-rha-xyl orOlean Ac-ara-rha-ara (s5 and s6) 1

(6)

Three saponins containing a terminal glucose unit in the glycoside chain, and also containing acetyl groups, were detected as minor compounds. Minoritary saponins derived from oleanolic acid, with the most common sugar chain seen in the hederagenin saponins (ara-rha-ara or ara-rha-xyl) were detected, also containing up to two acetyl groups (Figure 4B). These saponins were not yet described for Sapindus plants.

Identification of acyclic sesquiterpene oligoglycoside (ASOG). Although the ASOGs shown in Table 2 (a1 to a9) have been described for S. mukurossi,7 S. delavayi8 and S. trifoliatus,7,22 there is still a lack of description of

sesquiterpene glycosides for S.saponaria. In the present work the 1H NMR spectrum of the crude ASOG fraction

showed that these compounds occur in S. saponaria as a complex mixture of acetates (intense singlets at δ 1.90-2.20), confirming the interpretation of the mass spectrum shown in Figure 1. This ASOG acetates fraction where subjected to alkaline hydrolysis with aqueous sodium hydroxide and produced a simplified mixture of ASOGs formed of a1 ([M-H] at m/z 1145) as the major compound,

and other four minor sesquiterpene glycosides. Among the four minor ASOGs, a2 ([M-H] at m/z 999) and a3 ([M-H]

at m/z 1131) were suggested by CID data accordingly Kasai

et al.7 and Wong et al.,8 who identified these compounds in S. mukurossi and S. delavayi respectivelly. The ASOG a4 ([M-H] at m/z 691) was also produced by S. delavayi.8

The last minor ASOG ([M-H] at m/z 1161) is probably an

oxidized dihydro sesquiterpene glycoside (a1+16 Da) not yet described in Sapindus, but was not completely identified in the present work. The ASOG a1 was isolated from the deacetilated fraction and studied by NMR. The data

obtained is in agreement with those published for the glycoside mukuruzioside IIb published by Kasai et al.7

The CID spectra of ASOGs produced rapid diagnose for the identity of the sugar chain and the presence of acetates (Figure 5). These spectra were interpreted according the strategies shown above (Scheme 1). For a1, the two sugar chains are identical and its CID spectrum contains few ions (Figure 5B). In this case, two rhamonse units are eliminated from [M-H]before glycose. This

spectrum is reproduced for acetates of a1 when m/z 1145 is generated in the ion source. The analysis of the nondeacetilated ASOG fraction by LC-MS, and searching the TIC for peaks corresponding to a1 and a1 poliacetates

Figure 5. CID spectrum of the precursor ion at m/z 1145 [M-H] obtained by electrospray ionization of a1 (A) and ESI-MS of an a1 diacetate (B) showing

[M-H] at m/z 1229. Structure of a1 is shown in Table 2.

Figure 6. Selected ion recorded chromatograms for acetylated ASOGs

(7)

1287 Murgu and Rodrigues-Filho

Vol. 17, No. 7, 2006

[from mono (m/z 1187) to hexaacetate (m/z 1397)], revealed the presence of up to 25 peaks (Figure 6). The same idea followed for a2, a3, a4 and a10 showed a large number of ASOG acetates (up to 63). The number of the different acetates is registered in Table 4. The isolation and identification of these ASOG acetates, with the establishment of the exact positioning and stereochemistry of the acetyl groups in these molecules, is a big and probably unreachable challenge for chromatographysts.

Quantitative analysis of glycosides

The work on exploitation of the fungicide properties and biotransformation of saponins demands isolation of great amounts of glycosides. Therefore, a comparative study of the distribution of the glycosides in S. saponaria

and its variation during fruit maturation was carried out. These studies may be helpful to those involved with other biological activities of specific glycosides.

As stated before, the crude extract of the glycosides in its natural form is a high complex mixture of SAP and ASOG acetylated compounds. By the other hand, after alkaline hydrolysis, this mixture is simplified and its UV chromatogram contains only a few peaks, corresponding to free SAPs and ASOGs. The major compounds in these two classes are s1 and a1, respectively. Oleanolic acid derived saponins occur in trace quantities and are detected only after sample enrichment procedures. These saponins were not considered in the quantitative analysis.

An exogenous saponin, 3-O-β -D-glucopyranosyl-(1→3)-β-D-glucopyranosyl-oleanolic acid isolated from

Passiflora sp,23 was used as internal standard for the

quantification of free SAPs and ASOGs. A standard curve was produced after injection in the HPLC of five different concentrations of the two analyte respectively against a fixed concentration of the internal standard. The curve24 showed

good linearity as well as good correlation coefficient (r > 0.99). The fruits were collected by ca. 20-30 days covering almost six months. The mesocarpe was separated, dried and powdered. The extraction was made with a methanol-water solution of the internal standard, hydrolyzed and injected in the HPLC with detection by UV at 205 nm. The

concentrations were plotted against the time after each collection and are shown in Figure 7. Its was found that the saponins concentration is almost the same during fruits maturation (113 mmol mg-1 or ~110 mg g-1 of dried fruits)

and the acyclic sesquiterpene oligoglycosides are the major compounds (ca. 308 mmol mg-1 or ~350 mg g-1 of dried

fruits), reaching a maximum production (~540 mg g-1 of

dried fruits) in ca. 90 days old fruits.

Conclusions

Many of the procedures described for the isolation of plant saponins, following classical phytochemical methods, use acetylation reaction to make the compounds less polar. Some of the saponins recorded in literature for

S. saponaria have being isolated by this way. The present work shows that this plant produced a large variety of naturally acetylated glycosides. Therefore, acetylation prior isolation is not a recommended procedure. Separation by HPLC techniques and monitoring the fractions by MS is a more appropriated approach.

The distribution of the glycosides during fruit maturation is quite different in regard SAPs and ASOGs. The amount of saponins remains almost the same through a period of six months after the fruits have emerged from flowers, while the ASOGs are always the major glycosides in the plant and hits a maximum accumulation when the fruits are ca. 3 months old.

Table 4. Identification of ASOGs detected in fruits of S. saponaria

[M-H]- (m/z) CID spectrum Suggested Num. of peaks detected for each ASOG with x acetates

structure x = 0 1 2 3 4 5 6

1145 999, 853, 707, 691, 561, 545 a1 1 2 5 5 6 5 1

999 853, 707, 691, 561, 545 a2 1 3 2 1 1 1

-1131 999, 985, 853, 707, 691, 561, 545 a3 1 1 3 2 2 2 1

691 545, 399 a4 1 2 2 1 - -

-1161 1015, 999, 853, 707, 691, 561, 545 a10 1 1 2 2 3 1 1

Figure 7. Variation of the concentration of ASOGs and SAPs in dried

(8)

Experimental

Equipment

HPLC analyses were performed using two Shimadzu pumps (LC-10AD and LC-10Advp) and an SPD-M10Avp UV detector set at 205 nm. HPLC grade ACN was obtained from Mallinckrodt, and H2O was purified in a Milli-Q system. ESI-MS/MS spectra were acquired in negative ion mode on a triple quadrupole Micromass Quattro LC spectrometer, equipped with a Z-Spray API ion source and a megaflow electrospray probe. NMR spectra were recorded in C5D5N (Aldrich) on a Bruker DRX 400 spectrometer operating at 400 MHz for hydrogen and 100 MHz for 13C. TMS was used as internal standard.

Plant material

Fruits of S. saponaria were collected in São Carlos, São Paulo state, Brazil. A voucher specimen (No. 003651) has been deposited in the herbarium of the Botanic Department of Universidade Federal de São Carlos, Brazil. The fruits grow in brunches of 10 to 25 fruits each. They are ca. 15 mm of diameter and green at the beginning but start becoming dark-brown and smaller about four months after they have emerged from flowers. Immediately after collection, the fruits masses were measured (average of 15 fruits per collection per tree). The collections were done ca. monthly and started early May of 2000 (early winter in Brazil), when the fruits had just emerged from flowers, until late October (spring), when the fruits are completely dark-brown and start to fall from branches. The fruits started with an average mass of 1.2 g (not dried) and hit the maximum weight of ca. 3.8 g at an age of 80-100 days. After this period the fruits start to dehydrate and the average weight drops to ca. 1.0 g.

Extraction and isolation of SAPs and ASOGs

Fruits (ca. two months old) of S. saponaria were dried under circulating air at a temperature of 50 oC during 48

h. Finely powdered pericarpe (232.5 g) of dried fruits separated from seeds, was extracted with methanol by percolation. After removal of the MeOH under reduced pressure, the extract was partitioned between CH2Cl2 and H2O. The aqueous layer were lyophilized and part of the extract obtained (8.5 of 49.2 g) was subjected to open column chromatography (CC) on a silica gel normal stationary phase, with gradient elution [CH2Cl2:MeOH (95:5 v/v) to 100% MeOH] resulting in the collection of ten fractions, which were monitored by silica gel

thin-layer chromatography (TLC) [CH2Cl2:MeOH (9:1 v/v), sulphuric acid-Vanillin]. The less polar fractions, rich in saponins (frs. 3 and 4), were subjected to a flash CC on silica gel with stepwise gradient elution [CH2Cl2:MeOH (95:5 to 80:20 v/v)] and then to preparative scale reverse phase HPLC, on an octa-decylsilyl (ODS) column (Shimadzu Prep K, 2.0x25.0 cm), eluted with ACN:H2O (1:1 v/v) at a flow rate of 10 mL.min-1, with UV detection at 205 nm. Thus, the

saponins s1-1b (35.0 mg), s1-2a (41.0 mg) and s2-2a (23.0 mg) were purified, and s1, s2 and s3 were obtained in a mixture (3:1:0.1, 39.0 mg). The more polar fractions further eluted from the silica gel flash CC were composed of the ASOGs and ASOG acetates. Preparative scale separation of these compounds using the same HPLC conditions above for SAPs, but with ACN:H2O (35:65 v/ v), let to isolation of a1 (10.4 mg), three a1 monoacetates and four a1 triacetates. Only free a1 was completely characterized. The acetates derivatives are still to be identified.

Alkaline hydrolysis

An aliquot (30 mg) of the lyophilized extract was stirred with 10 mL of aqueous NaOH 2 mol L-1 for 30

min. The reaction solutions were acidified with 12 mL of HCl 2 mol L-1. The resulting solution was passed through

an ODS solid phase extraction (SPE) cartridge, which was further eluted with pure MeOH. The MeOH solution was analyzed by HPLC and MS.

HPLC analysis

(9)

1289 Murgu and Rodrigues-Filho

Vol. 17, No. 7, 2006

gradients elution used in the HPLC analysis were based on different proportions of ACN and H2O (containing 0.01% TFA), adjusted according the polarity of the compounds in the fractions. A linear gradient from 30 to 80% ACN in 25 min. (system A) was used for crude extracts and 30 to 60% ACN in 16 min. (system B) for ASOGs. A mixed gradient [46-61% (0-28 min), 61-80% (28-32 min), 80% ACN (32-34 min)] (system C) was used for SAPs analysis. Further adjustment on these systems was made for other fractions analyzed. Quantification of ASOGs and SAPs in S. saponaria were carried out using an exogenous saponin (3-O-β -D-glucopyranosyl-(1→3)-β-D-glucopyranosyl-oleanolic acid), isolated from Passiflora alata following the procedures described by Reginatto et al.,23 as the internal

standard (IS). For the quantification, fruits of S. saponaria were dried under circulation air at 50 oC during

48 h. The powdered fruits (10.0 mg) were extracted three times with 1 mL of MeOH:H2O (65:35 v/v) solution of the internal standard (0.3 mg mL-1). The resulting 3 mL

extract was passed through an ODS SPE cartridge and eluted with further 2 mL 100% MeOH. The cleaned extract was hydrolyzed with 5 mL of sodium hydroxide 2 mol L-1 during 15 min and neutralized with 1 mL of

chloridric acid 18%. Finally, 3 µL of the hydrolyzed glycosides solution were injected in the HPLC (linear gradient starting from 55% ACN with 45% H2O containing 0.01% trifluoracetic acid (TFA) to 80% ACN. A calibration curve21 was produced prior the

quanti-fication, using a fixed concentration of the internal saponin standard (0.1 mg mL-1) injected in the HPLC

with a pure endogenous SAP (s1), and one ASOG (a1) at concentrations of 0.50, 0.75, 1.00, 1.50 and 2.0 mg mL-1. All analyses were performed using a flow rate of

1.0 mL min-1.

MS data collection

For LC-MS analysis, the same LC conditions described above were used, but using a post-detector flow splitter adjusted to deliver only 200 µL of mobile phase to the mass spectrometer. ESI-MS data were collected from this LC effluent, or by direct introduction of the sample solution into the ion source by a Carlo Erba syringe pump (Phoenix 40) used to deliver MeOH H2O (7:3 v/v) solutions of glycosides at 70 µL min-1 to the mass spectrometer. In both

case, the desolvation and ion source block temperatures were set, respectively, at 300 and 125 oC. Gaseous N

2 was

used to nebulize (80 L h-1) and desolvate (350 L h-1). The

optimal voltages found for the probe and ion source components to produce maximum intensity of the ions

[M-H]- were 3.3 kV for the stainless steel capillary, 38V for

the sample cone, and 6V for the extractor cone. The ESI-MS/MS runs were performed by adding Ar in the collision cell, to produce a pressure of 1.5 × 10⁻³ mBar for collisional

induced dissociation (CID). The optimal collisional energy used to decompose the ions [M-H]- was 25-30 eV.

Acknowledgments

The authors are gratefull to Fundação de Amparo à Pesquisa do Estado de São Paulo (FAPESP), Conselho Nacional de Desenvolvimento Científico e Tecnológico (CNPq), Coordenação de Aperfeiçoamento de Ensino Superior (CAPES) and Financiadora de Estudos e Projetos (FINEP) for financial support.

Supplementary Information

Supplementary data are available free of charge at http://jbcs.org.br, as PDF file.

References

1. Ribeiro, A.; Zani, C. L.; Alves, T. M. A.; Mendes, N. M.; Hamburger, M.; Hostettmann, K.; Int. J. Pharmacognosy1995,

33, 177.

2. Albiero, A. L. M.; Sertié, J. A. A.; Bacchi, E. M.; J. Ethnopharmacol.2002, 82, 41.

3. Lemos, T. L.G.; Mendes, A. L.; Sousa, M. P.; Braz-Filho, R;

Fitoterapia1992, LXIII,515.

4. Lemos, T. L. G.; Sousa, M. P.; Mendes, A. L.; Braz-Filho, R.;

Fitoterapia1994, LXV, 557.

5. Kimata, H.; Nakashima, T.; Kokubum, S.; Nakayama, K.; Mitoma, Y.; Kitahara, T.; Yata, N.; Tanaka, O.; Chem. Pharm. Bull. 1983, 31, 1998.

6. Nakayama, K.; Fujino, H.; Kasai, R.; Tanaka, O.; Zhou, J.;

Chem. Pharm. Bull. 198634, 2209.

7. Kasai, R.; Fugino, H.; Kuzuki, T.; Wong, W.; Goto, C.; Yata, N.; Tanaka, O.; Yasuhara. F.; Yamagushi, S.; Phytochemistry

1986, 25, 871.

8. Wong, W H.; Kasai, R.; Choshi, W.; Nakagawa, Y.; Mizutani, K.; Ohtani, K.; Tanaka, O.; Phytochemistry1991, 30, 2699. 9. Hamburger, M.; Slacanin, I.; Hostettmann, K.; Dyatmiko, W.;

Sutarjadi, M.; Phytochem. Anal.1992, 3, 231.

10. Kanchanapoom, T.; Kasai, R.; Yamasaki, K.; Chem Pharm. Bull. (Tokyo)2001, 49, 1195.

11. Wang, X. C.; Sepu2001, 19, 529. (CA: 12545466).

12. Abreu, A.; Carulla, J. E.; Lascano, C. E.; Díaz, T. E.; Kreuzer, M.; Hess, H. D.; J. Anim. Sci. 2004, 82, 1392.

13. Huang, H. C.; Liao, S. C.; Chang, F. R.; Kuo, Y. H.; Wu, Y. C.;

(10)

14. Ojha, P.; Maikhuri, J. P.; Gupta, G.; Contraception2003, 68, 135. 15. Dhar, J. D.; Bajpai, V. K.; Setty, B. S.; Kamboj, V. P.;

Contraception1989, 39, 563.

16. Yata, N.; Sugihara, N.; Yamajo, R.; Murakami, T.; Higashi, Y.; Kimata, H.; Nakayama, K.; Kuzuki, T.; Tanaka, O.; J. Pharmacobiodyn.1986, 9, 211.

17. Liu, Y.; Liang, F.; Cui, L.; Xia, M.; Zhao, L.; Yang, Y.; Shi, J.; Ablitz, Z.; Rapid Commun. Mass Spectrom.2004, 18, 235. 18. Cui, M.; Song, F.; Zhou, Y.; Liu, Z.; Liu, S.; Rapid Commun.

Mass Spectrom.2000, 14, 1280.

19. Liu, S.; Cui, M.; Song, F.; Mo, W.; J. Am. Soc. Mass Spectrom.

2004, 15, 133.

20. Ahmad, V. U.; Rahman, A. U.; Pentacyclic Triterpenoids, Handbook of Natural Products Data, Elsevier: Amsterdan, vol. 2, 1994.

21. Kojima, K.; Zhu, X. B.; Ogihara, Y.; Phytochemistry1997, 48, 884.

22. Kasai, R.; Nishi, M.; Mizutani, K.; Miyahara, I.; Moriya, T.; Miyahara, K.; Tanaka, O.; Phytochemistry1998, 27, 2209. 23. Reginatto, F. H.; Kauffmann, C.; Schipsema, J.; Guillaume,

D.; Gosmann, G.; Schenkel, P.; J. Braz. Chem. Soc.2001, 12, 32.

24. Snyder, L. R.; Kirkland, J. J.; Glajch, J. L.; Practical HPLC Method Development, 1st ed., John Willey & Sons, Inc.: New

York, 1997.

Received: February 6, 2006 Published on the web: August 30, 2006

(11)

J. Braz. Chem. Soc., Vol. 17, No. 7, S1-S17, 2006. Printed in Brazil - ©2006 Sociedade Brasileira de Química 0103 - 5053 $6.00+0.00

Supplementary Information

*e-mail: edson@dq.ufscar.br

Dereplication of Glycosides from

Sapindus Saponaria

using Liquid Chromatography-Mass

Spectrometry

Michael Murgu and Edson Rodrigues-Filho*

Departamento de Química, Universidade Federal de São Carlos, CP 676, 13565-905 São Carlos-SP, Brazil

Figure S1.13C NMR spectrum (50 MHz, C

5D5N;TMS) of a SAP mixture.

Figure S2.13C NMR spectrum (50 MHz, C

(12)

Figure S3.13C NMR spectrum (100 MHz, C

5D5N;TMS) of a SAP mixture (s1,s2 and s3).

(13)

S3 Murgu and Rodrigues-Fo.

Vol. 17, No. 7, 2006

Figure S5.1H NMR spectrum (400 MHz, C

5D5N;TMS) of SAP s1-1b.

Figure S6.13C NMR spectrum (100 MHz, C

(14)

Figure S7.1H-1H COSY NMR experiment (400 MHz, C

5D5N;TMS) of SAP s1-1b.

(15)

S5 Murgu and Rodrigues-Fo.

Vol. 17, No. 7, 2006

Figure S9. HMBC NMR experiment (400 MHz, C5D5N;TMS) of SAP s1-1b.

(16)

Figure S11.1H NMR spectrum (400 MHz, C

5D5N;TMS) of SAP s1-2a.

Figure S12. A Typical 13C NMR spectrum (400 MHz, C

(17)

S7 Murgu and Rodrigues-Fo.

Vol. 17, No. 7, 2006

Figure S13.1H – 1H COSY NMR experiment (400 MHz, C

5D5N;TMS) of SAP s1-2a.

Figure S14.1H – 1H TOCSY NMR experiment (400 MHz, mixing time = 55ms, C

(18)

Figure S15. HSQC NMR experiment (400 MHz, C5D5N;TMS) of SAP s1-2a.

(19)

S9 Murgu and Rodrigues-Fo.

Vol. 17, No. 7, 2006

Figure S18.1H NMR spectrum (400 MHz, C

5D5N;TMS) of OGSA o1.

(20)

Figure S19. 1H NMR spectrum (400 MHz, CD

3OD) of OGSA o1.

Figure S20.1H-1H COSY NMR experiment (400 MHz, CD

(21)

S11 Murgu and Rodrigues-Fo.

Vol. 17, No. 7, 2006

Figure S21. HSQC NMR experiment (400 MHz, CD3OD) of OGSA o1.

(22)

Figure S23. HMBC NMR experiment (400 MHz, C5D5N) of OGSA o1.

(23)

S13 Murgu and Rodrigues-Fo.

Vol. 17, No. 7, 2006

Figure S25. ESI-MS and ESI-MS/MS of s1-1a and s1-1b.

(24)

Figure S27. ESI-MS and ESI-MS/MS of s1-2a.

(25)

S15 Murgu and Rodrigues-Fo.

Vol. 17, No. 7, 2006

Figure S30. ESI-MS and ESI-MS/MS of s5 or s6.

(26)

Figure S32. ESI-MS and ESI-MS/MS of SAP Olean-ara-rha-xyl w/ 2 OAc.

(27)

S17 Murgu and Rodrigues-Fo.

Vol. 17, No. 7, 2006

Figure S34. ESI-MS/MS of OGSA a1 w/ 2-6 OAc.

Imagem

Table 2. Structures of acyclic sesquiterpene oligoglycosides produced by Sapindus species
Figure 6. Selected ion recorded chromatograms for acetylated ASOGs obtained by electrospray ionization in the negative ion mode.
Figure 7. Variation of the concentration of ASOGs and SAPs in dried fruits of S. saponaria, during fruit maturation.
Figure S2.  13 C NMR spectrum (50 MHz, C 5 D 5 N;TMS) of an OGSA mixture.
+7

Referências

Documentos relacionados

Brazilian tropical Latosol soil samples were thermally analyzed associating thermogravimetric (TG) and differential scanning calorimetric (DSC) techniques under synthetic air or

In this study a spectrophotometric method for the determination of the trace amounts of dopamine, methyldopa and levodopa has been introduced based on their oxidation reaction

Compound 2 was screened in vitro in seven human cancer cell lines, MCF7 and EVSAT (mammary cancers), WiDr (colon cancer), IGROV (ovarian cancer), M19 (melanoma), MEL A498

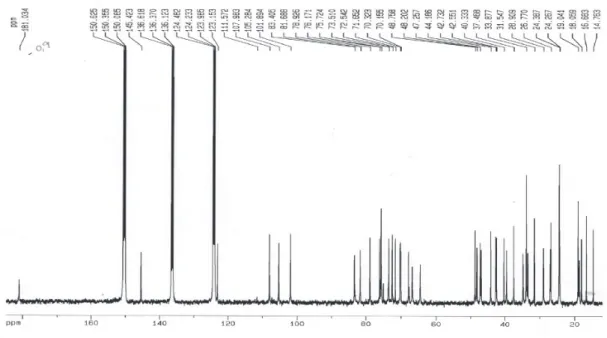
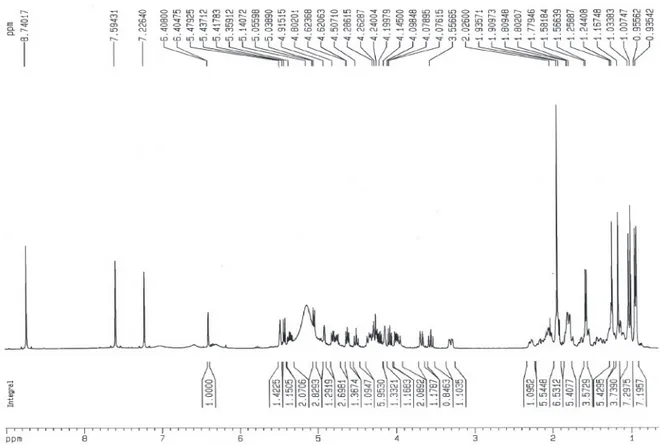
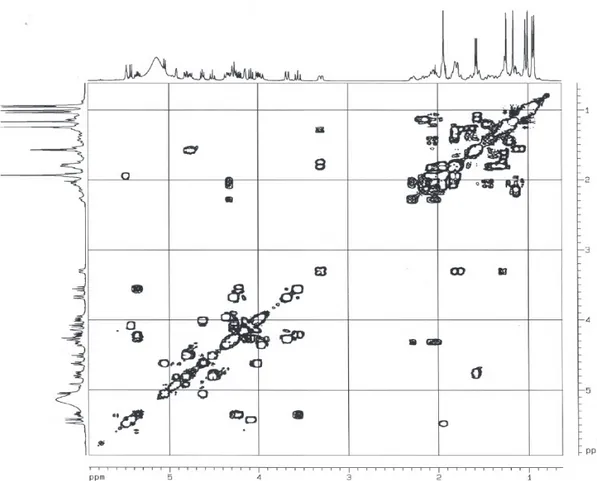
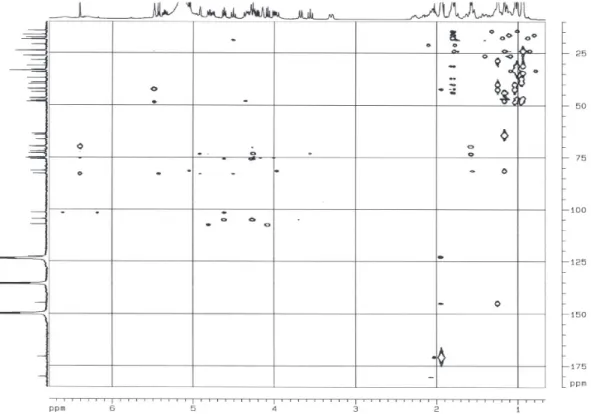
The phytochemical study of the stem bark of Aspidosperma nitidum led to the isolation of a new type of indole alkaloid with a 1,2,9-triazabicyclo[7.2.1] system, which has been

The methanolysis of soybean oil carried out in the presence of solid 3 achieved a conversion yield of 30% after 4 h using the same experimental conditions as used when solids 1 and

In Table 3, the major interfering ions (just a gross relative comparison), dynamic linear range, the detection limit and response time of the proposed electrode are compared with

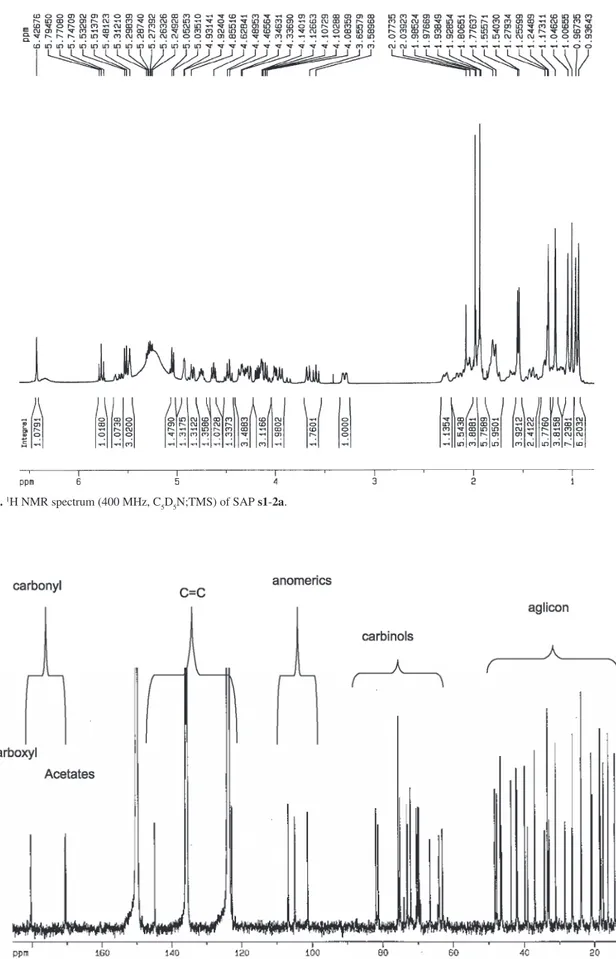
Curso de Pós-Graduação em Química Orgânica, Departamento de Química Orgânica e Inorgânica, Universidade Federal do Ceará, CP 12.200, 60455-760 Fortaleza-CE, Brazil. Setor de

Thus, at first, FPD was used as a neutral carrier to prepare PVC-based membrane electrodes for a variety of trivalent transition metal ions, including lanthanum, cerium,