THIS REPORT WAS PREPARED BY FRANCISCO GOMES A MASTERS IN FINANCE STUDENT OF THE NOVA SCHOOL OF BUSINESS AND ECONOMICS, EXCLUSIVELY FOR ACADEMIC PURPOSES. THIS REPORT WAS SUPERVISED BY ROSÁRIO ANDRÉ WHO REVIEWED THE
VALUATION METHODOLOGY AND THE FINANCIAL MODEL. (SEE DISCLOSURES AND DISCLAIMERS AT END OF DOCUMENT)
See more information at WWW.NOVASBE.PT Page 1/35
M
ASTERS IN
F
INANCE
E
QUITY
R
ESEARCH
Millennium bcp is facing several challenges, mainly driven by the European Sovereign crisis. Portuguese and Greek operations are pressuring the group results downward, due to a severe loss of margins (NIM in 9M2012 averaged 1.2% against 09-2011 1.7%) high operating costs (C/I at 66% in 9M2012 vs. 59% averaging 2008-2011) and rising imparity charges (net loan impairment of EUR 1.237mn in 9M2012, 62% increase yoy) To meet capital requirements, the bank resorted to Public funds, with a Portuguese State subscription of EUR 3.000mn CoCos. Allied with a new share issuance (EUR 500mn), BCP attained the required levels (CT I 11,9% at 3Q2012),but is now operating under the menace of nationalization and paying a demanding yield for the hybrid instruments
BCP continues to rely heavily on the ECB to have access to liquidity lines. Its exposure remains above EUR 13bn, but the dependence is decreasing along with the commercial gap (L/D ratio stood at 138% at 3Q2012 against 152% in 3Q2011.)
International operations (ex-Greece) have brought relief to
the group’s results and continue growing. For 9M2012 BCP drawn NI of EUR 54mn, EUR 45mn and EUR 12mn from Polish, Mozambican and Angolan activities respectively.
We value Millennium bcp share at EUR 0.10. Given the
current value of EUR 0.077, our recommendation is to buy.
Company description
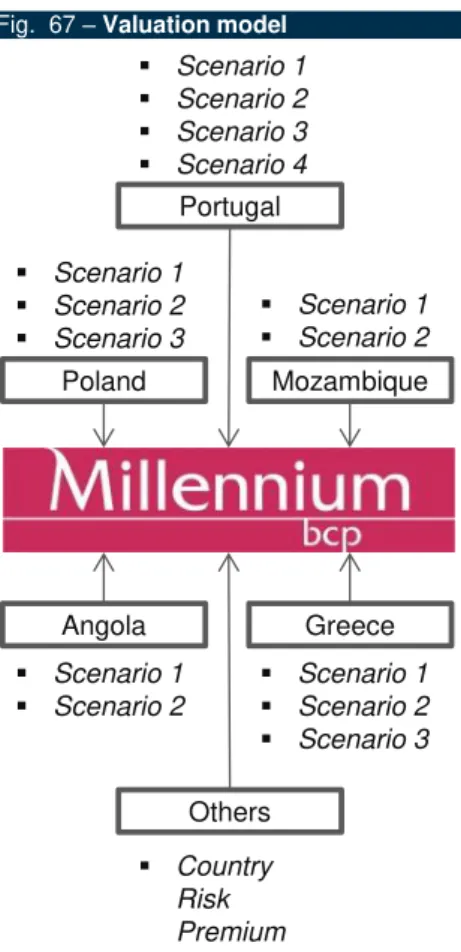
Founded in 1985, Millennium bcp is the largest Portuguese private bank, spanning its domestic operations throughout all the main banking areas. BCP is also present abroad, namely with its subsidiaries in Poland, Mozambique and Angola where the operations have assumed a critical role in the activity of the bank.
M
ILLENNIUM BCP
C
OMPANY
R
EPORT
P
ORTUGUESE
B
ANKS
7
J
ANUARY2013
S
TUDENT
:
F
RANCISCO
G
OMES
[email protected]
Precarious environment
Pursuit for the long-term stability
Recommendation: BUY
Vs Previous Recommendation BUY
Price Target FY13: 0.100 €
Vs Previous Price Target 0.090 €
Price (as of 4-Jan-13) 0.077 €
Reuters: BCP.LS, Bloomberg: BCP.PL
52-week range (€) 0.05-0.12
Market Cap (€mn) 1.517,45
Outstanding Shares (mn) 19.707,2
YTD Change (%) -16%
Source: Bloomberg
Source: Bloomberg
(Values in € millions) 2010 2011 2012F Net Interest Income 1.517 1.579 999
Net Operating Revenues 2.902 2.570 2.132
Operating Costs 1.524 1.634 1.432
Op. Profit before imparities 1.359 935 700
Net Income 344 (849) (1.089)
EPS 0,024 (0,081) (0,06)
Cost to Income 54,1% 58,4 67,2%
Cost of Risk 0,93% 1,86% 2,5%
Loans to Deposits 162% 143% 134%
Core Tier I Capital Ratio 6,7% 9,3% 13,4%
Return on Equity 9,8% -22,0% -26,2%
Source: Company Data, Analyst estimates
0 20 40 60 80 100 120 140
MILLENNIUM BCP COMPANY REPORT
PAGE 2/35
TABLE OF CONTENTS
COMPANY OVERVIEW ... 3
HISTORY ... 3
SHAREHOLDER STRUCTURE ... 4
ECONOMICAL CONTEXT ... 4
EFFECTS ON THE BANKING SECTOR ... 8
REGULATORY CAPITAL ... 9
CAPITAL RATIOS ... 9
PENSION FUND ... 10
FUNDING POSITION ... 11
RATINGS ... 11
LIQUIDITY SOURCES ... 11
LOANS ... 12
DEPOSITS ... 13
TRANSFORMATION RATIOS ... 14
FINANCIAL ASSETS... 14
DOMESTIC OPERATIONS ... 14
INTERNATIONAL OPERATIONS ... 17
GREECE ... 17
POLAND ... 18
MOZAMBIQUE ... 19
ANGOLA ... 19
OTHER OPERATIONS ... 20
VALUATION ... 20
PORTUGAL ... 21
CoCos and capital needs ... 22
Liquidity ... 23
Profitability ... 23
Leaving the Eurozone ... 24
FOREIGN BUSINESS ... 25
Poland ... 25
Greece ... 27
Mozambique ... 28
Angola ... 29
Other Operations... 30
VALUATION SUMMARY ... 30
RISKS ... 31
CONCLUSION AND RECOMMENDATION ... 32
APPENDIX ... 34
MILLENNIUM BCP COMPANY REPORT
PAGE 3/35
Fig. 1 – BCP 2008-9M20121
0 8 0 9 10 11 9 M12
Assets € bn 94 96 99 93 89
C/I 64% 62% 53% 64% 62%
ROE 5% 5% 10% - 22% - 30%
CTI Capital 6% 7% 7% 9% 13%
Rev/branche € mn 1,4 1,4 1,7 1,5 1,3 Rev/employee € t 115 114 136 119 103 1
ROE and Revenue data annualized Source: Company data
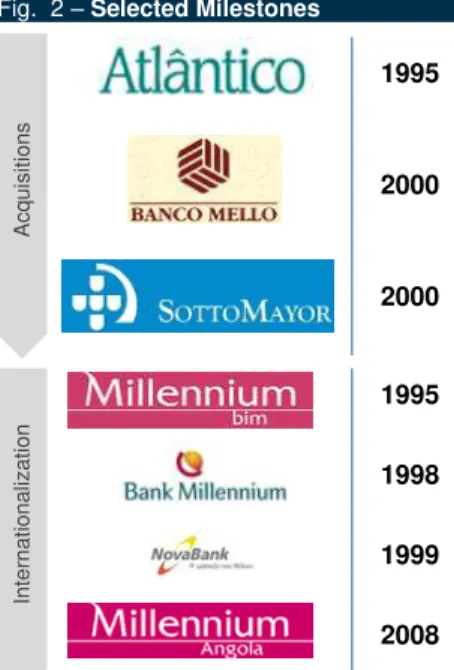
Fig. 2 – Selected Milestones
Source: Company data
Fig. 3 – Group Rebranding (2006)
Fig. 4 – Millennium bcp ROE (2000-2011)
Source: Company data
Company Overview
Millennium bcp is the largest private Portuguese financial institution, with a market share of over 20% in loans and 19% in customer deposits. It was founded as Banco Comercial Português in 1985 following the deregulation of the Portuguese financial system. By the end of the third quarter of 2012 the group managed over EUR 89bn in assets under its various domestic and international operations.
History
Ever since its foundation, BCP’s strategy has been steered by an expanding ambition and by 1994 a solid organic growth rate enabled the institution to gather a market share of almost 9% in deposits and loans to residents. Subsequent years emphasized this strategy of the group, primarily with the acquisition of Banco Português do Atlântico - at the time being, the largest commercial bank in Portugal. The incorporation of Banco Mello and Banco Pinto & Sottomayor ensued in the pursuit of the expansion plan, while in 2007 a public tender offer over BPI ended unsuccessfully. In order to reinforce its domestic position in the insurance business Millennium bcp forged a partnership with Ageas Group (formerly known as Fortis), which currently has a majority stake (51%) over Millenniumbcp Ageas.
With its position consolidated in the domestic market, BCP sought to leverage its expertise on an international campaign. Millennium bim – currently the market leader in Mozambique - was founded in 1995, setting upon an alliance with state-owned agencies. In 1998 a partnership with the Polish BBG financial group led to the creation of a retail bank named Millennium. In 2000, the group developed a venture in Greece, with the foundation of NovaBank, a retail bank which resulted from the partnership agreed with Interamerican Hellenic Life Insurance Company. Following the unsuccessful bid of BCP in the privatization process of Banco Comerciala Romana, the bank launched a Greenfield operation in Romania. Later, in 2008 the group signed a strategic partnership with one of its core shareholders – Sonangol – motivating the conception of Banco Millennium Angola (BMA). The bank also developed branches in France, Luxembourg, Canada, Turkey and United States, all of which were disposed in the wake of the banking crisis.
The growth strategy enabled the group to reap rewards. The institution thrived during most of the 2000s, delivering an impressive ROE of over 20% averaging throughout 2000 to 2007. This golden period abruptly came to an end when Millennium bcp was caught in the midst of an internal upheaval,
Ac
q
u
is
it
io
n
s
Int
er
nat
ionali
z
at
ion
1995
2000
2000
1995
1998
1999
2008
28%
5% 10%
-22%
-40% -20% 0% 20% 40%
MILLENNIUM BCP COMPANY REPORT
PAGE 4/35
Fig. 5 – BCP vs PSI-20 (Index=100)
Source: Bloomberg
Fig. 6 - Shareholder Composition (after share issuance)
Source: Company data
Fig. 7 – Largest BCP shareholders
Source: Company data
Fig. 8 – Public Debt (% GDP)
Source: Eurostat
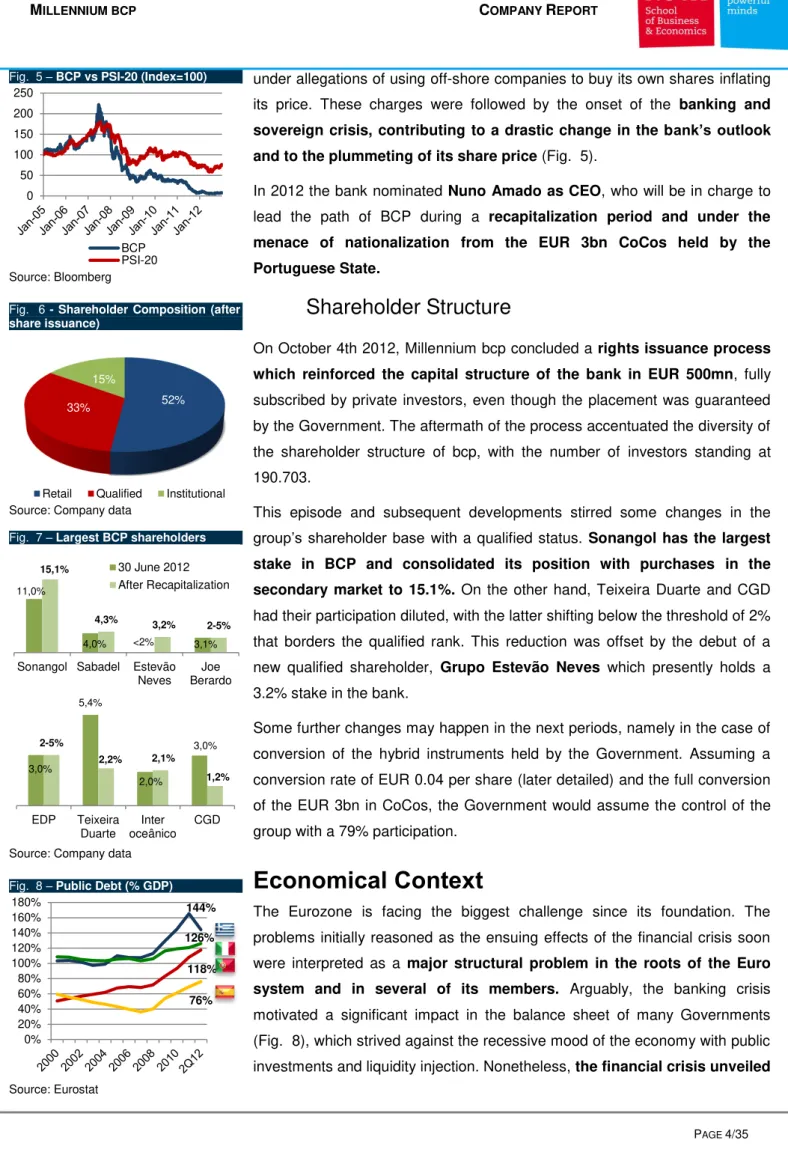
under allegations of using off-shore companies to buy its own shares inflating its price. These charges were followed by the onset of the banking and sovereign crisis, contributing to a drastic change in the bank’s outlook
and to the plummeting of its share price (Fig. 5).
In 2012 the bank nominated Nuno Amado as CEO, who will be in charge to lead the path of BCP during a recapitalization period and under the menace of nationalization from the EUR 3bn CoCos held by the
Portuguese State.
Shareholder Structure
On October 4th 2012, Millennium bcp concluded a rights issuanceprocess which reinforced the capital structure of the bank in EUR 500mn, fully subscribed by private investors, even though the placement was guaranteed by the Government. The aftermath of the process accentuated the diversity of the shareholder structure of bcp, with the number of investors standing at 190.703.
This episode and subsequent developments stirred some changes in the
group’s shareholder base with a qualified status. Sonangol has the largest stake in BCP and consolidated its position with purchases in the
secondary market to 15.1%. On the other hand, Teixeira Duarte and CGD had their participation diluted, with the latter shifting below the threshold of 2% that borders the qualified rank. This reduction was offset by the debut of a new qualified shareholder, Grupo Estevão Neves which presently holds a 3.2% stake in the bank.
Some further changes may happen in the next periods, namely in the case of conversion of the hybrid instruments held by the Government. Assuming a conversion rate of EUR 0.04 per share (later detailed) and the full conversion of the EUR 3bn in CoCos, the Government would assume the control of the group with a 79% participation.
Economical Context
The Eurozone is facing the biggest challenge since its foundation. The problems initially reasoned as the ensuing effects of the financial crisis soon were interpreted as a major structural problem in the roots of the Euro system and in several of its members. Arguably, the banking crisis motivated a significant impact in the balance sheet of many Governments (Fig. 8), which strived against the recessive mood of the economy with public investments and liquidity injection. Nonetheless, the financial crisis unveiled
0 50 100 150 200 250
BCP PSI-20
52% 33%
15%
Retail Qualified Institutional
11,0%
4,0% <2% 3,1% 15,1%
4,3% 3,2%
2-5%
Sonangol Sabadel Estevão Neves
Joe Berardo 30 June 2012 After Recapitalization
3,0% 5,4%
2,0%
3,0% 2-5%
2,2% 2,1%
1,2%
EDP Teixeira Duarte
Inter oceânico
CGD
118% 144%
76% 126%
MILLENNIUM BCP COMPANY REPORT
PAGE 5/35
Fig. 9 – External Debt (% of GDP)
Source: Eurostat
Fig. 10 – Private debt (% of GDP)
Source: Eurostat
Fig. 11 – Public Surplus/Deficit (%GDP)
Source: Eurostat
Fig. 12 – Unit Labour Costs yearly change (%)
Source: Bank of Portugal
concealed problems in some Euro members,particularly in the ‘periphery countries’, including Greece, Portugal, Ireland, Spain and Italy which raised doubts over the sustainability of the monetary union and the policies
carried.
There is a wide diversity of explanations for the causes that paved the way towards the current setting, but some forces are plainly identified. Initially, southern countries benefited from the integration in the monetary union and the strong credibility associated with it. Access to vast international sources of borrowing became available and along with it cheap credit
conditions.
The ever-low cost of credit indulged the periphery countries to accumulate historically high levels of external indebtedness, especially in Portugal, Spain and Greece, stemming construction and credit bubbles in some regions, encouraging Governments to increase spending and private indebtedness levels and progressively raising prices and wages. This combination played a harmful role in the economics of the affected regions by significantly reducing their competitiveness - observable in the gap between the growth of Portuguese labour cost and the Eurozone average in Fig. 12 - and widening the trade imbalance. These structural issues are deemed as the core drivers for the anaemic growth rates displayed by periphery economies in the past decade and remained unpunished and unsolved by the lenience of international lenders - comforted in the credibility safeguarded by the monetary union – and by the impossibility in resorting to monetary mechanismsto ease the burden.
Although the situation was not foreseen, as soon as some economies showed signals too evident to overlook there was a hasty change in the market’s perception triggering asudden reversalin the conditions that prevailed in former years. Credit rating agencies began a downgrade sequence upon sovereign and private debt from distressed regions, as can be seen for the Portuguese and Greek case in Fig. 13. Investors and lenders fled and the easiness of access to international credit dulled, disrupting the liquidity of Governments and financial institutions.
The shrinkage in international credit was coupled with mounting yields, aggravating the downturn of periphery economies, reducing tax revenues and magnifying budget deficits, soon triggering a fiscal crisis which further tightened the depressed landscape of these members. With bankruptcy looming some countries inevitably resorted to bail-out. First Greece, followed by Ireland and Portugal requested the assistance of the European 92,3%
115%
93,4%
53,4%
0% 20% 40% 60% 80% 100% 120% 140%
0% 50% 100% 150% 200% 250%
Portugal Greece
Spain Italy
-15% -5% 5%
2000 2002 2004 2006 2008 2010 2011
Italy Spain Greece Portugal
-0,7% 0,9%
MILLENNIUM BCP COMPANY REPORT
PAGE 6/35
Fig. 13 - Moody’s Sovereign debt rating evolution
Source: Bloomberg
Fig. 14 – Portuguese export/import yearly change (%)
Source: Bank of Portugal
Fig. 15 - Portuguese Investments and domestic demand yearly change (%)
Source: Bank of Portugal
Fig. 16 – Portuguese Consumption yearly change (%)
Source: Bank of Portugal
Union, European Central Bank and the International Monetary Fund to rebalance their financial situation. Meanwhile Spain has also appealed for assistance, though it was provided to aid its financial sector. The assistance programs imposed severe adjustments and targets for these nations to meet in a determined timeframe, promoting numerous austerity measures to comply with the conditions established.
Even though monetary authorities have taken action, Greece is still enclosed in uncertainty - even after another round of elections - since it successively failed to meet the agreed conditions and has already imposed two ‘haircuts’ to sovereign bondholders. In spite of having recently benefited from an ease in the targets and in the conditions of debt service, the spectrum of being the first country to leave the Euro is still looming. The financial system is taking a hit, with the funding structure undermined by the shutdown of the wholesale debt market and deposits flee.
Portugal is also striving to balance its financial situation, so far being more successful than Greece in reaching the goals established. Economic contraction has not been as extensive, partially through the contribution of a boost in external demand for its goods and services, especially from nations outside the EU which are naturally showing greater resilience to the sovereign crisis. Notwithstanding, the impact of the austerity measures towards fiscal consolidation are conducting a surge in unemployment and domestic demand (see Fig. 15). This has been driven by cuts in public spending and the shutdown of several enterprises, particularly in the non-tradable sector more reliant in the domestic market – as is the case of construction and real estate activities - a problem exacerbated by the shrinkage of funding provided by banks.
One of the main discussions since the onset of the crisis has been the possibility of a contagion effect to a larger economy. In 2012 this apprehension gained shape, particularly in Spain and Italy. The first has formally requested assistance for its financial sector which is battling the consequences of a real estate bubble, but the threat of asking for a wider bail-out package is imminent and has been more evident as the Spanish
economy slips deeper into recession (see Fig. 17) and the chances to meet the fiscal targets dim. On the other hand, Italy has accumulated alarming levels of indebtedness, although these are mostly from national lenders and is facing economic growth problems. But the problems do not seem to be narrowed to these periphery countries. As the 2nd largest economy of the Eurozone, France as assumed a co-leadership position along with
Jun-09 Jun-10 Jun-11 Jun-12
Aa1 Aa2 Aa3 A1 A2 A3 Baa1 Baa2 Baa3 Ba1 Ba2 Ba3 B1 B2 B3 Caa1 Caa2 Caa3 Ca
C
5% 9% 14% 16% 13% 11%
-6% -3% 5% 9% 10% 8%
Exports Imports
2010 2011 2012
-16%
-8%
-20% -15% -10%
-5% 0%
5%
1T10 4T10 3T11 2T12
Investments
Domestic Demand
-8% -3% 2% 7%
Private Government
2010
2011
MILLENNIUM BCP COMPANY REPORT
PAGE 7/35
Fig. 17 - Projected GDP growth 2012
Source: Eurostat
Fig. 18 – Unemployment rate (%)
Source: IMF
Fig. 19 – Foreign claims in Portugal (EUR bn)
Source: Bank for International Settlements
Germany in guiding the policies and unity of the Euro group. As so, if the spillover effects spread to this member, it could form a heavy blow for the aspirations of the single currency. In the past months, this hazard seems to have increased, awaken by rating agencies cutting France’s rate, justified by economic problems resembling the ones afflicting Southern Europe.
This dismal outlook precludes one to neglect the possibility of a member leaving the Eurozone. The lack of power from these troubled nations over monetary decisions has prevented the use of exchange rate as an instrument to recover competitiveness and return to prosperity. By imposing these structural reforms, members are aiming to reduce prices and wages to offset the increases in former years. Still, this path is precarious and features inevitably high levels of unemployment, promising an extended period of economic contraction. If an afflicted country leaves the Eurozone, its new currency devaluation would help expanding exports, while quantitative easing mechanisms could once again be deployed and boost domestic
demand. Conversely, there would be an array of additional problems to face, as would be the case of raising costs in essential imports, primarily energy-related products, while the redenomination of external debt would ensure an intricate clash in the legal field. The immediate consequences of a departure from the community could lead to the collapsing of the banking system, affected by the unavoidable closure of international funding sources.
However, it is noteworthy the dimension of foreign claims in these euro countries (vide Fig. 19). As of June 2012, foreign investors had an exposure of EUR 141bn in Portugal, of which EUR 115bn were held by European banks. This systemic risk should contribute for the policy-makers in the Eurozone to strive towards the unity of the group, under the risk of carrying wide losses with the devaluation of a new currency and probable default. The standstill witnessed in countries that are lacking results from the measures implemented and the fear of contagion to wider economies increases the importance of the upcoming political decisions to guide the destiny of the Eurozone. The recent commitment of integrating a central supervisory body for the Euro largest financial institutions carried through the ECB and the empowering of banks to have direct access to recapitalization mechanismswithout State intervention provides evidence of policy makers’ ambition to recover the stability of the Euro system and to reassert its unity. Nonetheless, more measures are being discussed – such as the development of ‘Eurobonds’ – which could be crucial to prove the solidity of the single currency. The developments in the next periods will
-3,0%
-6,0% 0,4%
-1,4% -2,3%
-0,4%
23,8%
14,8%
10,6% 15,5% 24,9%
0% 5% 10% 15% 20% 25% 30%
58,5
18,9 14,4 14,2 3,4
1,6 0
MILLENNIUM BCP COMPANY REPORT
PAGE 8/35
Fig. 20 – Real Economic Growth (2006-2010)
Source: IMF
Fig. 21 – STOXX Europe 600 Bank (EUR)
Source: Bloomberg
Fig. 22 – ECB reference rates evolution
Source: Bank of Portugal
undoubtedly be decisive for the Eurozone, but until then uncertainty will continue to surround its fate.
Effects on the Banking Sector
With the consequences of the banking crisis - taking roots in the subprime mortgage market of the United States - still affecting the banking sector, new challenges arose for financial firms with the European sovereign crisis. The subprime emerged concerns about the soundness of the financial system and stemmed a tightening pressure on the lending of banks, leading to a slowdown in the global economy, which affected more acutely the European and North-American regions.
Since then, many European financial institutions have been experiencing the consequences of the shutdown of the interbank lending system, driven by a change in the trustworthiness between banks. Financial firms hitherto dependent from these liquidity lines to meet its increasing commercial
gap between the loans conceded and the deposits captured, found themselves struggling in the midst of a liquidity crisis. This sentiment
turned out to be keener towards the ‘periphery countries’ with the triggering of
the sovereign crisis.
To avoid the bankruptcy of several institutions and to prevent a full-scale contagion to the global banking system, monetary authorities supplied instruments to ease the contraction of the interbank market. The mechanisms applied by the ECB spanned from the provision of abundant liquidity to thelowering of reference interest rates (Fig. 22) to soothe the resultant financial obligations. The deposit rate at the ECB plunged to 0%, in an attempt to encourage Northern European banks’ lending to other banks. Despite some opposition from Germany, the ECB broke the deadlock of the wholesale debt system, by injecting EUR 1.019 bn in 2011 and 2012 through Long-Term Refinancing Operations (LTRO) with a maturity of 3 years.
Additionally, in order to ease the selling pressure in the government debt yields, the ECB intervened directly in the secondary debt market and Mario Draghi – ECB President – launched the Outright Monetary Transactions - an unlimited bond-buying program aimed at lowering the borrowing costs of struggling countries.
The problems emerging from the banking and sovereign crisis called for a revision of the regulatory demands of banks by the supervisory bodies. This led to the development of the Third Basel Accord by the Basel Committee on Banking Supervision which provides standards and guidelines
-1%
-4% -3%
-6% -4% -2% 0% 2% 4% 6%
2006 2007 2008 2009 2010 World Euro area United States
0 100 200 300 400 500 600
4,25%
1,00%
1,50%
0,75%
0% 1% 2% 3% 4% 5% 6%
EURIBOR 3 Month
MILLENNIUM BCP COMPANY REPORT
PAGE 9/35
Table 1 – Basel III main capital introductions
Com m on E q u ity
T ier 1
T ier 1 Cap ital
T otal Cap ital
M in im u m 4.5% 6.0% 8.0%
Conservation
Buffer 2.5% 2.5% 2.5%
Counter-cyclical Buffer Range
0%-2.5% 0%-2.5% 0%-2.5%
Source: Bank for International Settlements
Fig. 23 – Euro area Non-Performing Loans as % of Total Loans
Source: World Bank
Fig. 24 – Interest rates on new loans in Portugal
Source: Bank of Portugal
Fig. 25 – Net income of the main Portuguese banks (EUR mn)
Source: Companies’ accounts
for the banking system. This accord is oriented to the promotion of the stability in the banking system and seeks to repair the weaknesses revealed in the financial regulation in the aftermath of the subprime crisis. Basel III main amendments endorse a stronger capital base (Table 1) along with new and stricter regulatory requirements over bank leverage and liquidity, which should be phased in until 2018.
Additionally, given the fragile conditions of the periphery countries’ financial
system, extraordinary regulatory measures were imposed by regional central banks and the European Banking Authority to be met in a shorter timeframe, in order to protect the banking system under distressed scenarios. The banks operating in these countries are facing alarmingly high levels of overdue loans associated with the current economic environment which is revealed in the escalating volumes of provisions constituted. The scope of the regulatory procedures encompass the strengthening of the capital base, which is aimed in improving the capacity of banks to withstand potential losses and the reduction of the commercial gap, in order to diminish the exposure to market volatility and liquidity constraints of the system.
Even though the purpose of these changes is tilted to encourage a more resilient banking system, there are risks in this conservative strategy. Basel III and extraordinary regulations are negatively influencing lending volumes and interest rates, which is acting as a further catalyst for the downturn of the economy. In addition, higher levels of capital ratios require the raising of funds among shareholders - a difficult task under the current climate. This has led to the access of public funds by some banks, which represents an additional risk in the stability of the structure of these banks.
Regulatory Capital
Capital Ratios
The poor performance of the Portuguese banking sector in recent years is indissociable from the sovereign crisis, spanning from the losses induced by rising sovereign yields to the sharp increase in the credit at risk and consequent level of impairments. During 9M2012, BPI was the only bank able to increase results, while the total Net Income of Portuguese 6th major banks stood at negative EUR 752mn (Fig. 25). In light of these events, the Economic Adjustment Program (EAP) set upon the assistance request by the Portuguese Government foresaw conditions to be met by financial institutions envisioning a more solid and resilient banking system.
With respect to the framework adopted, Portuguese banks had to attain a
2,5%
1,8% 2,5%
3,6% 4,4%
5,2%
1% 2% 2% 3% 3% 4% 4% 5% 5% 6%
6,85%
6,09%
4,68%
3,44%
2% 3% 4% 5% 6% 7%
8% Non-financial companies Housing
-1 000 -800 -600 -400 -200 0 200
MILLENNIUM BCP COMPANY REPORT
PAGE 10/35
Table 2 – Bank’s capital requirements
E n tity Core T ier 1 Dead lin e
9% Dec 2011
10% Dec 2012
European Banking Authority
9% Ju n 2012 Bank of
Portugal
Source: Bank of Portugal
Fig. 26 – Banking System Core Tier I Capital
Source: Bank of Portugal
Fig. 27 – RWA main Portuguese private banks (EUR bn)
Source: Companies’ accounts
Table 3 – Pension fund information (June 2012)
BCP BES* BPI
Asset Value 2 501 1 185 898
Liabilities 2 393 1 078 814
Coverage 105% 110% 110%
Participants
Pensioners 15 747 5 706 8 054
Employees 9 981 6 007 9 462
Total 25 728 11 713 17 516
Assumptions
Salary increa. 2,00% 2,00% 2,00% Pension increa. 1,00% 1,00% 1,25% Rate of return 5,50% 5,50% 5,50% Discount rate 5,50% 5,50% 5,42% Mortality tables
Men TV73/77 TV73/77 TV73/77
Women TV88/90 TV88/90 TV88/90
* Values of 2011
Source: Companies’ accounts
Core Tier I capital ratio higher than 10% according with the Bank of Portugal criterion by the end of 2012 and 9% pursuant to the European Banking Authority comprising a buffer for exposures to sovereign debt by the end of June 2012.
The concern in reaching the capitalization levels aforementioned has been paramount in actions undertaken by the major Portuguese banks in recent developments. Millennium bcp has resorted to the Fund created upon the adjustment program to assist banks, by issuing EUR 3bn in Contingent Convertible Bonds (CoCos) fully subscribed by the Public State and issued new shareswhich allowed raisingEUR 500mn. BPI also resorted to hybrid instruments – EUR 1.5bn, with EUR 200mn already repaid – while BES complied with the regulations internally, through a share issuance which raised EUR 1.010mn. CGD benefited from a capital injection from Public funds in the order of EUR 1.65bn while Banif has recently finished its recapitalization plan, which involved EUR 1.1bn of Public resources.
The recapitalization measures undertaken by the banking system allied with deleveraging efforts that posed a descending pressure in the RWA (Fig. 27), allowed all the major banks to accommodate solvency levels above the regulatory demand. As of 3Q2012, BCP presented a 12.8% CTI capital according with BoP and 10.3% pursuant to EBA, while BES, BCP, CGD and Totta revealed a 10.7%, 14.8%, 11.8% and 12% CTI levels respectively.
Pension Fund
Millennium bcp as well as other Portuguese banks are required to pay its employees pensions upon retiring, in case of disability and other obligations. Yet, on the end of 2011 the liabilities related to bank’s pensioners as of 31 December 2011 were transferred to Social Security, a measure targeting the objectives set forth in the EAP. This transfer entailed a different discount rate (4%) and mortality tables compared with those used by banks, which led to a negative impact on net results of EUR 117mn in BCP, EUR 107mn for BES and EUR 71mn for BPI.
Still, banks continue to be responsible for increases in pensions, death benefits and contribution to the Heath System (SAMS). In June 2012 the present value of the projected benefit obligations of BCP were EUR 2.393mn, against EUR 5.322mn of December 2010, reflecting the effect of the transfer to SS of EUR 2.747mn. The value of the assets of the Fund stood at EUR 2.221mn in the end of 1H2012, but EUR 280mn of the liabilities were financed through an Extra Fund, generating a surplus of EUR 108mn and coverage
7,9% 8,1%
9,6% 9,6% 11,3%
0% 2% 4% 6% 8% 10% 12%
57
67
26 55
63
25
10 20 30 40 50 60 70
MILLENNIUM BCP COMPANY REPORT
PAGE 11/35
Fig. 28 – Millennium BCP’s Pension Fund asset alocation
Source: Company data
Fig. 29 – Moody’s Credit Rating
Source: Company Data; Moody’s
Fig. 30 – S&P Credit Rating
Source: Company Data; S&P
ratio of 105%. BES and BPI pension systems have a smaller dimension than
BCP’s, and present a higher coverage ratio (110%), hence we believe Millennium BCP is still more exposed to the behaviour of the pension
fund and has a higher probability of incurring in actuarial losses that can
further penalize the group’s results.
BCP group changed the accounting policy used to recognize the actuarial difference between the present value of liabilities and the value of the assets of the Pension Fund – previously it used the corridor method – and as of 2011 these differences are registered against Other Comprehensive Income. During 1H2012, the negative return of 4.1% contributed for an actuarial loss of EUR 155mn.
Funding Position
Ratings
The liquidity constraints faced by Portuguese banks directly reflect the worsening ability of the Portuguese Republic to service its own debt
obligations, an evolution easily perceived by observing the close relationship in their credit ratings (see Fig. 29 and Fig. 30). A downgrade of the long-term rating of the Republic has been successively followed by a
reduction of the gradein Portuguese banks. The deterioration of the credit quality assessment has serious implications for the banking system, since it motivates additional haircuts in the assets of the banking system which act as collateral in funding operations. In a period where the sector is deeply reliable on ECB provisions, a downgrade produces a heavy toll, since it decreases the collateral eligible and can compromise the access to
other sources of funding.
Liquidity sources
The sovereign crisis exacerbated the liquidity restrictions of banks with the closing access to the wholesale debt market. In order to overcome these difficulties, the EAP devised a reduction in the commercial gap of banks byendorsing a transformation ratio of 120% to be attained until the end of 2014 and supplied EUR 35bn in guarantees to be provided by the Government to banks for issued bonds.
The source of funds provided by the ECB has been essential and systematically exploited by financial institutions, having increased from under EUR 2bn in the beginning of 2008 to over EUR 56bn in October 2012, surpassing the EUR 60bn mark in July of the same year (see Fig. 31). This 26%
26%
1%
16% 27%
3%
Shares Bonds
Fixed income Securities Properties
Investment fund Loans and advances
Total: EUR 2 221bn
BCP Portugal
Aa1 Aa2 Aa3 A1 A2 A3 Baa1 Baa2 Baa3 Ba1 Ba2 Ba3 B1
Jan 09 Jan 10 Jan 11 Jan 12
Jan-09
BCP Portugal
AA
AA-B A+
A A-BBB+
BBB BBB-BB+
BB BB-B+
MILLENNIUM BCP COMPANY REPORT
PAGE 12/35
Fig. 31 – ECB Provisions for
Portuguese Banking System (EUR bn)
Source: Bank of Portugal
Fig. 32 – BCP’s exposure to ECB (EUR bn)
Source: Company data
Fig. 33 – BCP’s LMT debt refinancing
needs (EUR bn)1
* Already repaid
1
Including ECB liquidity lines (1 year and LTROs)
Source: Company data
Fig. 34 – Loans granted by Portuguese financial institutions
Source: Bank of Portugal
dependence could have adverse consequences if the monetary authorities change their policies, even though the ECB has been promoting additional measures to encourage market liquidity in the Euro area, by extending the eligibility criteria of assets that may act as collateral in monetary operations, lowering the main reference rate and increasing the maturity of the loans conceded.
Nevertheless, the return of Portuguese banksto the international markets may happen sooner than anticipated. BES achieved an important milestone by issuing EUR 750mn in senior debt not guaranteed by the Public State in November 2012, a scenario not repeated since April 2010. Fitch has already transpired that this event could be replicated by other banks.
Millennium bcp has been one of the banks most reliant from thefunds of ECB, a consequence of its dimension and funding structure. On 3Q2012 the bank had a net exposure of EUR 13.1bn to the ECB, reflecting a reversal of the trend compared with the EUR 15.3bn accumulated in the same period of the previous year (Fig. 32). In addition, there has been a shift in the funding profile of BCP, provided by the resort to ECB’s LTRO with a maturity of 3 years. The pool of assets eligible as collateral for monetary operations presented a buffer of EUR 6.4bn in the end of 3Q2012 (see Fig. 32) and has been reinforced with the issuance of State guaranteed bonds, which amounted EUR 4bn as of 3Q2012. In our positive scenarios, we are assuming that Millennium bcp will assemble the necessary conditions to return to markets in 2014, which should draw a higher funding cost in the mid-term due to the risk associated with the Portuguese market.
The decreasing trend witnessed in 2012 in the exposure to the ECB was mainly led by the reduction in the commercial gap and the inflow of EUR 3bn from the issuance of hybrid instruments. This strategy also contributed for the reimbursement of EUR 5.4bn of medium and long term debt, however the refinancing needs of the bank until 2015 will ensure some challenges as can be seen in Fig. 33.
Loans
The main efforts employed by banks for the convergence of the transformation ratio towards the threshold of 120% featured a widespread deleveraging policy followed by the system. As can be analysed in Fig. 34, lending has tightened in both the household (housing and consumption) and the corporate segment, leading to a reduction of 6% and 10% respectively, from their highest points in the last 2 years.
1,9 15,3
48,8
60,5
54,6
0 10 20 30 40 50 60 70
0 2 4 6 8 10 12 14 16
13,1
6,4
ECB net exposure Available collateral
5,4* 2,0
8,1 7,4
22,9
0 5 10 15 20 25
2012 2013 2014 2015 Total
80 90 100 110 120 130 140 150 160
Dec-09 Sep-10 Jun-11 Mar-12
Non-financial companies Households
MILLENNIUM BCP COMPANY REPORT
PAGE 13/35
Fig. 35 – Grossloans granted by BCP in Portugal (EUR bn)
Source: Company data
Fig. 36 – Deposits in Portugal yearly change (%)
Source: Bank of Portugal
Fig. 37 – Interest rates on new deposits
Source: Bank of Portugal
Fig. 38 – BCP’s Portuguese Deposits
(EUR bn)
Source: Company data
However, the constricted lending of the corporate sector has afflicted with greater incidence the SME segment, which represents the majority of the Portuguese business spectrum, while large and exporting companies display more resilient indicators, maintaining fairly the same levels of indebtedness prior to the crisis.
BCP’s has been reducing its loan exposure in Portugal ever since the 2nd quarter of 2010, falling from EUR 61.0bn to their lowest level on 3Q2012 of EUR 51.8bn, which comprises a 15% decrease. Management has provided guidelines that it will continue to conduct this strategy, in order to comply with the regulatory goals.
Deposits
Traditionally, deposits have been the major source of financing for the banking system. Nonetheless, the onset of the single currency eased the access to the interbank lending system, which allowed banks to resort to cheap short-term international credit lines used to fund their long-term assets in Portugal. The crisis exhausted this strategy for Portuguese banks which have reasserted the importance of capturing deposits for their funding structure.
Particularly in the household segment, deposits have increased successively since 2010 despite the reversing trend observable in 2012 (see. Fig. 36), as opposed to corporate loans, which have decreased since September 2011 after a surge in 2010. This behaviour was steered by an aggressive campaign of banks to captivate on-balance sheet customer
resources, increasing the interest rates offered from February 2010 (0.82% average for households) until September 2011 (4.51%), coupled with an increasing aversion in holding risky off-balance sheet securities. After reaching a more sustainable situation and given the harmful effect of high deposit rates in the margins of banks - as identified by the BoP, imposing capital penalties for those who surpass a limit rate - the interest offered has decreased (1.01% in October 2012).
However, this pattern was not uniform for the whole banking industry. BCP’s deposits have increased in 2011 and beginning of 2012 (EUR 33.1bn), but have reduced since then, dropping to EUR 30.7bn in the end of 3Q2012, penalized by the repurchase of institutional deposits. We believe this discrepancy is accentuated due to the riskiness associated with Portuguese private banks, which does not have the same extent in a State-owned bank as CGD (deposits increased 2.3% during 9M2012).
61 58
55 52
30 35 40 45 50 55 60 65
-7,4% 1,1%
-15% -10% -5% 0% 5% 10% 15% 20% 25%
Non-financial corporations Households
0,0% 0,5% 1,0% 1,5% 2,0% 2,5% 3,0% 3,5% 4,0% 4,5% 5,0%
Non-financial corporations Households
31,4
29,7 30,4
33,1
30,7
MILLENNIUM BCP COMPANY REPORT
PAGE 14/35
Fig. 39 – Transformation ratio
Source: Companies’ accounts
Fig. 40 – Financial Assets held by main Portuguese private banks (EUR bn)
Source: Companies’ accounts
Fig. 41 – Sovereign debt portfolio – September 2012 (EUR bn)1
1
BPI data refers to October 2012 Source: Companies’ accounts
Fig. 42 – Domestic Net Income of major Portuguese banks (EUR mn)
Source: Companies’ accounts
Transformation Ratios
As of 3Q2012 The 120% target transformation ratio was yet to be attained by BCP (138%) and BES (142%), while BPI already crossed the threshold and developed a significant buffer (105%). Given the restraints of BoP and the negative effects of another price war, we deem that BCP and BES will emphasize their deleveraging strategy to meet the target until 2014.
Financial Assets
Another source of liquidity relief for Portuguese banks may arise from the disposal of financial assets. However, this procedure has not been consistently adopted by the major private banks as can be witnessed in the trend displayed in Fig. 40. Further, some criticism has emerged from the application of ECB funds to finance the acquisition of sovereign debt, which has been the leading driver for the evolution of the financial assets held. These securities refer mostly to Portuguese sovereign debt, traded at a much higher yield than the interest paid in monetary operations, but conversely is accepted as collateral in rediscount operations and does not affect the transformation ratio. Although BCP holds the largest sovereign debt portfolio, it is composed with 68% of periphery countries government debt, while in BES and BPI portfolio it represents 77% and 100% respectively. We consider that this increasing pattern can jeopardize the sector systemic risks, since it magnifies the exposure of the system to the sovereign crisis and
opposes banks’ necessity of risk diversification.
Domestic Operations
The scope of Millennium bcp’s operations in Portugal embrace different banking areas, from retail and investment bankingtoprivate banking and asset management. Despite the increasing importance of international operations, Portuguese activity still represents the core market of Millennium bcp. As of 3Q2012 these operations managed approximately EUR 70bn in assets, accounting for 75% of the group’s total, through a network of 861 branches (50% of the total) and despite the increasing trend of banks engaging in various businesses and diversifying its income sources, Millennium bcp main focus remains in the traditional commercial role of banks, benefiting from the biggest branch network existent in Portugal. This profile is observed in the revenues of 9M2012, with 76% having originated from NII and banking fees and commissions.
After years of positive results, the Portuguese banking sector situation
138% 142% 105%
L/D
14,2
13,0 17,6
20,5
9,1
12,6
7 9 11 13 15 17 19 21 23 25
2Q11 3Q11 4Q11 1Q12 2Q12 3Q12
BCP BES BPI
6,9 7,0 7,5
4,86,0 5,6 5,6
4,5
7,3
1Q12 2Q12 3Q12
BCP BES BPI
68%
Exposure to Periphery
Countries 77%
100%
-1 200 -1 000 -800 -600 -400 -200 0 200 400 600
2008 2009 2010 2011 9M12
BCP BES BPI
MILLENNIUM BCP COMPANY REPORT
PAGE 15/35
Fig. 43 – BCP’sPortuguese Net Interest Margin
Source: Company data
Fig. 44 – BCP’s Portuguese assets
under management (EUR bn)
Source: Company data
Fig. 45 – Portuguese investment funds’ assets (EUR bn)
Source: Bank of Portugal
Fig. 46 – NetTrading Income (EUR mn)
Source: Bank of Portugal; Company data
reversed in 2011 (see Fig. 42), with Millennium bcp presenting a net loss of EUR 971mn, penalized by the deterioration of sovereign debt and reinforcement of impairment charges and the effects ensued in 2012,
with BCP exhibiting a net loss of EUR 378mn in Portugal. The deterioration of profitability has been generalized in the banking sector has can be observed in Fig. 42, with BCP, BES, CGD and Banif the most penalized and BPI and Totta the most resilient.
BCP’s NIM has been dropping steadily since 2010– standing at 0.3% in 3Q2012, the lowest value since the banking crisis burst. This decline was justified by the raising funding costs from deposits, thelowering of the Euribor rates – most loans are linked to this reference rate - increasing imparities and in more recent events the interest expenses attributed to liability management operations and cost of CoCos. These drivers contributed for the decrease of 15% in NII between 2008 and 2011 to EUR 999mn and the decrease yoy of 52%from EUR 762mn to EUR 366mn in 9M2012. According with BoP data, NII for the Portuguese banking system illustrates a similar pattern - although not to the same extent, with a decrease of 10% between 2008 and 2011 and a negative change yoy of 39% in the first 3 quarters of 2012.
Market related fees have decreased gradually in recent years. This behaviour has been influenced fundamentally by two different forces. Firstly, the necessity of Millennium bcp to reduce the gap between loans and deposits compelled the bank to attract this source of funds from clients, by offering more captivating rates, motivating a shift from off-balance sheet customer resources to deposits. Secondly, the uncertainty in capital markets has contributed to an increasing aversion in holding riskier market securities reducing the off-balance sheet funds held (observe Fig. 44 and Fig. 45). Comparing this category of fees accumulated in 9M2012 with 9M2008, we observe a decline of 71% in total value.
Net trading income is mainly influenced by the evolution of the financial markets and the composition of the financial assets held. Given the aforementioned hefty exposure of the banking sector to sovereign debt past
years’ trading income has been penalized by the deteriorating quality of the
credits held, but the positive evolution of yields (particularly of Portuguese debt) coupled with gains arising from the repurchase of debt securities at a discount led to an increase in trading gains of the sector in 2012. The aggregated trading gains increased 3.5x yoy in 9M2012, while the income of BCP rose 2x (Fig. 46).
1,9% 1,3%
1,6% 1,4%
0,3%
0,0% 0,5% 1,0% 1,5% 2,0%
4,0 3,9 3,7
3,2 3,2
2,9
1,0 1,5 2,0 2,5 3,0 3,5 4,0 4,5
33
31
28
27
15 20 25 30 35
2009 2010 2011 10M12
404 1428
181 359
0 200 400 600 800 1000 1200 1400 1600 1800
MILLENNIUM BCP COMPANY REPORT
PAGE 16/35
Table 4 – Adjustment Program (EUR mn)
Ad ju stm en t P rog ram 2013-2014
M id T erm
S taf f d ism issed 600
E arly Retirem en ts 300
Severance Package 60
Savings in Staff 30 30
Savings in Adm. Costs 41 58
Savings in Depreciation 9 12
Source: Company data and analyst estimates
Fig. 47 – DomesticC/I major Portuguese private banks (%)
Source: Companies’ accounts
Fig. 48 – NPL as % of total Loans in Portugal (%)
Source: Bank of Portugal
Fig. 49 – Domestic Credit Composition
– September 2012 (%)
Source: Companies’ accounts
Fig. 50 – Returns on Pension Funds1
1
Information for 2012 of BES not disclosed Source: Companies’ accounts
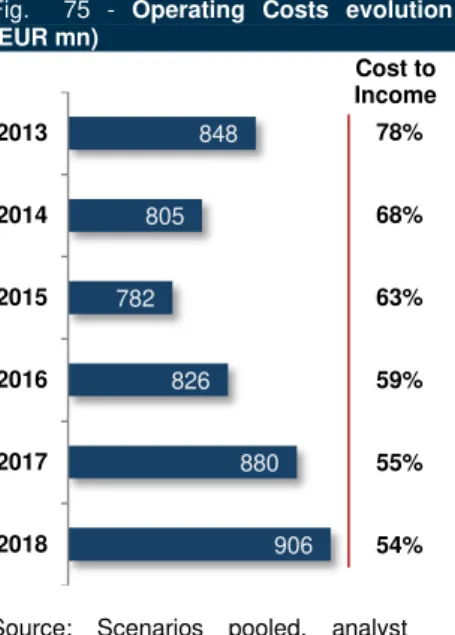
In an effort to return to profitability, the new management team has outlined the urgency in containing operating costs. An adjustment program is underway, which is expected to reduce staff and administrative costs, providing savings of EUR 100mn in the mid-term (see Table 4). In comparison with its peers (Fig. 47) , we can observe that the efficiency ratio of BCP has been fairly in line with the average, whereas BES has constantly delivered lower C/I ratios and BPI presented higher indicators. However, this trend modified in 9M2012, with BCP exhibiting the highest C/I (62%), mostly due to a reduction in banking product yoy (-17%) not complemented with a similar reduction in operating costs (-3%).
The adverse economic context in Portugal continued to deteriorate banks’ loan portfolio in 2012. This strain has affected more severely corporate loans particularly from the SME universe - where BCP has a leadership position - and in the non-tradable sector, while delinquency levels remained fairly low for mortgage credits. In 9M2012 BCP’s domestic loan impairments reached approximately EUR 628mn, representing a cost of risk of 1.62% compared with the 1.46% displayed in 9M2011. Overdue loans are increasing covering 7% of the Portuguese portfolio in 9M2012, above the 6% overdue loans of the banking system. As a result, credit coverage ratios have been pressured, with the provisions of BCP covering 84% of loans overdue for more than 90 days in September 2012, dropping from 96% attained in the same period of 2011. BPI has displayed the strongest credit portfolio, primarily due the concentration of its loans on the low-delinquency household segment.
The negative returns drawn by pension funds have also harmed the profitability of banks in the past years, especially in the case of BCP. As pictured in Fig. 50, the income of pension funds’ assets has been extremely volatile and did not correspond to the asserted expected return of 5.5%. In the past 4 years, BCP only attained a positive return in 2009 (EUR 467mn) and accumulated losses of EUR 813mn. BES and BPI results have oscillated, suffering a heavy loss in 2008 with the onset of the financial crisis. Despite the partial transfer to the Social Security, the magnitude of pension funds – asset value corresponded to 3.1x market capitalisation of BCP, 0.6x of BES and 1.7x of BPI – makes this an additional source of risk for the banking system
and can significantly influence the groups’ results in the future. However, for the last semester of 2012, we do not anticipate any loss drawn from the Fund, mainly due to the soaring of the markets.
62%
44% 55% 55%
40% 45% 50% 55% 60% 65% 70% 75% 80%
2008 2009 2010 2011 9M12
BCP BES
BPI CGD
10,6%
4,1%
2% 7%
12% Non-financial companies Households
63% 32%
4%
55% 41%
5% 14%
26%
60%
Mortgage Companies
Consumer
-121 64
-1 000 -500 0 500 1 000
2008 2009 2010 2011 1H12
MILLENNIUM BCP COMPANY REPORT
PAGE 17/35
Fig. 51 - BCP Loans Distribution
Source: Company data
Fig. 52 – Net Income core international markets (EUR mn)
Source: Company data
Fig. 53 – Greece GDP real growth (%)
Source: Eurostat
Fig. 54 – Millennium Bank revenues and loan impairments (EUR mn)
Source: Company data
Fig. 55 – Provisions for bad loans Greek banking sector (EUR bn)
Source: Bank of Greece
International Operations
The prominence of Millennium bcp’s international activity has been intensified by the domestic struggle in recent years. Foreign subsidiaries emerged as an increasing source of diversification and income, substantiating the success
of the Group’s internationalization strategy carried along the past decades.
However, the bank’s international coverage still represents a double-edged sword. On one hand it controls subsidiaries in the fast-growing economies of Poland, Angola and Mozambique which managed to alleviate the net losses from Portugal, combining positive results of over EUR 111mnin the first 9 months of 2012. In contrast, the bank has two underperforming subsidiaries within its group, Greece and Romania. The most severe case transpires from Greek operations, which single-handily drawn a negative impact of over EUR 554mn up to 30 September 2012 (Fig. 52), mainly through the provision for extraordinary loan losses in the future.
Greece
Greece is deemed as the epicentre of the sovereign crisis and the deepening of its problems has affected this region more severely than any other in the Eurozone. GDP is expected to end 2012 with a yearly real decrease of 6% and to plunge 4% in 2013, as a result of the fiscal discipline imposed by the adjustment program. Naturally, the banking sector has been one of the most afflicted by the recessive behaviour of the economy - striving amid the erosion and haircut of Greece’s public debt, the increasing delinquency of companies and amid a liquidity crisis expanded by the
deposits outflow surge and themistrust of international lenders.
Currently Millennium Bank in Greece accounts for 6% of the group’s total assets, but despite its inferior dimension it has been the main responsible for the losses of bcp in 2012. Although the subsidiary has managed to contain operating costs, stemming essentially from the operational downsize - closure of 57 branches (32%) and the lay-off of 321 employees (21%) since 2010 - it has been striving against a rapidly deteriorating banking income and increasing provision charges (Fig. 54). Notwithstanding, in spite of the dismal outlook the provision of EUR 450mn registered in 2Q2012 is considered by management to be wide enough to cover further imparities in the credit of the bank and the EUR 1.3bn senior funding of Millennium bcp to the subsidiary is collateralized through credit securitization.
The Greek banking sector has suffered in recent years, striving against increasing provision charges, as illustrated in Fig. 55. 2011 was particularly
79% 79% 77% 76% 75% 21% 21% 23% 24% 25%
Portugal International
114
42
100
151
111 15
9
-16
-4
-554 2008
2009
2010
2011
9M12
Poland, Angola and Mozambique Greece
5,5%
-0,2% -4,9%
-7,1% -6,0%
-10% -5% 0% 5% 10%
7,9 45,6
0 20 40 60 80 100 120
Banking Revenues Loan impairments
MILLENNIUM BCP COMPANY REPORT
PAGE 18/35
Fig. 56 – Net income evolution of
Greece’s main banks (EUR bn)
Source: Companies’ accounts
Fig. 57 – Poland GDP real growth (%)
Source: Eurostat
Fig. 58 – UE largest countries population 2012 (mn) 1
1
Year-end estimation Source: Eurostat
Fig. 59 – Major Polish banks revenues estimated 2012 and ROE (Zlt Bn)
Source: Bloomberg; Analyst estimates
Fig. 60 – Millennium Bank revenues and operating costs (EUR bn)
Source: Company data
difficult for the returns of the sector, penalized by the accounting of the Greek Government debt restructuring (Fig. 56). The problems faced by the industry led to a consolidation spree, particularly with foreign groups who sought to dispose its subsidiaries, as the case of Société Générale sale of Geniki Bank and Crédite Agricole disposal of Emporiki Bank in 2012.
Poland
In the past years, Poland became the fastest growing economy in the
EU, evidencing its resilience in 2009 as the only country within the Union to display economic growth - despite the difficulties imposed by the banking crisis. The 6th most populous country in the EU is already well integrated within the group, being the largest beneficiary of the cohesion funds provided by the community. Estimations of GDP real growth stand above 2% for the next years, despite the expected lasting effects from the sovereign crisis in Europe. Adding to the positive economic prospects, the penetration level of banking services in Poland is still low when compared to other EU members, which increases the growth potential for the banking industry.
Millennium Bank is the subsidiary held by Millennium bcp (stake of 65.5%) and responsible for its Polish activity. It is currently the 6th largest bank in Poland in terms of loans to customers and accounted for 14% of the group’s assets as of 3Q2012, managed under its network of 449 branches. Despite transpiring rumours in 2011 of an interest in selling its stake in Millennium Bank, the Group has thereafter asserted the importance of its Polish operations, emphasizing its role as a growth driver for the group. Truly, Millennium bank has been providing a steady stream of inflow for the group reflecting its conservative risk approach (loan portfolio composed by 66% of mortgage credit against 43% average of the group) but also a lower return on equity than most of its polish peers which focus endeavours in the profitable corporate segment (see Fig. 59).
The subsidiary has been consolidating its position, which is reflected in the steady growth of revenues since 2009 and the improvement of the C/I ratio (Fig. 60), reaching an historical low of 56.4% in 3Q2012. Impairment charges have been slightly affected by the exposure to the construction sector, but in overall the low overdue loans ratio – 3.1% of total loans in 3Q2012 - and the strong coverage ratio (101%) convey encouraging signals for the resilience of Millennium Bank and its ability to capture the imminent progress of the Polish economy.
-15 -10 -5 0 5
2008 2009 2010 2011 9M12
NBG Emporiki Alpha
6,2% 6,8% 5,1%
1,6%
3,9% 4,3%
2,4%
0% 2% 4% 6% 8%
82 65
63 61
46 39
0 20 40 60 80 100
17
12
6
6
5
2
0 10 20
PKO Bank Polski
Bank Pekao
BRE Bank
Bank Zachodni ING Bank Slaski Millennium
Bank
ROE
17% 14% 14% 16% 13% 10%
0 200 400 600
2008 2009 2010 2011 9M12 Revenues Op. Costs
MILLENNIUM BCP COMPANY REPORT
PAGE 19/35
Fig. 61 – Mozambique real GDP growth (%)
Source: IMF
Fig. 62 – Operating revenues Millennium bim (EUR bn)
Source: Company data
Table 5 – Branches and workers of Millennium bim evolution
08 09 10 11 3Q12
Branches 100 116 125 138 150
Workers 1762 1936 2088 2377 2490
Source: Company data
Fig. 63 - Angola GDP real growth (%)
Source: IMF
Fig. 64 – Net income of selected Angolan banks (EUR mn)
Source: Companies’ accounts
Mozambique
Mozambican economic growth has been fuelled by an increase in foreign investments and is considered one of the most attractive destinations for mining and natural gas developments. The opulence of natural resources allied with a stable political situation and estimated infra-structure spending in mega projects ensure the continuity of high levels of growth for the economy, which was unharmed by the recent crises (Fig. 61).
Millennium bcp’s roots in Mozambique date back to 1995, upon the creation of Millennium bim. Currently, the group holds a valuable stake of 66.7% in the subsidiary, which is the market leader in the banking system of the country, with a 36% market share in loans granted, according with data collected from Bank of Mozambique. BIM benefits from its strong presence through a network of 150 branches, being the largest employer - 2.490 workers - and taxpayer of the Mozambican banking industry (Table 5). Undoubtedly, along with Polish operations, BIM has been a crucial source of income for the group, despite its dimension (accounted for 8% of BCP’s international assets). This is explained by the attractive conditions of Mozambique environment and the consolidated market position of BIM, leading to efficiency ratios below 50%, low impairment charges and high levels of ROE (Fig. 62).
The low banking penetration levels of Mozambique place Millennium bim in a privileged positionto benefit from the promising future of this emergent
economy.
Angola
Angola is currently the 3rd largest economy in Africa, benefiting from the strong post-civil war growth figures, mostly originated from the abundance of natural resources, especially petroleum reserves. The richness of Angola’s soil and the investment focus in large infrastructures and agriculture shall underpin future economic real growth, which according with estimations should stand above 5% in the following years.
The history of Millennium bcp in Angola has been recent, stemming from the partnership of the group with one of its main shareholders – Sonangol – which led to the creation of BMA - held in 50.1% by BCP. Given its recent existence, BMA is yet to attain a prominent position in the banking setting, but it has been showing strong growth indicators. As of 3Q2012 it was represented through 66 branches disseminated along the most important regions of the country, a network that has been constantly increasing since the foundation 6,8%
6,3% 7,1%
7,3% 7,5%
5,0% 5,5% 6,0% 6,5% 7,0% 7,5% 8,0%
0 50 100 150 200 250
2008 2009 2010 2011 9M12
45% 44% 43% 38% 44% 44% 36% 32% 38% 28% C/I
ROE
13,8%
2,4% 3,4%
3,9% 6,8%
1% 3% 5% 7% 9% 11% 13% 15%
0 50 100 150
2008
2009
2010
2011
9M12
BESA BFA BMA
7% 24% 17%