THIS REPORT WAS PREPARED BY ANTÓNIO PROENÇA, A MASTERS IN FINANCE STUDENT OF THE NOVA SCHOOL OF BUSINESS AND ECONOMICS, EXCLUSIVELY FOR ACADEMIC PURPOSES.THIS REPORT WAS SUPERVISED BY ROSÁRIO ANDRÉ WHO REVIEWED THE
VALUATION METHODOLOGY AND THE FINANCIAL MODEL. (SEE DISCLOSURES AND DISCLAIMERS AT END OF DOCUMENT)
See more i nfor mation at WWW.NOVASBE.PT Page 1/32
M
ASTERS IN
F
INANCE
E
QUITY
R
ESEARCH
EABL turnover is forecasted to
growth
at a CAGR of 5.2% over the forecasted period, while EBITDA margin is expected to stay constant at values above 30%. Company turnover is expected to increase its segment (beer vs spirits) and geographical diversification over the forecasted period.
Most of EABL forecasted growth is expected to be generated by the spirits business mainly in faster growing markets (Tanzania Uganda and South Sudan) as Kenyan mature beer market is expected to slowly recover from the recent taxation changes.
EABL is expected to increase earnings payout ratio in the short-term, returning to pre-restructuring dividend levels during the forecasted period.
Company description
East African Breweries Limited (EABL) is a Kenyan company responsible for manufacturing, marketing and selling a wide range of private label beer brands and several internationally well-known spirits brands in Kenya, Uganda, Tanzania and South Sudan.
E
AST
A
FRICAN
B
REWERIES
L
TD
C
OMPANY
R
EPORT
A
LCOHOLICB
EVERAGESI
NDUSTRY 05JANEIRO 2016A
NTÓNIOP
ROENÇAantonio.proenca.2014@novasbe.pt
Sustaining
High Margins…
… in fast
growing mark ets
Recommendation: Buy
Price Target FY16: 313.77 Kshs
Price (as of 5-Jan-16) 277.00 Kshs
Reuters: EABL.NR, Bloomberg: EABL.KN
52-week range (Kshs) 253.00-340.68
Market Cap (Kshs m) 219,016.4
Outstanding Shares (m) 790,673
Free Float Shares (m) 395,099
Source: Bloomberg, Analyst’s Estimations
Company v s KNSMIDX
Source: Bloomberg Data
(Values in Kshs’ 0000 000) 2015 E 2016 F 2017 F
Revenues 64,420 70,452 72,963
EBITDA 21,526 23,297 23,079
Net Profit 9,575 15,177 12,042
Net Profit (Adjusted) 9,575 10,967 11,842
EPS 12.11 19.20 15.23
EPS (Adjusted) 12.11 13.87 14.98
P/E (DCF Implicit) 26.79 24.38 24.30
EV/EBITDA (DCF implicit) 13.63 13.06 14.10
DPS 6.00 9.16 7.93
Dividend Yield (as of FY) 1.85% 2.71% 2.18%
Note: Adjusted Net Profit, Adjusted EPS and P/E (DCF Implicit) were adjusted for non-recurrent items.
Source: Company Data, Analyst’s Estimates
70 75 80 85 90 95 10 0 10 5 11 0 11 5
EABL KNSMID X
EABL is forecasted to sustain EBITDA Margins abov e 27% (with a slightly negative forecasted trend), while sustaining adj usted Net Profit Margins aligned w ith historical lev els
(ranging betw een 13% and 16% for the forecasted period) as a result of the expected decrease in Finance Costs.
Company Turnov er is forecasted to grow th at a CAGR of 5.73% ov er the period 2015 - 2022, mainly due to a strong growth in the spirits segment (forecasted CAGR for the same period of 11.54%, which compares with a forecasted CAGR of 3.58% for the beer segment)
Company Beer and Spirits Volume Turnov er grow th in Kenya Uganda and Tanzania is forecasted to be aligned w ith
market v olume grow th, while Beer Volume Turnov er is expected to increase abov e the market grow th rate in South
Sudan
EABL’s lack of ability to increase prices at a rate close to
local forecasted inflation lev els is expected to constrain Turnov er Value grow th.
EABL is forecasted to increase payout ratios ov er the period 2015 - 2022 from last six years historical minimum payout rate of 49% in 2015 (6.00 Kshs per share) up to 71% in 2022 (9.78 Kshs per share).
EAST AFRICAN BREW ERIES LTD COMPANY REPORT
PAGE 2/32
Table of Contents
Executive Sum m ary ... 3
Com pany Overview ... 4
Company Description ... 4
Business Operating Overview ... 5
Shareholder Structure ... 6
Historical Performance Overview ... 7
Disinvestment in Central Glass Indu stries ... 8
Business Environm ent Overview ... 9
Macroeconomic Environment ... 9
Kenya Macroeconomic Environment ... 9
Uganda Macroeconomic Environment ... 10
Tanzania Macroeconomic Environment ... 10
South Sudan Macroeconomic Environment ... 10
Microeconomic Environment ... 11
Segm ental Perform ance ... 13
EABL in Kenya ... 13
EABL in Uganda ... 15
EABL in Tanzania ... 17
EABL in South Sudan ... 18
Com pany Perform ance ... 20
Fin ancials ... 21
Capital Structure ... 21
Net Working Capital Requirements ... 22
Capital Expenditures ... 23
Payout Policy ... 23
Ca sh Flow Currencies ... 23
Alternative Scenarios ... 24
Optimistic Scenario ... 25
Conservative Scenar io ... 25
Pessimistic Scenario ... 26
Valuation ... 27
Sensitivity Analysis ... 28
Multiples ... 29
Fin ancial St atements ... 30
EAST AFRICAN BREW ERIES LTD COMPANY REPORT
PAGE 3/32
Executive Summary
East African Breweries Limited is a Kenyan subsidiary of Diageo PLC, operating in the beer and spirits business across several Sub-Saharian Africa countries. Company turnover is mostly generated by the beer business (80% of total company turnover in 2015), being forecasted to stay so in the medium term (forecasted to represent close to 65% of total turnover in 2022). On the other hand, spirits business is expected to see its relevance for company turnover slightly increased (from 20% in 2015 to 35% in 2022). Turnover is also forecasted to increase its geographical diversification, as a result of last 5 years geographic market expansion strategy (Kenyan market contribution to total
EABL’s turnover is forecasted to decrease from 68.48% in 2015 to 60.62% in
2022, while Uganda Tanzania and South Sudan contribution to total turnover are expected to increase during the same period from 17.90% to 23.02%, from 10.72% to 12.31% and from 2.90% to 4.06% respectively).
EABL’s value turnover growth is mostly based on strong local operating market
volume growth rates, (with the exception of South Sudan, where EABL’s volume turnover is forecasted to increase at rates superior to market ones). EABL’s inability to capture local inflation trough out price increases is expected to persist in the short to medium term, thus limiting the company ability to power up value growth rates. This results in a forecasted nominal value turnover CAGR for the period 2015 - 2022 of 5.73% (just 0.44% above forecasted inflation of 5.29%). EABL is forecasted to sustain Returns on Invested Capital above company forecasted average cost of capital (under all the forecasted scenarios), thus creating value in the long term. The trend is however for ROIC to decrease in the medium term, as operating in high inflation countries with a limited ability to increase product prices is expected to decrease company overall invested capital profitability.
Operating in developing markets brings several additional idiosyncratic risks mainly related to macroeconomic and political conditions changes. The most
relevant ones for EABL’s operations are related with South Sudanese operations
(newest country in the world, with considerable volatile economy and political settings). The impact of these risks in EABL’s bottom line is however highly limited by its local low risk internationalization strategy (selling in South Sudan through Kenyan operations, thus limiting company exposure to this market). We did not found any evidence on the existence of a systematic risk premium in the Kenyan alcoholic beverages industry.
We are thus optimistic on East African Breweries Limited, resulting in a buy recommendation based on a target price for 2016’s year end of 329.59 Kshs (implicit annual return of 21.85%).
Figure 1: Tusker Lager, Bell Lager and Serengeti Premium Lager, EABL’s strongest beer brands in Kenya, Uganda and Tanzania respectively
5% 10 % 15 % 20 % 25 % 30 % 35 %
20 13 A 20 15 E 20 17 F 20 19 F 20 21 F Base C ase Scenario Op tim istic Scenario C onservative Scen ario P essimistic Scen ario WACC
-6 .00 % -4 .00 % -2 .00 % 0. 00 % 2. 00 % 4. 00 % 6. 00 % 8. 00 % 10 .0 0% 12 .0 0% 14 .0 0%
2 0 1 3 A 2 0 1 4 A 2 0 1 5 E 2 0 1 6 F 2 0 1 7 F 2 0 1 8 F 2 0 1 9 F 2 0 2 0 F 2 0 2 1 F 2 0 2 2 F
No minal Real
Figure 3: EABL estimated annual Cash Flows growth rate (forecasted as Return on Invested Capital X Reinvestment Rate)
Figure 4: EABL estimated ROIC and WACC
-4 .00 % -2 .00 % 0. 00 % 2. 00 % 4. 00 % 6. 00 % 8. 00 % 10 .0 0%
2 0 1 3 A 2 0 1 4 A 2 0 1 5 E 2 0 1 6 F 2 0 1 7 F 2 0 1 8 F 2 0 1 9 F 2 0 2 0 F 2 0 2 1 F 2 0 2 2 F
Turno ver Nomin al yoy% Turno ver Real yoy% In flation
Figure 2: EABL’s nominal and real
Value Turnover Annual Growth Rate
Source: Company Data, Analyst’s
Estimates
Source: Company Data, Analyst’s
Estimates
Source: Company Data, Bloomberg
Data, Analyst’s Estimates
EAST AFRICAN BREW ERIES LTD COMPANY REPORT
PAGE 4/32
Company Overview
Company Description
East African Breweries Ltd (EABL) was formally incorporated as a Kenyan private company in 1922 under the name Kenya Breweries Ltd, becoming a public limited company twelve years later. In 1936, the company was named EABL after a merger between Kenya Breweries Ltd and Tanganyka Breweries Ltd, the two leading brewing companies in Kenya at the time .
Currently, EABL is one of the leading companies in the branded alcoholic beverages segment in East Africa. It is responsible for manufacturing, marketing and selling a wide range of private label alcoholic drinks targeted to the economic, mid-priced and premium segments, while working at the same time as a local distributor for several well-known international spirits brands. EABL is present in four countries through more than 15 subsidiaries. The most relevant subsidiaries include Kenya Breweries Ltd (fully owned), Uganda Breweries Ltd (majority stake of 98.2%), Serengeti Breweries Ltd (controlling stake of 51%) and United Distillers Vintners Limited (46.32% minority stake, but managed for Diageo PLC which owns a controlling stake of 53.68%). The first three subsidiaries (KBL, UBL and SBL) are responsible for several private label beer brands in Kenya, Uganda and Tanzania respectively, while UDV is responsible for the group spirits business in Kenya.
EABL is one of the largest beer manufacturers in East Africa, with a leadership position in Kenya (historical volume market shares above 70% for the period 2008 - 2015), a strong market presence in Uganda and Tanzania (second biggest player in both markets with expected volume market sha res for 2015 of 42.8% and 15.6%), while trying to built a relevant presence in the newly cre ated South Sudanese market (expected volume market share for 2015 of 6.2%). The company also exports some private label beer brands mainly from Kenya and Uganda to other East African Countries (Rwanda and Burundi mostly).
EABL markets and sells several international well-known spirits brands (which
are part of Diageo’s products portfolio), a category that recorded a strong growth
over the period 2012-2015 (12.1% Volume Sales CAGR). The company currently operates mainly in Uganda, but is trying since 2012 to take advantage of its strong beer distribution network in Kenya and Tanzania in order to support local spirits market penetration. This business segment is expected to see its strategic position to EABL increase, as market growth in the short to medium term is expected to highly surpass beer segment growth (EABL’s spirits revenues are forecasted to grow at a nominal Value CAGR close to 12% for the period 2015 - 2022, while beer revenues are expected to growth at a Value CAGR of just 4%).
0% 5% 10 % 15 % 20 % 25 %
0. 00 0. 25 0. 50 0. 75 1. 00
20 12 20 13 20 14 20 15 Keny a Ugan da Tazania yoy %
-5 % -4 % -3 % -2 % -1 % 0% 1% 2% 3%
3. 00 3. 50 4. 00 4. 50 5. 00 5. 50 6. 00 6. 50
20 12 20 13 20 14 20 15 Keny a Ugan da Tazania Sou th Sud an yoy %
0% 1% 2% 3% 4% 5%
20 00 0 25 00 0 30 00 0 35 00 0 40 00 0 45 00 0 50 00 0
20 12 20 13 20 14 20 15 Keny a Ugan da Tanzan ia Sou th Sud an yoy %
Figure 7: Total Beer Quantities Sold in million hectoliters
Figure 8: Total Spirits Quantities Sold in million hectoliters
Source: Company Data, Canadean
Data
\
Source: Company Data, Canadean
Data
Source: Company Data, Canadean
Data
0% 2% 4% 6% 8% 10 % 12 % 14 % 16 % 18 %
0 50 00 10 00 0 15 00 0
20 12 20 13 20 14 20 15 Keny a Ugan da Tanzan ia yoy %
Figure 6: Spirits Segment total revenues by geographical segment (Kshs ‘000 000)
Source: Company Data, Canadean
Data
EAST AFRICAN BREW ERIES LTD COMPANY REPORT
PAGE 5/32
In order to complement the company products portfolio, EABL also markets and sells several other products; including non-alcoholic malt beverages targeted to the adult audience and imported wines (which are mainly imported by UDV into Kenya, Uganda and Tanzania). Both segments are currently immaterial, representing together less than 1% of EABL group Revenues.
Business Operating Overview
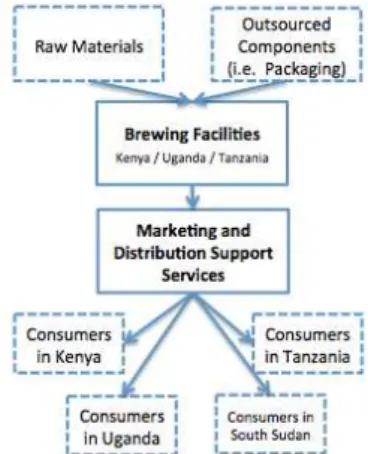
EABL initial business strategy was to work as a vertically integrated consumer products company. The company would directly control the production of the major raw materials used in the brewing process (cereal grain producers were
integrated under EABL’s management umbrella) brewer the full company
products portfolio and finally market them to consumers. However, as local competition in Kenya increased and growth prospects in Uganda and Tanzania slightly changed, EABL decided to change the company operating strategy. Most of the raw materials are now purchased from outside suppliers (EABL’s
management just indirectly controls suppliers raw materials quality), the product packaging is outsourced from a previously owned subsidiary (Central Glass Industries) and distribution is outsourced from local distributors, thus allowing the company to focus on its core value creation activiti es. As such, EABL is now solely engaged in manufacturing, marketing and selling alcoholic and non-alcoholic drinks. It is also relevant to note that even though EABL operates through several local subsidiaries, company operations are well centralized under EABL’s group management policy (which is indirectly controlled by Diageo PLC). EABL is commonly known as a forward-looking company, introducing a bunch of new beer brands regularly1. The group products portfolio currently includes more
than 20 private label beer brands, more than 10 international spirits brands and 2 major non-alcoholic drinks.
The company is also set to focus on improving the distribution network efficiency by increasing the number of distributors, developing efficient cashless payment systems in order to facilitate transactions with distributors and strengthening consumer loyalty by increasing marketing effectiveness2, as a way to overcome
logistical barriers caused by local underdeveloped infrastructures.
EABL has several production plants spread across Kenya, Uganda and Tanzania with a combined beer brewing capacity of 10.5 Million hectolitres. Expansion programs developed in 2015 will allow EABL to increase brewing capacity by 1 Million Hectolitres in 2016. As EABL currently operates considerably below total installed brewing capacity, expansion plans are developed not to directly support
1 During the last 5 years (2011 - 2015), EABL’s beer portfolio in Kenya increased at a rate two times superior to the one of local competitors
according to Euromonitor Data.
2 A strong prove of this marketing effectiveness was the company ability to increase beer volume market shares in Kenya in 2014 (from 68.2% in
2013 to 72.8% in 2014) after the introduction of a special taxation in one of the strongest EABL’s beer brands increasing the product prices to
consumers by 50% and decreasing the demand for this product by 80%. (see Segmental Performance in Kenya section).
Figure 9:EABL’s Operating Structure
Figure 10: Annual Beer Brewing Capacity in Million Hectoliters
Source: Analyst’s Research
Source: Company Data, Canadean
Data, Analyst’s Estimates
40 % 45 % 50 % 55 % 60 % 65 % 70 % 75 % 80 %
0 2 4 6 8 10 12
EAST AFRICAN BREW ERIES LTD COMPANY REPORT
PAGE 6/32
volume sales growth, but instead to match geographical production and sales, thus lowering Distribution and Warehousing unitary costs (this becomes even more relevant as no relevant scale effect is forecasted if concentrating production in a smaller number of factories with higher brewing capacity than current ones).
Shareholder Structure
In 1954, EABL’s initial public offering took place i n the Nairobi Stock Exchange (Kenya). Since then, the company went through one extra seasoned equity offer before becoming the first company in East Africa to reach USD$ 1 Billion in value by 2005. Currently, it is the second biggest company in Kenya (measured by Market Enterprise Value), being part of the country reference Index (Nairobi Securities Exchange Ltd 20 Index).
EABL has 790,673,492 shares outstanding and is cross-listed in Kenya, Uganda and Tanzania (Nairobi Stock Exchange, where most of the free float is traded; Uganda Stock Exchange and Dar es Salaam Stock Exchange respectively). All shares of EABL are ordinary and of the same class, conferring upon their holder one voting right. A controlling stake of 50.03% is
controlled by EABL’s parent company Diageo PLC3.
Diageo is a British company that operates worldwide in the alcoholic drinks industry. It ranks first in Spirits production and marketing (worldwide volume market share of 9.5% in 2014) and 13th in beer production and marketing
(worldwide volume market share of 1% in 2014). Although beer represented less than 20% of 2015 Diageo’s Net Sales Value, the company sees this segment as a crucial driver for future value creation in Africa (a market which represented
close to 10% of Diageo’s Net Operating profit in 2014). The company also sees
EABL, which is Diageo’s only subsidiary operating in the East African Market, as a crucial driver for future growth in the African beer market. Spirits business,
which drive most of Diageo’s value (represented more than 80% of 2014
Diageo’s Net Sales Value), is expected to stay as a local bet, while increasing its
overall contribution for EABL’s bottom line. EABL currently contributes to close to
1/3 of Diageo’s Net Sales Value and Profit in Africa (which corresponded to
roughly 3.33% of Diageo’s overall Net Sales Value and Profit in 2014).
Other investors include several Kenyan and international investment companies (being the most relevant ones CFC Stanbic Nominees & Standard Chartered Nominees, two Kenyan investment companies) that individually have never achieved an equity stake above 5%, while sustaining their position over periods of time typically superior to 1 year. As such, EABL’s ownership structure has been considerable stable over the last 5 years.
3 42.82%, 4.60% and 2.61% trough out Diageo Kenya Ltd, Diageo Holdings Netherlands B.V. and Guiness Overseas Ltd respectively. Diageo ,
50.03%
Standard Chartered Nominees,
7.43% CFC Stanbic
Nominees, 1.01%
Free Float, 41.53%
Other, 49.97%
Figure 11: Shareholders Ownership Structure (2015)
Source: Company Data
Figure 12: Worlwide Spirits Volume Market Shares for 5 top players (2014)
Source: Euromonitor Data
20.80%
9.70%
1.00% 31.00%
Anh euser-Busch In Bev NV SABMiller P lc Diageo Plc
Figure 13: Worlwide Beer Volume Market Shares for top 13 players (2014)
Source: Euromonitor Data
9.50% 4.50%
3% 2.80% 2% 78.20%
Diageo P ern od Ricard Hite Jin ro Thai Beverage Beam S un tory Oth ers
Figure 14:EABL’s and Diageo’s last 5
years stock prices comparative
performance (base date: 1/1/2010)
1 00 1 50 2 00 2 50 3 00 3 50
EABL Diageo
EAST AFRICAN BREW ERIES LTD COMPANY REPORT
PAGE 7/32
Historical Performance Overview
EABL was able to see company revenues grew at a nominal CAGR of 10.74% during the last six years (2.97% above average local inflation of 7.77%), while being able to sustain stable Gross Margins4 close to 50% over the same period.
This growth is however considerable biased by the initial consolidation of SBL in 2012 financial results after the acquisition of a 51% equity stake in the company (CAGR for the same period drops to 8.30% if adjusting for SBL acquisition, just 0.53% above average inflation). As increasing marketing activities have driven selling costs up (at a CAGR of 18.7% for the same period), company EBIT DA Margin and Net Profit Margin adjusted for non-recurrent expenses5 are now bellow historical levels. This
increase in selling costs is mainly justified by the company desire to sustain its position in Kenya, Uganda and Tanzania, while trying to build a relevant presence in South Sudan. It is also aligned with the increase in premium products contribution for EABL’s portfolio, which contributed to the previously described increase in selling costs, thus offsetting the correspondent increase in Gross Margins. As such, it is expected to persist in the medium to long term, thus placing a ceiling to possible increases in company margins. EABL has been able to sustain constant Returns on Assets close to 20% during the last years, building on a strong company ability to efficiently generate earnings from operating assets. When comparing 2014 historical value with comparables levels, EABL stands as the best performer. This performance is mainly sustained by EABL high Net Profit Margin (4th largest in the list of comparables6) combined
with high Total Asset Turnover values (2nd largest).
Return on Investment is at levels close to 35% after a relevant drop in 2011. This drop was mainly justified by the acquisition of a 51% stake in SBL, which increased company total operating assets net of operating lia bilities by 42% (representing 75% of the 62% yearly increase in Total Invested Capital in 2011). EABL is also the top performer regarding Return on Investment.
Return on Equity was stable at values close to 35% (average inflation during the period was of 7.77%), before a huge increase of more than 100% in 2012. This increase is correlated with the changes in the company capital structure, which become highly leveraged in 2012 (Book D/E Ratio increased from 0.85 in 2011 to 5.52 in 2012). This leverage increase was due to a loan subscription from Diageo
4 Gross Margin includes Revenues plus Raw Materials, Consumables, Distribution, Warehousing, Staff and Maintnance Costs; thus
differing from reported Gross Margin which takes in consideration a stake of company depreciations.
5 Adjusted Margins do not account for non-recurrent items (such as restructuring costs and profits on subsidiaries alienations)
6 In this section, comparables refers to the wide comparables defenition explained later in the Valuation Section including Anheuser-Bush
Ltd; Cia Cervejarias SA; Carlsberg A/S; United Breweries Ltd; Heineken NV; Nigerian Breweries PLC; SABMiller PLC and Diageo PLC
Figure 16: EABL’s profitability
measures
10 % 30 % 50 % 70 % 90 % 11 0% 13 0%
20 10 20 11 20 12 20 13 20 14 20 15 ROA ROE ROI
Figure 15:EABL’s Revenue, EBITDA and Gross Profit (Kshs’ 000
000)
0. 0% 20 .0 % 40 .0 % 60 .0 %
N
e
t
P
ro
fi
t
M
a
r
g
in
R
O
I
R
O
E
R
O
A
Figure 17: Comparables’ profitability
measures (2014 Fiscal Year)
0% 20 % 40 % 60 %
0 10 00 0 20 00 0 30 00 0 40 00 0 50 00 0 60 00 0 70 00 0
20 10 A 20 11 A 20 12 A 20 13 A 20 14 A 20 15 E Adj N et P ro fit EBITDA Gro ss P rofit Reven ues Gro ss M argin EBITDA Margin Adj N et P ro fit Marg in
Source:Company Data, Analyst’s Estimates
Source: Company Data, Bloomberg
Data, Analyst’s Research
Source: Company Data, Bloomberg
Data, Analyst’s Research
5. 0% 10 .0 % 15 .0 % 20 .0 % Anh euser-Busch
C ia Cervecerias SA C arlsberg A/S Un ited Breweries Lt d
Hein eken NV Nigerian Breweries P LC SAB Miller P LC Diageo PL C East African Breweries
Figure 18:Comparables’ Adj. Net Profit
Margin (2014 Fiscal Year)
Source: Company Data (Companies
EAST AFRICAN BREW ERIES LTD COMPANY REPORT
PAGE 8/32
in order to proceed with a subsidiary re-purchase (a 20% stake in KBL was repurchased from SABMiller in 2012). Due to its highly leveraged capital structure, EABL currently has a ROE far above its competitors. As leverage levels are expected to return to ratios closer to pre - 2012 levels over the next years, EABL’s ROE is also expected to decrease.
EABL ability to generate cash flows from its operating activities has allowed the company to consistently distribute dividends with payout ratios above 50%. The recent trend to reduce payout ratios is a result from the recently undertaken reorganization process (administrative reorganization process undertaken from 2013 to 2015, which reduced Administrative Recurrent Expenses by 16% in 2015, increasing EBIT adjusted margin by 3%), which increased short-term capital needs and, as such, reduced profit distributions.
Disinvestment in Central Glass Industries
During the last Extraordinary General Meeting that took place on the 27th May 2015, EABL shareholders “approved the previously announced” agreement for the sale of EABL’s glass bottling packaging subsidiary to Consol Glass Industries (announced on the 30th April 2015). Consol agreed to pay 4.5 million Kshs for the full ownership, in a deal that should go up to 5 million Kshs Net of taxes conditional on two covenants. EABL accepted to provide 14 months of previously defined management and general services to CGI in exchange of a monthly fee of 0.1 million Kshs and to keep CGI as the main supplier of glass bottles over the next five fiscal years in exchange of a fee of 0.42 million Kshs in five years. We value this deal at roughly 4.5 million Kshs7 at time of completion (end of 2015
Financial Year), with a valuation implicit market-to-book ratio of 2.68 (compares with comparables assets market-to-book ratio of 2.468). Company operating
profitability is not expected to be directly affected by this deal, as neither product unitary costs neither net working capital requirements will be directly affected. In fact, both deal fees work as a small but relevant incentive for both companies to keep their partnership sustaining current business conditions while not affecting current EABL’s operating margins. Both our estimates and stock market reactions (stock price did not changed significatively after the deal announcement, the date at which the deal became “implicitly official” due to
EABL’s previously described ownership structure) value the deal at a fair price.
This strategic move will however allow EABL to focus its activity on the company core business, while using the deal proceeds to partly repay Diageo high interest
loan, thus lowering overall EABL’s financing costs.
7 Selling price was not discounted as it will be fully paid in cash in 2015 Q4 (2016FY), while fees were discounted at EABL’s unlevered
cost of capital, as it is the rate that best describes cash flows risks (fees are directly correlated with EABL’s operations and, as such, are as risky as company operations)
8Considering EABL’s comparables, as there are no pure comparables to CGI currently publicly traded. 0. 00 %
1. 00 % 2. 00 % 3. 00 % 4. 00 % 5. 00 % 6. 00 % 7. 00 %
0. 00 1. 00 2. 00 3. 00 4. 00 5. 00 6. 00 7. 00 8. 00 9. 00 10 .0 0
20 10 20 12 20 14 Fin al Year Divid end Pe r S hare In terim Div id end P er Share Dividen d Yield
Figure 20: Dividend per Share (Kshs) and Dividend Yield (2010-2015)
0 1, 00 0 2, 00 0 3, 00 0 4, 00 0 5, 00 0
Sellin g P rice (N et of Taxes)
Framework Su pp ly Agreemenen t
Fee (Ne t of Taxes)
Man agemen t an d Assistance Fee (Ne t of Taxes)
Figure 21: CGI Selling Price and Fees (Kshs’ 000 000)
Source: Company Data, Bloomberg
Data
Source: Company Data (30th April
2015; EABL Circular to Shareholders), Analyst’s Estimates 28 7 29 2 29 7 30 2 30 7 31 2 31 7 32 2 32 7 4 / 2 2 / 1 5 4 / 2 4 / 1 5 4 / 2 6 / 1 5 4 / 2 8 / 1 5 4 / 3 0 / 1 5 5 / 2 / 1 5 5 / 4 / 1 5 5 / 6 / 1 5 5 / 8 / 1 5
Figure 22:EABL’s Stock price reaction
to deal announcment (Kshs)
Note: yy axis maximum and minimum
correspond to pre announcment 3 months EABL’s stock price minimum and maximum prices.
Source: Bloomberg
0.330 0.734 0.471 1.207 0.553 0.763 0.493 0.419 0.962 2.627 1.540 2.446 2.097 2.589 2.031 1.844 2.788 5.013 Anh euser-Busch C ia Cervecerias SA C arlsberg A/S Un ited Breweries Lt d
Hein eken NV Nigerian Breweries P LC SAB Miller P LC Diageo PL C E ast African Breweries
Equity Multiplier Total Asset Turno ver
Source: Company Data (Company
2014’s Annual Reports)
Figure 19: Comparables’ Data (2014
EAST AFRICAN BREW ERIES LTD COMPANY REPORT
PAGE 9/32
Business Environment Overview
Macroeconomic Environment
Real GDP growth in Sub-Saharian Africa decreased from values above 8% in the period 2010 - 2013 to values close to 6.5% in 2013 and 2014. The outlook is for Real GDP growth rate to stay below historical levels for the following years as the slower than expected growth in China, the tig htening of monetary police in the United States and the slower than expected economic recovery in Europe pose a relevant pressure on overall Sub-Saharian African economy. These events decreased the demand for the region’s commodities
(which account for almost half of the region GDP), driving overall prices down and hurting economic growth. Sub-Saharian Africa’s oil exporters (such as South Sudan) are currently under a substancial fiscal and current account balance pressure driven by the current low oil prices, hurting governmental spending and, by consequence, private consumption. On the other hand, non-oil exporters (such as Kenya, Uganda and Tanzania) should take advantage of lower commodities prices, which are expected to contribute to a decrease in inflation levels, increasing private purchasing power and, as consequence, boosting domestic demand. As current macroeconomic forecasts have implicit low commodities prices (i.e. Brent Prices below $ 45 USD), short and medium term macroeconomic forecasts are highly dependent on the evolution of this variables.
Kenya Macroeconomic Environment
After a Real GDP CAGR close to 6% over the period 2010-2015, Kenya Real GDP is expected to keep growing above the Sub-Saharian average with a forecasted CAGR for the period 2015-2020 of 6.93%. This historical growth was a result of stable macroeconomic fundamentals supported by a prudent fiscal policy, thus supporting a positive economic outlook. Economic future growth is forecasted to be mainly driven by commendable growths in the services sector. Country overall purchasing power is also expected to increase by 50% in 5 years (above Sub-Saharian forecasted growth of 39% for the same period).
However, the overall business environment in Kenya has been one of the most debated topics, as several infrastructure, energy and security issues still need to be addressed in order to support both long-term economic growth and an effective business development. Currently, consumer product companies operations are considerable constrained by local underdeveloped access infrastructures and volatile energy supplies, while terrorist attacks are still common. On the other hand, country political stability is seen as relatively high.
3% 4% 5% 6% 7% 8% 9% 10 %
20 10 20 11 20 12 20 13 20 14 20 15 20 16 20 17 20 18 20 19 20 20 Real GDP Gro wt h In flation
Figure 23: Sub-Saharian Africa Historical and Forecasted Real GDP Growth Rate and Inflation Rate
Figure 24: Africa Map
2. 50 % 3. 50 % 4. 50 % 5. 50 % 6. 50 % 7. 50 % 8. 50 %
20 11 20 13 20 15 20 17 20 19 Keny a Real GDP Gro wth Ugan da Re al GD P Growth Tanzan ia Real GDP Growth Su b-saharian Rea l GD P Growth
Source: World Bank Data
Figure 25: Real GDP growth rate (Kenya Uganda and Tanzania)
Source: World Bank Data
30 % 35 % 40 % 45 %
20 10 A 20 12 A 20 14 A
Source: Company Data
Figure 26:EABL’s effective VAT.
EAST AFRICAN BREW ERIES LTD COMPANY REPORT
PAGE 10/32
Kenya ranks 108th (out of 189) worldwide and 9th (out of 47) in the Sub-Saharian
region in the 2015 Easiness of Doing Business Raking.
Country taxation levels are expected to keep decreasing due to governamental policies, down to values close to 33% for food and beverage industry in 201 69.
Uganda Macroeconomic Environment
After a Real GDP CAGR just slightly above Sub-Saharian average over the period 20102015, Uganda economy is expected to keep growing above the Sub -Saharian average with a forecasted CAGR for the period 2015-2020 of 6%. The economy is thus expected to increase the growing pace, after a relevant slowdown in 2012 and 2013, till achi eving growth values close to 7% in 2020. This recovery is mainly supported by strong public investments i n infrastructure, recovery in private domestic consumption and a rebound in local agriculture (this last sector generated most of last two years economic growth slowdown). Country overall purchasing power is expected to growth by 53% in five years. Even though the country is on track to achieve the Millennium Development goals, poverty and inequality still pose a relevant constraint for economic development (High rural/urban economical discrepancies), posing a relevant pressure on social conditions and constraining co nsumer product companies growth. Moreover, Uganda only ranks 122nd worldwide and 12th in the
Sub-Saharian region in the 2015 Easiness of Doing Business Raking , while local Political risk is considered Low to Moderate.
Tanzania Macroeconomic Environment
After a Real GDP CAGR of almost 7% over the period 2010-2015, Tanzania economy is still the one with the most positive growth outlook, with a forecasted CAGR for the period 2015-2020 close to 7%. Country overall purchasing power is expected to increase by 53% in five years. This growth is supported by a strong public investment in infrastructures (access infrastructures mainly), improving overall business conditions. Although Tanzania currently ranks 139th worldwide and 15th in the Sub-Saharian region in the 2015 Easiness of Doing Business Raking, the previously described investments are expected to make Tanzania climb up in the ranking. Tanzania Economy is also supported by the country healthy fiscal position and stable and peaceful environment (Political risk is considered Low to Moderate), thus showing a positive country outlook.
South Sudan Macroeconomic Environment
South Sudan embryonic economy poses several challenges for Business Development. The considerable dependence on oil exploration (represents more than half of country GDP), which is still not efficient when compared to local and
9 Deloitte Kenya Intenational Tax Report (2015) & KPMG Kenya fiscal Guide 2014/2015. 0
10 20 30 40
Sou th Sud an 20 15 20 17 20 20
Figure 31: Gross Domestic Product PPP in Current International Billion Dollars
0 50 10 0 15 0 20 0 25 0
Keny a Ugan da Tanzan ia 20 15 20 17 20 20 2%
7% 12 % 17 % 22 %
20 11 20 13 20 15 20 17 20 19 Keny a In flation Rate Ugan da Inflation Rate Tanzan ia Inflation Rate
-5 5.0 0% -3 5.0 0% -1 5.0 0% 5. 00 % 25 .0 0%
20 12 20 14 20 16 20 18 20 20
Sou th Sud an Real GDP Growth Su b-saharian Rea l GD P Growth
Figure 29: Gross Domestic Product PPP in Current International Billion Dollars
-2 % 8% 18 % 28 % 38 % 48 %
20 12 20 14 20 16 20 18 20 20
Source: World Bank Data
Figure 27: Inflation rate (Kenya Uganda and Tanzania)
Source: World Bank Data
Figure 28: GDP growth rate (South Sudan)
Figure 30: Inflation rate (South Sudan)
Source: World Bank Data
Source: World Bank Data
EAST AFRICAN BREW ERIES LTD COMPANY REPORT
PAGE 11/32
global competitors, together with the ongoing internal and external conflicts (considered to be one of the countries in Africa with higher political risks) pose a relevant burden for future economic growth. Low and volatile oil prices increase even more this uncertainty. South Sudan Economy ranks only 187th worldwide
and 46th in the Sub-Saharian region in the 2015 Easiness of Doing Business
Ranking. After a negative Real GDP CAGR of -12% in the period 2011-2015, the forecasted CAGR of 6.58% for the period 2015-2020 isn’t still enough for real
GDP to return to 2011 levels in 2020. Adding to this, the economy is only expected to start recovering in 2017 (forecasted growth to 2016 is of only .67%), highly dependent on the expectation of an increasing efficiency in oil exploration and on the resolution of some of current internal and external conflicts. In the other hand, country purchasing power is expected to increase by 51% in five years (Note that all this forecasts have a considerable uncertainty highly dependent on the previously described economic implicit volatility).
Microeconomic Environment
Although currently African continent represents a relatively small p art of worldwide alcoholic drinks industry, it is the region that is forecasted to growth at a higher pace over the following years (region sales value is forecasted to growth at a CAGR slightly above 5%, while sales volume is forecasted to growth at a CAGR slightly bellow 4%). This growth is mainly based on a tendency to keep historical growth levels in the beer segment (accounts for almost 80% of total market measured in volume) together with an accelerated growth in the Spirits category (currently accounts for approximately 10% of total market volume). The beer segment is expected to growth mainly in volume, as the affordability drive (targeting the low-income consumers in the Economic Beer segment with low-price products) together with a public and private level investment in logistical improvements are expected to allow companies to push up volume sales in detriment of short to medium term margins. Average beer prices, on the other hand, are expected to increase bellow region forecasted inflation.
Currently, Africa has the lowest per capita beer consumption in the world, presenting an opportunity to built on this low base factor to tap into expected high growth rates. Moreover, as popul ation size and purchasing power are expected to increase significantly in the short to medium term, this growth effect becomes even more relevant. Inside Africa, Sub-Saharian Africa has higher consumption rates than Saharian Africa. Kenya has average annual beer consumptions per capita between 10 to 25 liters, Uganda and Tanzania between 5 to 10 liters while South Sudan has a bottom consumption per capita (bellow 5 liters). Two of this markets (Uganda and
0% 20 % 40 % 60 % 80 % 10 0%
V
a
lu
e
S
h
a
r
e
Vo
lu
me
…
Asia Pacific West ern Europ e Lat in America No rth America Eastern Europe Africa
Australa sia Midd le Ea st (exc Egyp t)
Figure 33: Global Alcoholic Drinks Volume and Value Share by Region (2014)
Asia Pacific Latin America
North America Eastern Europe
Africa
2% 2% 3% 3% 4% 4% 5% 5% 6%
0% 1% 2% 3% 4%
V
a
lu
e
C
A
G
R
2
0
1
4
-2018
Volu me CAGR 2 0 1 4-2 0 1 8
Figure 34: Forecasted Alcoholic Drinks Value and Volume CAGR 2014-2018
Source: Euromonitor Data
Figure 32: African Countries by Political Stability Raking
Low Political Risk: Angola, Botswana,
Kenya, Mauritius, Mozambique,
Namibia, Rwanda, Seychelles
Low to Moderate Political Risk:
Ghana, Lesotho, Liberia, Malawi, Senegal, South africa, Tanzania, Tunisia, Uganda, Zambia
Moderate Political Risk: Benin, Congo, Egypt, Gabon, Madagascar, Marocco, Nigeria, Zimbabwe
Moderate to High Political Risk:
Algeria, Cameron, DRC, Ivory Coast, Swaziland
High Political Risk: Chad, Libya, South Sudan, Sudan
Source: NKC African Economics
Note: Area represents current market
size
EAST AFRICAN BREW ERIES LTD COMPANY REPORT
PAGE 12/32
Tanzania) were also some of the fastest growers over the last 7 years with volume CAGRs of 10.9% and 5.3% respectively. Kenyan market growth rates are expected to slowdown to 1% over the period 2014-2018 as a result of a recent market stabilization (annual volume sales growth decreased to 1% from 2010 to 2014) driven by a considerable market saturation, while Uganda and Tanzania beer markets are expected to keep growing at rates aligned with historical ones. African beer market is considerable concentrated around four main players, which together control more than 80% of the market. SABMiller and EABL control most of Kenya, Uganda, Tanzania and South Sudan beer markets (together this companies have a volume market share above 85% in this countries), which make it costly for outside competitors to penetrate this concentrated markets.
Lager Beer10 is the most consumed variety of beer in Africa (estimated to
represent more than 95% of Sub-Saharian market beer volume in 2014) and is expected to stay so (as it is at worldwide Level). In Kenya, close to 55% of total Lager volume sold in 2014 represented economy segment lager beer, while close to 42% of total Lager volume sold represented Mid-Priced lager beer. In Uganda and Tanzania close to 90% of total Lager Market represented Mid -Priced Beer while the rest represented mostly Premium Beer. Lager beers are also expected to keep driving the African Beer Market, as the already established loyal consumer base is expected to expand.
Based on the previously described market, companies are expected to target consumers in two fronts, increasing economic beer offer betting on a strong volume growth while slowly developing the premium segment offer in order to take advantage of the expected increase in country purchasing power.
Spirits in Africa are expected to growth at levels above all beer categories building mainly on two factors: the low base effect and the increase in purchasing power (forecasted African market volume growth for the period 2014 - 2018 of 10%) . This segment is forecasted to see stronger growth rates in countries with higher purchasing powers growth rates (Sub-Saharian countries mostly).
Internationally known imported spirits brands are expected to keep driving the spirits market, as their perceived quality is considerable above local private labels. Even though “customization” to local tastes and raw materials is expected
to increase over the following years, Kenya, Uganda and Tanzania spirits markets are not expected to be impacted by this trend as SABMiller and Diageo’s
strong spirits portfolios are expected to be locally distributed by its subsidiaries, thus allowing both companies to keep their current controlling position (currently both companies together control close to 80% of local spirits markets).
10 Lagering refers to the historical fermenting process. This way, beers are primarily fermented (as in any other beer variety) and then
start the Lagering phase in order to allow the beer to clear and mellow. Currently lagering does not have a direct impact on raw materials costs, but slightly increases production time by 40%, thus increasing average days sales in inventory.
38%
18% 15% 11%
18%
SABMiller P lc Hein eken NV C astel Grou pe Diageo Plc Oth ers
0% 50 % 10 0%
V
a
lu
e
S
h
a
re
V
o
lu
me
S
h
a
re
Beer Win e Sp irits
Figure 35: Alcoholic Drinks Category Share of Volume and Value Sales (2014)
0. 0 10 .0 20 .0 30 .0 40 .0 50 .0 60 .0 70 .0 80 .0
Figure 37: Annual Average Beer Consumption Per Capita (2014)
Figure 38: Per Capita Beer Concumption (2014)
Source: Euromonitor Data
Source: Euromonitor Data
Source: Euromonitor Data
Note: 1 -> Kenya; 2-> South Sudan; 3-> Uganda; 4-> Tanzania
Source: Euromonitor Data
EAST AFRICAN BREW ERIES LTD COMPANY REPORT
PAGE 13/32
Segmental Performance
EABL’s performance is highly dependent on local market characteristics, making
it necessary to individually analyze each market. As such, EABL’s future performance was individually forecasted regarding the main company operating geographical segments (Kenya, Uganda, Tanzania and South Sudan ) and product portfolio segments (beer and spirits products offering). In order to do so, the evolution for the three key value drivers for each region was individually forecasted, being them: Net Sales Value (quantities sold and at which price), Raw Materials and Consumables costs (unitary costs and respective evolution) and Distribution and Warehousing Costs (unitary costs and respective evolution).
EABL in Kenya
Kenyan market represented most of EABL’s operating value over the last years.
In 2015, it is expected to represent close to 60% of total EABL’s volume turnover and close to 70% of total EABL’s value turnover. Most of this turnover is expected to be created by the beer industry (88% of total EABL turnover in 2015).
Over the last 5 years, Kenyan Beer industry had been growing at relatively stable rates up to 2013 with annual volume growth rates slightly above zero. In 2014, Kenyan authorities decided to tax in 50% the historical tax exempt beer brand Senator Lager produced and marketed by
EABL which resulted in a 80% decrease in product volume sales, while decreasing overall market volume by almost 10%. This specific product was introduced in the Kenyan market in 2004 and its exclusive taxation statute was justified by Kenyan authorities as an incentive to keep it as a low priced alternative to illicit alcoholic beverages. This tax is expected to persist in the medium term, but as consumers are expected to move to other economy segment beer brands, the market is expected to recover to pre -2014 levels in 2015. EABL’s strategy is to be able to respond to this by phasing out Senator Lager brand while replacing it by alternative low priced brands such as Senator Dark Extra (introduced in December 2013 and currently priced 5% above
pre-taxation Senator Lager prices), thus supporting and taking advantage of the
expected market recovery. On the other hand, Keroche Breweries is not expected to change its product portfolio and respective pricing in Kenya as a result of this recent changes in taxation (Keroche focus its beer portfolio mainly on Mid-Priced, and Premium brands, which were not directly affected by this new taxation).
-1 5.0 0% -1 0.0 0% -5 .00 % 0. 00 % 5. 00 % 10 .0 0%
0 1 2 3 4 5
2
0
1
0
2
0
1
1
2
0
1
2
2
0
1
3
2
0
1
4
2
0
1
5
E
2
0
1
6
F
2
0
1
7
F
2
0
1
8
F
2
0
1
9
F
2
0
2
0
F
2
0
2
1
F
2
0
2
2
F
EABL Keroche Breweries Oth ers yoy %
Figure 39: Kenyan Market Volume Sales (in mhl)
Source: Canadean Data, Euromonitor
EAST AFRICAN BREW ERIES LTD COMPANY REPORT
PAGE 14/32
EABL has a strong controlling position in this market with historical market shares above 70%, while the second biggest competitor has never been able to achieve market shares above 5%. The outlook for EABL beer operations in Kenyan is thus positive, as the company is forecasted to sustain its controlling position over the next years.
EABL’s private label beer brand portfolio in Kenya is mainly driven by two low
priced beer brands: Tusker Lager (EABL’s flagship brand, with a market volume
share close to 35% in 2014) and Senator Lager (which is expected to be
replaced by alternative brands in the short-term). Both brands together represented close to 60% of total volume in Kenya over the last 4 years. Although a negative trend in this beer segment can be observed from 2012 to 2014 (as an effect of recent taxation changes), economy beer segment is expected to see its volume share increase till a stake close to 70% of EABL’s
portfolio in 2018. This movement is aligned with both the company desire to take advantage of the expected short-term low-priced beer market rebound and to take advantage of the local medium term market trend, increasing volume sales at levels close to the market growth pace. On the other hand, the company is expected to slightly increase premium segment beer o ffering, taking advantage of a growing market with relatively higher margins, while facing the competition of Keroche Breweries Ltd, whose beers are typically perceived as higher quality and higher priced.
EABL beer market prices to costumers had not change over the last five years (except for Senator Lager, which saw its market price increase by 50% in 2014
due to the new gazzeted excise tax). However, on the 1st December 2015, EABL
issued a note on the new recommended retail prices for products in Kenya, where the price of eight beer brands were slightly adjusted. This price adjustment was set in order to respond to the local taxation changes, lowering the price of one beer product (Senator Dark Extra) in order to better position it as a Economy Segment beer brand, while increasing the price of 4 mid priced beer brands and of 3 premium brands. All the three beer segments prices to consumers are thus expected increase on average by 7.5% during 2016 fiscal year, after which EABL is expected to keep its local policy of avoiding un necessary price increases in order to sustain volume sales growth
Regarding the Spirits segment, EABL volume sales are expected to keep growing at levels close to historical rates based on a low base factor together with a relevant increase in country purchasing power and a popularization spirits trend in Kenya. EABL is thus expected to keep its current leadership position , due to the higher perceived quality of its products, which are part of the strongest spirits brand umbrella at an worldwide level (Diageo’s leadership position in the spirits business) . EABL volume market share is thus forecasted to stay at 27.3%
0. 00 0. 10 0. 20 0. 30 0. 40 0. 50 0. 60 0. 70 0. 80 0. 90
2
0
1
3
2
0
1
4
2
0
1
5
E
2
0
1
6
F
2
0
1
7
F
2
0
1
8
F
2
0
1
9
F
2
0
2
0
F
2
0
2
1
F
2
0
2
2
F
E ABL SABMiller Oth ers 10 0 15 0 20 0 25 0 30 0 P remiu m
Mid-P riced Eco nom y
Figure 40: Beer Prices per liter by segment in 2015 (in Kshs)
Source: Company Data
0% 20 % 40 % 60 % 80 % 10 0%
Eco nom y Beer Mid-P riced Beer P remiu m Beer
Source: Euromonitor Data, Canadean
Data, Analyst’s Estimates
Figure 41: Beer volume sales by product segment (in mhl)
Figure 42: Spirits volume sales in Kenya (in mhl)
Source: Canadean Data; Analyst’s
EAST AFRICAN BREW ERIES LTD COMPANY REPORT
PAGE 15/32
(expected market share for 2015) while the second biggest player SABMiller is forecasted to keep Market Volume Shares close to 15% (current market shares).
EABL’s spirits business volume growth in Kenya is thus expected to be aligned
with market specific growth (forecasted CAGR for the period 2015-1022 of 10%). Spirits prices are expected to increase at rates bellow forecasted inflation over the following years, as the market prices of roughly half of the products are expected to increase at inflation levels while the rest is expected to stay constant. Regarding variable costs, Raw Materials and Consumables costs for Kenya are dependent on total alcoholic drinks produced and, as such, were forecasted based on total volume sales in Kenya. Based on current company size and historical cost evolution, no relevant scale economy effect is forecasted.
Moreover, due to EABL‘s reorganization strategy, and the correspondent
increasing efficiency in controlling costs, unitary Raw Materials and Consumables costs are expected to increase at levels bellow inflation, before exhausting total possible efficiency improvements in 2021, after which they are expected to increase at inflation levels. On the other hand, Distribution and Warehousing costs have been constant over the last years and are expected to stay so in the short term. For this second type of costs, becomes important to note that 100% of products sold in Kenya are produced in Kenya, thus lowering the respective Distribution and Warehousing Costs.
Product contribution margins11 are expected to increase in 2016 as a result of the
recent price adjustments. As in the medium term unitary costs are expected to increase at levels close to inflation ones while beer prices are expected to stay constant, contribution margins for beer products are expected to decrease. Spirits are expected to become the company most profitable product as forecasted price increases are expected to cover some of forecasted costs increases, allowing EABL to sustain Spirits contribution margins at levels close to 85% .
Table 1: Kenya forecasted Key Value Drivers
Kshs'000 000 2013 A 2014 A 2015 E 2016 F 2017 F 2018 F 2019 F 2020 F 2021 F 2022 F
Total Revenues 42,184 41,943 44,115 48,292 48,921 49,965 51,642 53,471 55,472 57,663
Economy Segment Beer 17,525 11,772 16,997 20,225 21,960 23,136 23,367 23,601 23,837 24,075
Mid-Priced Segment Beer 16,605 19,911 15,662 15,022 12,664 11,147 11,060 10,959 10,845 10,716
Premium Segment Beer 4,245 5,102 4,738 5,507 5,840 6,193 6,568 6,965 7,387 7,834
Spirits (UDV) 3,809 5,158 6,718 7,538 8,457 9,489 10,647 11,946 13,403 15,038
Raw Materials and Consumables Costs -8,323 -8,311 -8,477 -7,159 -7,607 -8,096 -8,641 -9,248 -9,916 -10,662 Distribution and Warehousing Costs -2,978 -2,790 -2,836 -2,926 -2,963 -3,002 -3,041 -3,082 -3,125 -3,169
Contribution Margin 30,883 30,242 32,802 38,207 38,351 38867 39959 41,141 42,431 43,832
EABL in Uganda
Uganda has historical been the second most relevant market for EABL. Even though it is expected to represent close to 30% of total EABL volume turnover in
11 Contribution Margin accounts for production variable costs only (Raw Materials and consumables Costs and Distribution and
Warehousing Costs)
0. 0 1. 0 2. 0 3. 0 4. 0 5. 0 6. 0 7. 0 8. 0 9. 0
2
0
1
3
A
2
0
1
4
A
2
0
1
5
E
2
0
1
6
F
2
0
1
7
F
2
0
1
8
F
2
0
1
9
F
2
0
2
0
F
2
0
2
1
F
2
0
2
2
F
Volume Sales Lo cal brewin g C apacity
Figure 43: EABL’s beer brewing
capacity and volume sales in Kenya (in mhl)
Source: Company Data, Analyst’s
Estimates
Source:Analyst’s Estimates
0 50 00 00 0 10 00 00 00
pe r M HL of Beer pe r M HL of Sp irits
Figure 44: EABL Raw Materials and Consumables costs (Kshs’ 000)
65 .0 % 70 .0 % 75 .0 % 80 .0 % 85 .0 % 90 .0 %
E co nom y Beer Segm ent Mid-P riced Beer Segmen t P remiu m Beer Segmen t Sp irits Premium Segmen t
Figure 45: EABL Contribution Margins in Kenya
Source:Analyst’s Estimates
Source:Analyst’s Estimates
Source: Company Data, Analyst’s
EAST AFRICAN BREW ERIES LTD COMPANY REPORT
PAGE 16/32
2015, it will represent less than 20% of total company value turnover in the same
year. Opposed to all other EABL’s geographical operations, close to 65% of total
value turnover in Uganda is expected to come from the Spirits segment, while only 35% of local turnover is expected to come from beer segment. This is mainly justified by EABL local strategy, which consists mostly in trying to growth in the spirits segment were its products are more competitive and the market stronger, than in the beer segment, were it faces the fierce competition of Nile Breweries. Uganda beer market has a relatively small size when compared to Kenyan beer market mainly due to a smaller beer consumption per capita. However, as opposed to Kenyan market, Uganda market has been quickly growing at a CAGR for the period 2008-2015 of 10.9%. Uganda population is expected to keep growing at an yearly rate close to 3%, while average beer consumption per capita is expected to converge to Kenyan level s, thus producing a positive growth outlook (forecasted volume CAGR for the period 2015 - 2022 close to 5%). The market is highly competitive, being historically dominated by two main companies: Uganda Breweries Ltd (subsidiary of EABL) and Nile Breweries Ltd (subsidiary of SABMiller). SABMiller stronger presence is mainly due to the higher perceived quality of its products in a market where Mid-Priced and Premium beer segments drive most of total market value.
EABL’s beer portfolio in Uganda consists mostly of Mid-Priced beer products
(close to 80% of volume sales) with a smaller contribution of Premium beers. Bell Lager is the leading brand for the Mid-Priced segment and is expected to stay so.
EABL’s beer prices are expected to increase at values close to one third of
inflation, as the company is expected to start stealing some margin from local distributors.
On the other hand, EABL’s spirits business in Uganda is strong and with a
positive outlook. The market is forecasted to growth at the double the pace of beer industry and EABL, the leading company in this segment, is expected to sustain its position with a forecasted volume sales CAGR close to 9% for the period 2015 - 2016 (volume sales are expected to double in 7 years when looking at the calendar year). As opposed to the beer segment, EABL currently faces no relevant competition in this geographical segment. Spirits prices are expected to behave accordingly to beer industry prices, thus increasing at values close to one third of annual inflation.
Regarding variable costs, Raw Materials and Consumables costs are expected to behave accordingly to EABL company trend. On the other hand, as a relevant share of EABL’s volume sales in Uganda is produced in Kenya and Tanzania and Figure 47: EABL’s Spirits Volume Sales
in Uganda
Figure 46: Total Beer Sold in Uganda (in mhl)
0. 0 1. 0 2. 0 3. 0 4. 0 5. 0 2 0 1 0 2 0 1 1 2 0 1 2 2 0 1 3 2 0 1 4 2 0 1 5 E 2 0 1 6 F 2 0 1 7 F 2 0 1 8 F 2 0 1 9 F 2 0 2 0 F 2 0 2 1 F 2 0 2 2 F
Ugan da Breweries Nile b reweries
Source: Canadean Data, Analyst’s
Estimates
Source: Canadean Data, Euromonitor
Data, Analyst’s Estimates
0. 00 0 0. 20 0 0. 40 0 0. 60 0 0. 80 0 1. 00 0 1. 20 0 1. 40 0 1. 60 0 1. 80 0
2 0 1 2 2 0 1 3 2 0 1 4 2 0 1 5 E 2 0 1 6 F 2 0 1 7 F 2 0 1 8 F 2 0 1 9 F 2 0 2 0 F 2 0 2 1 F 2 0 2 2 F
EAST AFRICAN BREW ERIES LTD COMPANY REPORT
PAGE 17/32
then imported to Uganda (due to the low local brewing capacity), Distribution and Warehousing costs per liter are expected to stay 50% above Kenyan costs. Average product margins in Uganda are considerable bellow all other geographical operations, which is mainly justified by two factors: importation of a relevant share of beer product which drive costs up and margins down and the weaker negotiation power over distributors, which moves most of the product margins from producers to distributors (this weaker negotiation power becomes even more relevant as close to 100% of Nile Breweries products are produced locally, thus increasinf company margins and creating a competitive advantage for them). If allocating overheads based on company revenues, Net profit for Uganda is forecasted to be negative (as it was in accounting terms for UBL during the last two fiscal years).
However, EABL is expected to keep operating in this segment due to two strong reasons. In the first place, contribution margins for Uganda are forecasted to be positive, which together with the company lack of ability to reduce company overheads if leaving this geographic segment, makes it a value creation operation to keep selling in Uganda. Secondly, as the company knows that leaving the market means high costs in order to return to it, by keeping company operations in Uganda operating slightly above value creation break even point, EABL is in fact buying an option to stay as one of the main spirits and beer producers in a market with a considerable potential upside.
Table 2: Uganda forecasted Key Value Drivers
Kshs'000 000 2013 A 2014 A 2015 E 2016 F 2017 F 2018 F 2019 F 2020 F 2021 F 2022 F
Total Revenues 9,771 11,086 11,530 12,626 13,790 15,093 16,547 18,182 19,978 21,901
Mid-Priced Segment Beer 2,573 2,919 2,577 2,708 2,879 3,066 3,264 3,475 3,693 3,920
Premium Segment Beer 389 441 1,013 1,064 1,131 1,205 1,282 1,365 1,451 1,540
Spirits (UDV) 6,809 7,726 7,940 8,854 9,780 10,822 12,001 13,343 14,835 16,440
Raw Materials and Consumables Costs -6,189 -6,532 -7,083 -7,897 -8,799 -9,860 -11,103 -12,554 -14,208 -16,074 Distribution and Warehousing Costs -2,248 -2,273 -2,474 -2,602 -2,748 -2,915 -3,101 -3,302 -3,515 -3,736
Contribution Margin 1,334 2,281 1,973 2,128 2,243 2,318 2,344 2,327 2,256 2,091
EABL in Tanzania
Tanzanian market represents the third most relevant operating market for EABL, being expected to represent close to 10% of 2015 volume and value sales. EABL operates in Tanzania mainly trough out its subsidiary SBL, where close to 65% of 2015 volume sales are expected to be generated from the beer business while the remaining 35% is expected to be generated from local spirits business.
Tanzania beer market has showed an historical CAGR above 5% for the period 2008-2015 and is expected to keep growing at a simil ar pace during the next 7 years. The market growth is mainly justified by a relevant
0. 00 0. 50 1. 00 1. 50 2. 00
Lo cal brewin g C apacity Volume Sales
Figure 48: Uganda Volume Sales and Production Capacity (EABL)
0 1 2 3 4 5 6
20 10 20 11 20 12 20 13 20 14 20 15 20 16 20 17 20 18 20 19 20 20 20 21 20 22 Serenget i Breweries Tanzan ia Breweries Oth ers
Figure 50: Total Beer Sold in Tanzania (in mhl)
Source: Company Data, Analyst’s
Estimates
Source:Canadean Data, Euromonitor Data, Analyst’s Estimates
0% 5% 10 % 15 % 20 % 25 %
Source:Analyst’s Estimates
Figure 49: Uganda Country Level Contribution Margin (EABL)