www.atmos-meas-tech.net/5/2403/2012/ doi:10.5194/amt-5-2403-2012
© Author(s) 2012. CC Attribution 3.0 License.
Measurement
Techniques
Quantitative bias estimates for tropospheric NO
2
columns retrieved
from SCIAMACHY, OMI, and GOME-2 using a common standard
for East Asia
H. Irie1, K. F. Boersma2,3, Y. Kanaya4, H. Takashima4,5, X. Pan4, and Z. F. Wang6
1Center for Environmental Remote Sensing, Chiba University, 1-33 Yayoicho, Inage-ku, Chiba 263-8522, Japan 2Royal Netherlands Meteorological Institute, Climate Observations Department, P.O. Box 201,
3730 AE De Bilt, The Netherlands
3Eindhoven University of Technology, Fluid Dynamics Lab, Eindhoven, The Netherlands
4Research Institute for Global Change, Japan Agency for Marine-Earth Science and Technology, 3173-25 Showa-machi,
Kanazawa-ku, Yokohama, Kanagawa 236-0001, Japan
5Department of Earth System Science, Faculty of Science, Fukuoka University, 8-19-1 Nanakuma,
Jounan-ku, Fukuoka 814-0180, Japan
6LAPC, Institute of Atmospheric Physics, Chinese Academy of Sciences, Beijing 100029, China
Correspondence to:H. Irie ([email protected])
Received: 17 May 2012 – Published in Atmos. Meas. Tech. Discuss.: 1 June 2012
Revised: 19 September 2012 – Accepted: 19 September 2012 – Published: 16 October 2012
Abstract.For the intercomparison of tropospheric nitrogen dioxide (NO2) vertical column density (VCD) data from
three different satellite sensors (SCIAMACHY, OMI, and GOME-2), we use a common standard to quantitatively eval-uate the biases for the respective data sets. As the stan-dard, a regression analysis using a single set of collocated ground-based Multi-Axis Differential Optical Absorption Spectroscopy (MAX-DOAS) observations at several sites in Japan and China from 2006–2011 is adopted. Examina-tions of various spatial coincidence criteria indicates that the slope of the regression line can be influenced by the spa-tial distribution of NO2over the area considered. While the
slope varies systematically with the distance between the MAX-DOAS and satellite observation points around Tokyo in Japan, such a systematic dependence is not clearly seen and correlation coefficients are generally higher in compar-isons at sites in China. On the basis of these results, we fo-cus mainly on comparisons over China and estimate the bi-ases in SCIAMACHY, OMI, and GOME-2 data (TM4NO2A and DOMINO version 2 products) against the MAX-DOAS observations to be−5±14 %,−10±14 %, and+1±14 %, respectively, which are all small and insignificant. We sug-gest that these small biases now allow for analyses combin-ing these satellite data for air quality studies, which are more systematic and quantitative than previously possible.
1 Introduction
Three satellite sensors, SCIAMACHY (SCanning Imaging Absorption SpectroMeter for Atmospheric CHartographY) (Bovensmann et al., 1999), OMI (Ozone Monitoring Instru-ment) (Levelt et al., 2006), and GOME-2 (Global Ozone Monitoring Experiment-2) (Callies et al., 2000), were all in orbit together until April 2012, observing tropospheric nitro-gen dioxide (NO2)pollution on a global scale and providing
long-term data records (since 2002) of vertical column den-sities (VCDs). Observations by these satellite sensors were performed at different local times, and the diurnal variation pattern seen in the NO2data has been reported for various
DOAS NO2VCD data over East Asia for each satellite data
set.
2 Satellite observations
The present study targets tropospheric NO2 VCD data
from SCIAMACHY, OMI, and GOME-2, all of which are equipped with a UV/visible sensor measuring sunlight back-scattered from the Earth’s atmosphere and reflected by the surface as well as the direct solar irradiance spectrum. SCIA-MACHY was launched onboard the ENVISAT satellite in March 2002. It passes over the equator at about 10:00 LT and achieves global coverage observations in six days, with a spatial resolution of 60×30 km2. OMI was launched aboard the Aura satellite in July 2004. The equator crossing time is about 13:40–13:50 LT. Daily global measurements are achieved by a wide field of view (FOV) of 114◦, in which 60 discrete viewing angles (at a nominal nadir spatial resolution of 13×24 km2)are distributed perpendicular to the flight di-rection. The GOME-2 instrument, launched aboard a MetOp satellite in June 2006, has a ground-pixel size of 80×40 km2 (240×40 km2 for the back scan) over most of the globe. With its wide swath, near-global coverage (with an equa-tor crossing time around 09:30 LT) is achieved every day. While observation specifications are thus somewhat different between the three sensors, tropospheric NO2VCD data
re-trieved with the same basic algorithm (DOMINO products for OMI and TM4NO2A products for SCIAMACHY and GOME-2) (Boersma et al., 2004, 2007, 2011) are compared in detail with MAX-DOAS data below. The error in the satel-lite tropospheric NO2VCD data includes uncertainties in the
slant column, the stratospheric column, and the tropospheric air mass factor (AMF) (Boersma et al., 2004), and can be expressed as∼1×10¹⁵molecules cm−2+ 30 % for polluted
situations. Comparisons are made for the version 2 retrievals under cloud-free conditions, i.e. cloud fraction (CF) less than 20 %.
3 MAX-DOAS observations
Here we briefly describe ground-based MAX-DOAS mea-surements – scattered sunlight observations in the UV/visible at several elevation angles between the horizon and zenith
(e.g., H¨onninger and Platt, 2002; H¨onninger et al., 2004) – performed at three sites in Japan and three sites in China (Ta-ble 1 and Fig. 1). As can be seen in Fig. 1, the MAX-DOAS measurements were conducted at various levels of NO2
pollution, covering urban (Yokosuka), suburban (Tsukuba) around Tokyo, and remote areas (Hedo) in Japan and the northernmost (Mangshan), middle (Tai’an), and southern-most (Rudong) parts of the highly polluted area in China. This set of observations extends the data set used by Irie et al. (2009) for the validation of the NASA OMI NO2standard
product. The present study additionally uses data for 2009– 2011 and data from the Mangshan and Rudong sites. The observations at Tai’an, Mangshan, and Rudong were made as part of intensive observation campaigns for a limited time pe-riod of about 1 month for each site (Table 1). The instrumen-tation and retrieval algorithm used for all the sites have been described in detail elsewhere (e.g., Irie et al., 2008, 2009, 2011; Takashima et al., 2011, 2012). The retrieval utilizes ab-sorption features by NO2and the oxygen dimer (O4)at 460–
490 nm. The NO2absorption cross section data of Vandaele
et al. (1998) at 294 K were used. The quality of our DOAS analysis is supported by formal semi-blind intercomparison results indicating good agreement with other MAX-DOAS observations to within∼10 % of other instruments for both NO2and O4differential slant column densities (1SCD) and
for both the UV and visible regions (Roscoe et al., 2010). The O41SCD values derived from the DOAS analysis are
converted using our aerosol retrieval algorithm (e.g., Irie et al., 2008) to aerosol optical depth and the vertical profile of the aerosol extinction coefficient. At the same time, the so-called box AMF is uniquely determined, as it is a function of the aerosol profile. Using this AMF information and a non-linear iterative inversion method, the NO21SCD values are
converted to the tropospheric VCD and the vertical profile of NO2. Error analysis for the retrieved NO2 VCDs has been
done based on the method described by Irie et al. (2011). For an NO2 VCD of about 100×1014molecules cm−2, typical
Fig. 1.Locations of MAX-DOAS observations on a monthly mean map (0.5◦ grid) of GOME-2 tropospheric NO2 VCD data in
May 2010.
7×10¹⁴molecules cm−2(7 %). For the present study,
addi-tional sensitivity analysis is performed using a different fit-ting window for NO2(425–450 nm) and different NO2cross
section data (at 220 K). The errors were estimated by a man-ner similar to Takashima et al. (2012) to be about−3 % (the VCD retrieved from 425–450 nm is smaller) and−23 % (the VCD retrieved using the cross section at 220 K is smaller). Scaling the latter estimate to the actual temperature variation below 2 km (possibly cooled down to∼260 K at an altitude of 2 km) yields −11 %. This value could be smaller, since NO2should be abundant near the surface, where the
temper-ature is usually warmer than 260 K and occasionally can ex-ceed 294 K. However, we quantified the overall uncertainty to be 14 % as the root-mean squares of all the above esti-mated errors. The representative horizontal distance for air masses observed by MAX-DOAS was estimated to be about 10 km (Irie et al., 2011), a magnitude comparable to or better than the satellite observations. The temporal resolution was 30 min, which corresponds to a complete sequence of eleva-tion angles. In the present study, a comparison is made only when the time difference between MAX-DOAS and satellite observations was less than 30 min.
4 Results and discussion
Here we compare MAX-DOAS observations performed in Japan and China from 2006–2011 with all three types of satellite products in a consistent manner. In Fig. 2, compar-isons between MAX-DOAS and OMI tropospheric NO2
col-umn data are made only if the center of the OMI pixel is within 0.20◦ latitude and longitude of a MAX-DOAS ob-servation point. This coincidence criterion is hereinafter de-notedx. The coincidence criterionx of 0.20◦is first tested here, while the comparison results could be affected by the choice of x according to the spatial distribution of NO2
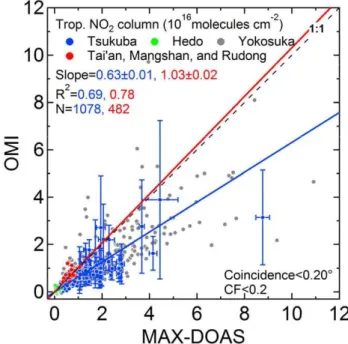
Fig. 2. Correlations between tropospheric NO2 VCDs
(1016molecules cm−2) from OMI and MAX-DOAS observa-tions at a coincidence criterion (x)of 0.20◦. Comparisons over Tsukuba, Hedo, and Yokosuka are shown in blue, green, and gray, respectively, and campaign-based short-term observations in China are shown in red. Error bars for both OMI and MAX-DOAS data are shown only for comparisons over Tsukuba at MAX-DOAS NO2VCDs larger than 1×10¹⁶molecules cm−2, for clarity. Linear
regression analysis has been performed for the respective cases 1 (Tokyo case; blue) and 2 (Chinese case; red), where the slopes of their regression lines are constrained mainly by comparisons made around Tokyo (Tsukuba and Yokosuka) and at China sites (Tai’an, Mangshan, Rudong), respectively. Hedo data are used in both regression analyses but do not constrain the slope much, since the comparisons at other sites are made over a wide range of NO2
VCD values. For each case, the slope, correlation coefficient (R2), and number of data points (N )are given in the plot.
around observation sites, as discussed later. Two regres-sion lines are shown in Fig. 2. The one shown in blue has been drawn from comparisons for Tsukuba, Yokosuka, and Hedo. The regression line shown in red was obtained from comparisons for three Chinese sites (Tai’an, Mangshan, and Rudong) and Hedo. The respective cases are called here-after the Tokyo case and the China case. For the Tokyo case the slope is controlled mainly by data from Tsukuba and Yokosuka (both located around Tokyo), as their data are dis-tributed over a wide range of NO2 values compared to the
Hedo data. Similarly, for the China case the slopes are con-trolled by data from the three Chinese sites. For compar-isons over Hedo (shown in green), which is located in a re-mote area, both satellite and MAX-DOAS data consistently show very small NO2 VCD values, compared to the other
1
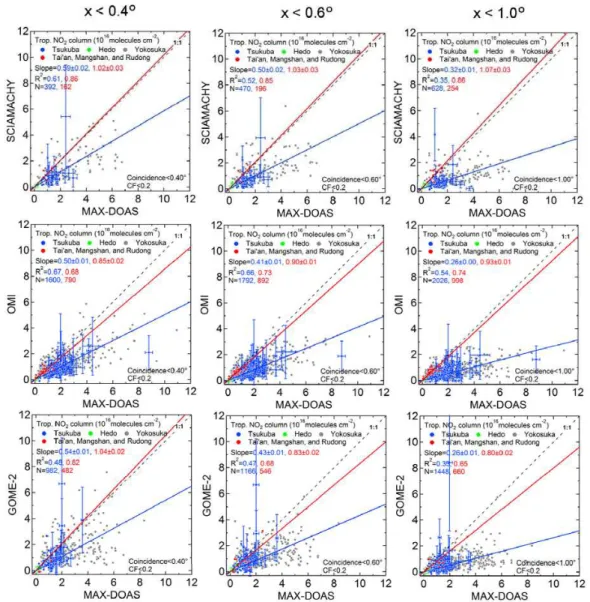
Fig. 3.Same as Fig. 2 but the first, second, and third rows are for SCIAMACHY, OMI, and GOME-2, respectively. For each satellite sensor, three plots using different coincidence criteria (x)of 0.40◦, 0.60◦, and 1.00◦, with MAX-DOAS are given.
analysis has been made with the intercept forced to be zero, in order to simplify the interpretation of changes in the bias estimated from the slope of the regression line under var-ious conditions. When the intercept is set as a variable, it is calculated to be 1.4×10¹⁵molecules cm−2. This is small compared to the range of NO2 VCD data plotted in Fig. 2
but is larger than the error quoted for the satellite retrieval (∼1.0×10¹⁵molecules cm−2+ 30 %). Furthermore, for ex-ample, comparisons between MAX-DOAS and GOME-2 un-der the same conditions as in Fig. 2 reveal that the inter-cept is as large as 3.0×10¹⁵molecules cm−2and is incon-sistent with that estimated from the comparisons with OMI. We found that the intercept and therefore the slope tend to be influenced, at least when the number of comparisons is too small. This could complicate the interpretation of the change in slopes over different sensors and various coincidence cri-teria.
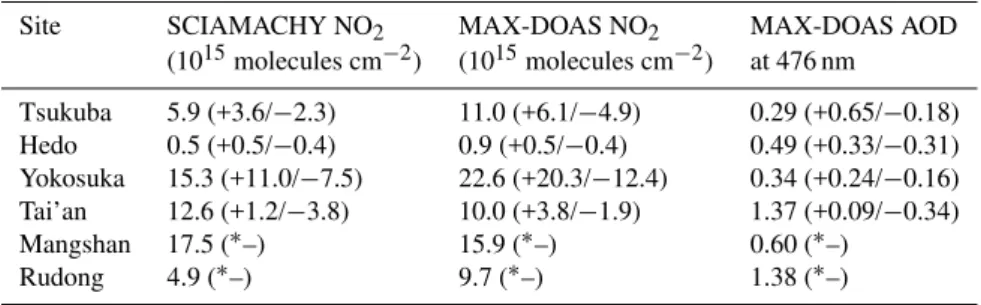
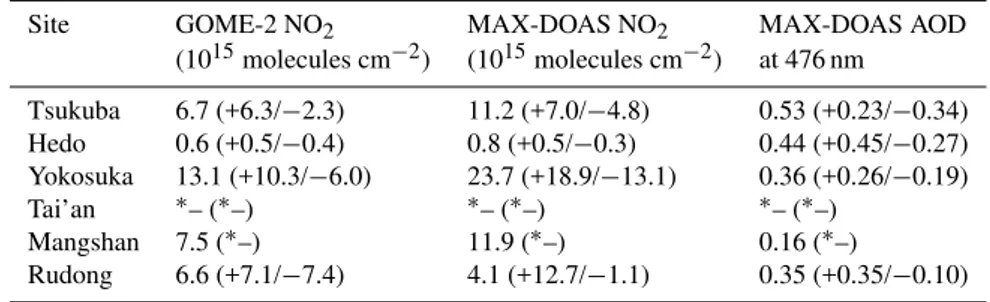
Table 2.Median values of tropospheric NO2columns and AOD for data used in the SCIAMACHY/MAXDOAS correlation analysis with
x=0.50◦. Values in parentheses represent the 67 % range.
Site SCIAMACHY NO2 MAX-DOAS NO2 MAX-DOAS AOD (1015molecules cm−2) (1015molecules cm−2) at 476 nm
Tsukuba 5.9 (+3.6/−2.3) 11.0 (+6.1/−4.9) 0.29 (+0.65/−0.18) Hedo 0.5 (+0.5/−0.4) 0.9 (+0.5/−0.4) 0.49 (+0.33/−0.31) Yokosuka 15.3 (+11.0/−7.5) 22.6 (+20.3/−12.4) 0.34 (+0.24/−0.16) Tai’an 12.6 (+1.2/−3.8) 10.0 (+3.8/−1.9) 1.37 (+0.09/−0.34) Mangshan 17.5 (∗–) 15.9 (∗–) 0.60 (∗–)
Rudong 4.9 (∗–) 9.7 (∗–) 1.38 (∗–)
∗Insufficient number of data points.
Table 3.Same as Table 2 but for comparisons with OMI.
Site OMI NO2 MAX-DOAS NO2 MAX-DOAS AOD (1015molecules cm−2) (1015molecules cm−2) at 476 nm
Tsukuba 5.5 (+4.9/−2.6) 9.9 (+9.9/−5.3) 0.38 (+0.24/−0.20) Hedo 0.7 (+0.5/−0.5) 0.7 (+0.5/−0.3) 0.49 (+0.40/−0.31) Yokosuka 10.5 (+8.0/−4.9) 19.1 (+18.7/−12.1) 0.35 (+0.23/−0.17) Tai’an 6.7 (+1.4/−1.8) 6.5 (+1.3/−0.8) 1.06 (+0.10/−0.48) Mangshan 9.1 (+0.6/−0.6) 13.8 (+0.0/−0.0) 0.18 (+0.03/−0.03) Rudong 2.2 (+1.5/−1.1) 0.8 (+1.4/−0.1) 0.53 (+0.17/−0.18)
Fig. 4. (a)Slopes and(b)R2of the regression lines as a function of coincidence criterionxbetween satellite and MAX-DOAS observa-tions for case 1 (Tokyo case)
Tai’an is the site that most contributes to the China case re-sults for comparisons with OMI. For reference to the situa-tions around the measurement sites, median values of tropo-spheric NO2columns and AOD for data used in the satellite
vs. MAX-DOAS correlation analysis are summarized in Ta-bles 2, 3, and 4. Anx of 0.50◦is used instead of 0.20◦ to improve the statistics.
To investigate the cause of the difference between the slopes of the China and Tokyo cases, we make comparisons
Fig. 5.Same as Fig. 4 but for case 2 (China case).
with various coincidence criteria. We test 15 different coin-cidence criteria:x=0.05◦, 0.10◦, 0.15◦, 0.20◦, 0.25◦, 0.30◦, 0.35◦, 0.40◦, 0.45◦, 0.50◦, 0.60◦, 0.70◦, 0.80◦, 0.90◦, and 1.00◦. The results forx=0.40◦, 0.60◦, and 1.00◦are high-lighted in Fig. 3. Variations of the slope andR2 overx are summarized in Figs. 4 and 5 for the Tokyo and China cases, respectively.
σ
Fig. 6.Dependence of satellite-retrieved tropospheric NO2VCDs on the coincidence criterionxover each measurement site. Differences
from VCDs atx=0.50◦are shown in per cent. Mean values for data compared with MAX-DOAS are plotted. Error bars represent 1σ
standard deviations.
NO2VCD values in the surrounding areas of Yokosuka and
Tsukuba sites usually drop quickly, owing to limited NOx source regions. For a largerx, there should be a higher prob-ability that the satellite footprints include clean air masses, and this can lower both the slope andR2. These expected features of the spatial distribution are confirmed by satellite data only (Fig. 6). In Fig. 6, the satellite tropospheric NO2
VCD values selected for regression analysis are plotted as a function of a given coincidence criterionxfor each measure-ment site. Only data compared with MAX-DOAS are used. The NO2VCD values are differentiated from the NO2VCD
atx=0.50◦. While values other than 0.50 can be used to check the dependence of NO2 VCD onx, we choose the
value of 0.50, which provides robust statistics as the standard for all sensors at a relatively smallx.
The Yokosuka site is surrounded by industrial facilities, ocean (Tokyo Bay), heavy ship activity, etc., resulting in a large range of tropospheric NO2VCDs but more scatter in
the correlation, compared to the Tsukuba data (Figs. 2 and 3). To better address such influences of spatial inhomogene-ity within a satellite pixel, validation observations covering several points in a satellite pixel at the same time would be desirable (e.g., Piters et al., 2012).
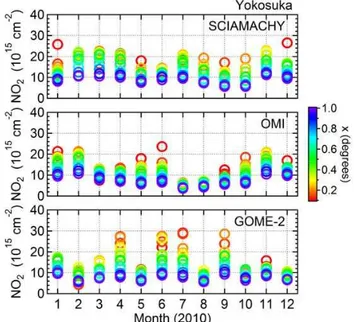
In Fig. 7, monthly-mean values of tropospheric NO2
H. Irie et al.: Quantitative bias estimates for tropospheric NO2columns 2409
Table 5.Estimated Biases in Satellite Tropospheric NO2Products
for Different Coincidence Criterion Thresholds.
Sensor x≤0.5◦ x≤1.0◦ SCIAMACHY −5±14 % 0±14 % OMI −10±14 % −8±14 % GOME-2 +1±14 % −10±14 %
averaging; for x=0.2◦, for example, an average for NO2
VCDs within 0.2◦ latitude and longitude of Yokosuka is shown. As the degree of the spatial inhomogeneity varied with time significantly, it was difficult to uniquely determine the best single choice ofx as a typical spatial scale for the bias estimate.
Results of the estimated slopes andR2for the China case are shown in Fig. 5. Results with an insufficient number of comparisons (less than 3) at Chinese sites have been omitted. It can be seen that the slopes slowly vary withx, but the vari-ations are not as systematic as those of the Tokyo case.R2
values are greater than 0.6 for all comparisons and usually higher than those for the Tokyo case (Figs. 4 and 5). Further-more, dependencies of satellite-retrieved tropospheric NO2
VCDs onx are not as systematic as those seen at sites of the Tokyo case (Fig. 6). These suggest that the spatial distri-butions of tropospheric NO2VCDs around the Chinese sites
during the observation periods were rather homogeneous and therefore appropriate for bias estimates.
For the China case, by simply averaging the slopes over the entirex range, the biases with respect to MAX-DOAS observations are estimated to be 0±14 %,−8±14 %, and −10±14 % for SCIAMACHY, OMI, and GOME-2, respec-tively (Table 5). The error is calculated as the root-sum-squares of the uncertainty of the slope and the uncertainty of the MAX-DOAS NO2 retrieval. It is expected, however,
that the validation comparison can be more precise using a stricter coincidence criterion owing to the increased proba-bility of observing the same air masses by a satellite sen-sor and MAX-DOAS. Considering this, our best estimates of the biases from slopes at a strictx range below 0.50◦are −5±14 %,−10±14 %, and+1±14 % for SCIAMACHY, OMI, and GOME-2, respectively (Table 5). Thus, we con-clude that the biases are less than about 10 % and insignifi-cant for all three data sets.
Note that considering the error quoted for satellite re-trievals (∼1×10¹⁵molecules cm−2+ 30 %), the estimate
bi-ases may be invalid, at least, for NO2VCD values smaller
than∼1×10¹⁵molecules cm−2. Also, the estimated biases could vary by changing the x range, but we note that the slopes are all less than 20 %, irrespective of the choice of
x (Fig. 5). In the above bias estimates, the slopes for the Tokyo cases are not included, as the slopes vary significantly with x. However, very similar slopes are obtained for all comparisons with SCIAMACHY, OMI, and GOME-2 in the
Fig. 7.Dependence of satellite-retrieved tropospheric NO2VCDs
on the spatial grid size used for averaging (corresponding to the coincidence criterionx)around Yokosuka for each month in 2010. All available cloud-free satellite data are used.
Tokyo case (Fig. 4), supporting the conclusion that differ-ences among biases for all sensors are small, as found from the China case. Thus, our study confirms the hypothesized consistent quality KNMI products retrieved with the new method of Boersma et al. (2011).
Finally, there is the possibility that the biases between satellite and MAX-DOAS data are not necessarily constant over location and time. To address this issue, the precise val-idation for MAX-DOAS retrievals and/or more systematic MAX-DOAS observations would be essential.
5 Conclusions
To quantify the biases in the tropospheric NO2 VCD data
from SCIAMACHY, OMI, and GOME-2 in a consistent manner, we created a single data set from MAX-DOAS observations performed at three sites in Japan and three sites in China from 2006–2011. Regression analysis be-tween satellite and MAX-DOAS tropospheric NO2 VCDs
Acknowledgements. We thank PREDE, Co., Ltd for their technical assistance in developing the MAX-DOAS instruments. Observa-tions at Tsukuba were supported by M. Nakazato and T. Nagai. This work was supported by the Global Environment Research Fund (S-7) of the Ministry of the Environment, Japan, and by the Netherlands Organisation for Scientific Research, NWO Vidi grant 864.09.001.
Edited by: H. Worden
References
Boersma, K. F., Eskes, H. J., and Brinksma, E. J.: Error Analysis for tropospheric NO2retrieval from space, J. Geophys. Res. 109,
D04311, doi:10.1029/2003JD003962, 2004.
Boersma, K. F., Eskes, H. J., Veefkind, J. P., Brinksma, E. J., van der A, R. J., Sneep, M., van den Oord, G. H. J., Levelt, P. F., Stammes, P., Gleason, J. F., and Bucsela, E. J.: Near-real time retrieval of tropospheric NO2from OMI, Atmos. Chem. Phys.,
7, 2103–2118, doi:10.5194/acp-7-2103-2007, 2007.
Boersma, K. F., Jacob, D. J., Eskes, H. J., Pinder, R. W., Wang, J., and van der A, R. J.: Intercomparison of SCIAMACHY and OMI tropospheric NO2columns: Observing the diurnal
evolu-tion of chemistry and emissions from space, J. Geophys. Res., 113, D16S26, doi:10.1029/2007JD008816, 2008.
Boersma, K. F., Jacob, D. J., Trainic, M., Rudich, Y., DeSmedt, I., Dirksen, R., and Eskes, H. J.: Validation of urban NO2
concen-trations and their diurnal and seasonal variations observed from the SCIAMACHY and OMI sensors using in situ surface mea-surements in Israeli cities, Atmos. Chem. Phys., 9, 3867–3879, doi:10.5194/acp-9-3867-2009, 2009.
Boersma, K. F., Eskes, H. J., Dirksen, R. J., van der A, R. J., Veefkind, J. P., Stammes, P., Huijnen, V., Kleipool, Q. L., Sneep, M., Claas, J., Leit˜ao, J., Richter, A., Zhou, Y., and Brunner, D.: An improved tropospheric NO2column retrieval algorithm for
the Ozone Monitoring Instrument, Atmos. Meas. Tech., 4, 1905– 1928, doi:10.5194/amt-4-1905-2011, 2011.
Bovensmann, H., Burrows, J. P., Buchwitz, M., Frerick, J., Noel, S., Rozanov, V. V., Chance, K. V., and Goede, A. H. P.: SCIA-MACHY – Mission objectives and measurement modes, J. At-mos. Sci., 56, 127–150, 1999.
surements, Atmos. Chem. Phys., 8, 341–350, doi:10.5194/acp-8-341-2008, 2008.
Irie, H., Kanaya, Y., Takashima, H., Gleason, J. F., and Wang, Z.: Characterization of OMI tropospheric NO2measurements in
East Asia based on a robust validation comparison, SOLA, 5, 117–120, doi:10.2151/sola.2009-030, 2009.
Irie, H., Takashima, H., Kanaya, Y., Boersma, K. F., Gast, L., Wit-trock, F., Brunner, D., Zhou, Y., and Van Roozendael, M.: Eight-component retrievals from ground-based MAX-DOAS observa-tions, Atmos. Meas. Tech., 4, 1027–1044, doi:10.5194/amt-4-1027-2011, 2011.
Levelt, P. F., van den Oord, G. H. J., Dobber, M. R., Malkki, A., Visser, H., de Vries, J., Stammes, P., Lundell, J., and Saari, H.: The Ozone Monitoring Instrument, IEEE T. Geosci. Remote. Sens., 44, 1093–1101, doi:10.1109/TGRS.2006.872333, 2006. Lin, J.-T., McElroy, M. B., and Boersma, K. F.: Constraint of
anthropogenic NOx emissions in China from different sectors:
a new methodology using multiple satellite retrievals, Atmos. Chem. Phys., 10, 63–78, doi:10.5194/acp-10-63-2010, 2010. Piters, A. J. M., Boersma, K. F., Kroon, M., Hains, J. C.,
Van Roozendael, M., Wittrock, F., Abuhassan, N., Adams, C., Akrami, M., Allaart, M. A. F., Apituley, A., Beirle, S., Bergw-erff, J. B., Berkhout, A. J. C., Brunner, D., Cede, A., Chong, J., Cl´emer, K., Fayt, C., Frieß, U., Gast, L. F. L., Gil-Ojeda, M., Goutail, F., Graves, R., Griesfeller, A., Großmann, K., Hemer-ijckx, G., Hendrick, F., Henzing, B., Herman, J., Hermans, C., Hoexum, M., van der Hoff, G. R., Irie, H., Johnston, P. V., Kanaya, Y., Kim, Y. J., Klein Baltink, H., Kreher, K., de Leeuw, G., Leigh, R., Merlaud, A., Moerman, M. M., Monks, P. S., Mount, G. H., Navarro-Comas, M., Oetjen, H., Pazmino, A., Perez-Camacho, M., Peters, E., du Piesanie, A., Pinardi, G., Puentedura, O., Richter, A., Roscoe, H. K., Sch¨onhardt, A., Schwarzenbach, B., Shaiganfar, R., Sluis, W., Spinei, E., Stolk, A. P., Strong, K., Swart, D. P. J., Takashima, H., Vlemmix, T., Vrekoussis, M., Wagner, T., Whyte, C., Wilson, K. M., Yela, M., Yilmaz, S., Zieger, P., and Zhou, Y.: The Cabauw Intercom-parison campaign for Nitrogen Dioxide measuring Instruments (CINDI): design, execution, and early results, Atmos. Meas. Tech., 5, 457–485, doi:10.5194/amt-5-457-2012, 2012. Roscoe, H. K., Van Roozendael, M., Fayt, C., du Piesanie, A.,
Spinei, E., Strong, K., Takashima, H., Vlemmix, T., Vrekoussis, M., Wagner, T., Wittrock, F., Yela, M., Yilmaz, S., Boersma, F., Hains, J., Kroon, M., Piters, A., and Kim, Y. J.: Intercomparison of slant column measurements of NO2and O4by MAX-DOAS
and zenith-sky UV and visible spectrometers, Atmos. Meas. Tech., 3, 1629–1646, doi:10.5194/amt-3-1629-2010, 2010. Takashima, H., Irie, H., Kanaya, Y., and Akimoto, H.: Enhanced
NO2at Okinawa Island, Japan caused by rapid air-mass transport from China as observed by MAX-DOAS, Atmos. Environ., 45, 2593–2597, 2011.
Takashima, H., Irie, H., Kanaya, Y., and Syamsudin, F.: NO2 ob-servations over the western Pacific and Indian Ocean by MAX-DOAS on Kaiyo, a Japanese research vessel, Atmos. Meas. Tech., 5, 2351–2360, doi:10.5194/amt-5-2351-2012, 2012. Vandaele, A. C., Hermans, C., Simon, P. C., Carleer, M., Colin,
R., Fally, S., M´erienne, M. F., Jenouvrier, A., and Coquart, B.: Measurements of the NO2 absorption cross-section from