AMTD
5, 3953–3971, 2012First quantitative bias estimates for tropospheric NO2
columns
H. Irie et al.
Title Page
Abstract Introduction
Conclusions References
Tables Figures
◭ ◮
◭ ◮
Back Close
Full Screen / Esc
Printer-friendly Version Interactive Discussion
Discussion
P
a
per
|
Dis
cussion
P
a
per
|
Discussion
P
a
per
|
Discussio
n
P
a
per
|
Atmos. Meas. Tech. Discuss., 5, 3953–3971, 2012 www.atmos-meas-tech-discuss.net/5/3953/2012/ doi:10.5194/amtd-5-3953-2012
© Author(s) 2012. CC Attribution 3.0 License.
Atmospheric Measurement Techniques Discussions
This discussion paper is/has been under review for the journal Atmospheric Measurement Techniques (AMT). Please refer to the corresponding final paper in AMT if available.
First quantitative bias estimates for
tropospheric NO
2
columns retrieved from
SCIAMACHY, OMI, and GOME-2 using a
common standard
H. Irie1, K. F. Boersma2,3, Y. Kanaya4, H. Takashima4,5, X. Pan4, and Z. F. Wang6
1
Center for Environmental Remote Sensing, Chiba University, 1-33 Yayoicho, Inage-ku, Chiba 263-8522, Japan
2
Royal Netherlands Meteorological Institute, Climate Observations Department, P.O. Box 201, 3730 AE De Bilt, The Netherlands
3
Eindhoven University of Technology, Fluid Dynamics Lab, Eindhoven, The Netherlands 4
Research Institute for Global Change, Japan Agency for Marine-Earth Science and Technology, 3173-25 Showa-machi, Kanazawa-ku, Yokohama, Kanagawa 236-0001, Japan 5
Department of Earth System Science, Faculty of Science, Fukuoka University, 8-19-1 Nanakuma, Jounan-ku, Fukuoka 814-0180, Japan
6
AMTD
5, 3953–3971, 2012First quantitative bias estimates for tropospheric NO2
columns
H. Irie et al.
Title Page
Abstract Introduction
Conclusions References
Tables Figures
◭ ◮
◭ ◮
Back Close
Full Screen / Esc
Printer-friendly Version Interactive Discussion
Discussion
P
a
per
|
Dis
cussion
P
a
per
|
Discussion
P
a
per
|
Discussio
n
P
a
per
|
Received: 17 May 2012 – Accepted: 22 May 2012 – Published: 1 June 2012 Correspondence to: H. Irie ([email protected])
AMTD
5, 3953–3971, 2012First quantitative bias estimates for tropospheric NO2
columns
H. Irie et al.
Title Page
Abstract Introduction
Conclusions References
Tables Figures
◭ ◮
◭ ◮
Back Close
Full Screen / Esc
Printer-friendly Version Interactive Discussion
Discussion
P
a
per
|
Dis
cussion
P
a
per
|
Discussion
P
a
per
|
Discussio
n
P
a
per
|
Abstract
For the intercomparison of tropospheric nitrogen dioxide (NO2) vertical column density (VCD) data from three different satellite sensors (SCIAMACHY, OMI, and GOME-2), we use a common standard to quantitatively evaluate the biases for the respective data sets. As the standard, a regression analysis using a single set of collocated ground-5
based Multi-Axis Differential Optical Absorption Spectroscopy (MAX-DOAS) observa-tions at several sites in Japan and China in 2006–2011 is adopted. Examination of various spatial coincidence criteria indicates that the slope of the regression line can be influenced by the spatial distribution of NO2 over the area considered. While the slope varies systematically with the distance between the MAX-DOAS and satellite ob-10
servation points around Tokyo in Japan, such a systematic dependence is not clearly seen and correlation coefficients are generally higher in comparisons at sites in China. On the basis of these results, we focus mainly on comparisons over China and best es-timate the biases in SCIAMACHY, OMI, and GOME-2 data (TM4NO2A and DOMINO version 2 products) against the MAX-DOAS observations to be−5±14 %,−10±14 %, 15
and+1±14 %, respectively, which are all small and insignificant. We suggest that these
small biases now allow analyses combining these satellite data for air quality studies that are more systematic and quantitative than previously possible.
1 Introduction
Three satellite sensors, SCIAMACHY (SCanning Imaging Absorption SpectroMeter for 20
Atmospheric CHartographY) (Bovensmann et al., 1999), OMI (Ozone Monitoring In-strument) (Levelt et al., 2006), and GOME-2 (Global Ozone Monitoring Experiment-2) (Callies et al., 2000), were all in orbit together until April 2012, observing tropospheric nitrogen dioxide (NO2) pollution on global scale and providing long-term data records (since 2002) of vertical column densities (VCDs). Observations by these satellite sen-25
AMTD
5, 3953–3971, 2012First quantitative bias estimates for tropospheric NO2
columns
H. Irie et al.
Title Page
Abstract Introduction
Conclusions References
Tables Figures
◭ ◮
◭ ◮
Back Close
Full Screen / Esc
Printer-friendly Version Interactive Discussion
Discussion
P
a
per
|
Dis
cussion
P
a
per
|
Discussion
P
a
per
|
Discussio
n
P
a
per
|
in the NO2 data has been reported for various locations over the world (Boersma et al., 2008). However, the diurnal cycle observed by SCIAMACHY and OMI has been val-idated only over the Middle East, a region with highly active photochemistry (Boersma et al., 2009). The observations of the diurnal variation are expected to provide addi-tional constraints to improve models, beyond a single VCD data set at a specific local 5
time (e.g., Lin et al., 2010). The combined use of SCIAMACHY, OMI, and GOME-2 data is desirable to improve our understanding of short-term variations in chemistry, emis-sions and transport of pollution. There have been, however, few studies attempting to quantify the biases in SCIAMACHY, OMI, and GOME-2 data in a consistent manner based on comparisons with independent observations. In East Asia, even validation 10
comparisons for a specific satellite data set are very limited, except for the NASA OMI standard product (Irie et al., 2009). Here we present such a consistent data set based on Multi-Axis Differential Optical Absorption Spectroscopy (MAX-DOAS) observations performed at several sites in Japan and China in 2006–2011. Because MAX-DOAS provides continuous measurements during daytime, its data are used as a common 15
reference to validate all three satellite data sets.
2 Satellite observations
The present study targets tropospheric NO2 VCD data from SCIAMACHY, OMI, and GOME-2, all of which are equipped with a UV/visible sensor measuring sunlight back-scattered from the Earth’s atmosphere and reflected by the surface as well as the 20
direct solar irradiance spectrum. SCIAMACHY was launched onboard the ENVISAT satellite in March 2002. It passes over the equator at about 10:00 LT and achieves global coverage observations in six days, with a spatial resolution of 60×30 km2. OMI
was launched onboard the Aura satellite in July 2004. The equator crossing time is about 13:40–13:50 LT. Daily global measurements are achieved by a wide field of view 25
AMTD
5, 3953–3971, 2012First quantitative bias estimates for tropospheric NO2
columns
H. Irie et al.
Title Page
Abstract Introduction
Conclusions References
Tables Figures
◭ ◮
◭ ◮
Back Close
Full Screen / Esc
Printer-friendly Version Interactive Discussion
Discussion
P
a
per
|
Dis
cussion
P
a
per
|
Discussion
P
a
per
|
Discussio
n
P
a
per
|
instrument, launched aboard a MetOp satellite in June 2006, has a ground-pixel size of 80×40 km2(240×40 km2for the back scan) over most of the globe. With its wide swath, near-global coverage (with an equator crossing time around 09:30 LT) is achieved ev-ery day. While observation specifications are thus somewhat different between the three sensors, tropospheric NO2 VCD data retrieved with the same basic algorithm 5
(DOMINO products for OMI and TM4NO2A products for SCIAMACHY and GOME-2) (Boersma et al., 2004, 2007, 2011) are compared in detail with MAX-DOAS data be-low. The error in the satellite tropospheric NO2VCD data includes uncertainties in the slant column, the stratospheric column, and the tropospheric air mass factor (AMF) (Boersma et al., 2004), and can be expressed as∼1×10¹⁵molecules cm−2+30 % for
10
polluted situations. Comparisons are made for the version 2 retrievals under cloud-free conditions, i.e. cloud fraction (CF) less than 20 %.
3 MAX-DOAS observations
Here we briefly describe ground-based MAX-DOAS measurements – scattered sun-light observations in the UV/visible at several elevation angles between the horizon and 15
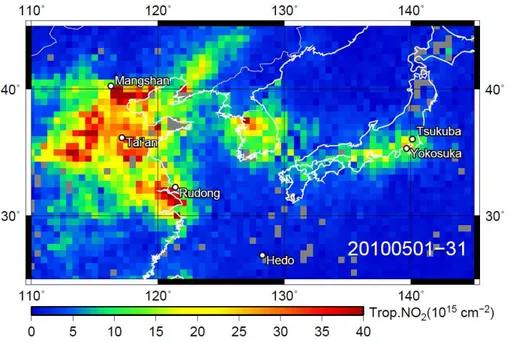
zenith (e.g., H ¨onninger and Platt, 2002; H ¨onninger et al., 2004) – performed at three sites in Japan and three sites in China (Table 1 and Fig. 1). As can be seen in Fig. 1, the MAX-DOAS measurements were conducted at various levels of NO2 pollution, cover-ing urban (Yokosuka), suburban (Tsukuba) around Tokyo, and remote areas (Hedo) in Japan and the northernmost (Mangshan), middle (Tai’an), and southernmost (Rudong) 20
parts of the highly polluted area in China. This set of observations extends the data set used by Irie et al. (2009) for the validation of the NASA OMI NO2 standard product. The present study additionally uses data for 2009–2011 and data from the Mangshan and Rudong sites. The observations at Tai’an, Mangshan, and Rudong were made as part of intensive observation campaigns for a limited time period of about 1 month for 25
AMTD
5, 3953–3971, 2012First quantitative bias estimates for tropospheric NO2
columns
H. Irie et al.
Title Page
Abstract Introduction
Conclusions References
Tables Figures
◭ ◮
◭ ◮
Back Close
Full Screen / Esc
Printer-friendly Version Interactive Discussion
Discussion
P
a
per
|
Dis
cussion
P
a
per
|
Discussion
P
a
per
|
Discussio
n
P
a
per
|
et al., 2011a, 2011b). The retrieval utilizes absorption features by NO2 and the oxy-gen dimer (O4) at 460–490 nm. The NO2absorption cross section data of Vandaele et al. (1998) at 294 K were used. The quality of our DOAS analysis is supported by formal semi-blind intercomparison results indicating good agreement with other MAX-DOAS observations to within∼10 % of other instruments for both NO2and O4differential slant 5
column densities (∆SCD) and for both the UV and visible regions (Roscoe et al., 2010). The O4∆SCD values derived from the DOAS analysis are converted using our aerosol retrieval algorithm (e.g., Irie et al., 2008) to aerosol optical depth and the vertical pro-file of the aerosol extinction coefficient. At the same time, the so-called box AMF is uniquely determined, as it is a function of the aerosol profile. Using this AMF informa-10
tion and a nonlinear iterative inversion method, the NO2∆SCD values are converted to the tropospheric VCD and the vertical profile of NO2. Error analysis for the retrieved NO2VCDs has been done based on the method described by Irie et al. (2011). For an NO2 VCD of about 100×1014molecules cm−2, typical random errors were estimated
to be 5×10¹⁴molecules cm−2 (5 %). Systematic errors due to uncertainty in the AMF 15
determination, which is likely the dominant source of systematic error in our profile re-trieval method, were estimated to be 7×10¹⁴molecules cm−2 (7 %). For the present
study, additional sensitivity analysis is performed using a different fitting window for NO2 (425–450 nm) and different NO2 cross section data (at 220 K). The errors were estimated by a manner similar to Takashima et al. (2011b) to be about−3 % (the VCD
20
retrieved from 425–450 nm is smaller) and−23 % (the VCD retrieved using the cross
section at 220 K is smaller). Scaling the latter estimate to the actual temperature varia-tion below 2 km (possibly cooled down to∼260 K at an altitude of 2 km) yields−11 %.
This value could be smaller, since NO2should be abundant near the surface, where the temperature is usually warmer than 260 K and occasionally can exceed 294 K. How-25
AMTD
5, 3953–3971, 2012First quantitative bias estimates for tropospheric NO2
columns
H. Irie et al.
Title Page
Abstract Introduction
Conclusions References
Tables Figures
◭ ◮
◭ ◮
Back Close
Full Screen / Esc
Printer-friendly Version Interactive Discussion
Discussion
P
a
per
|
Dis
cussion
P
a
per
|
Discussion
P
a
per
|
Discussio
n
P
a
per
|
30 min, which corresponds to a complete sequence of elevation angles. In the present study, a comparison is made only when the time difference between MAX-DOAS and satellite observations was less than 30 min.
4 Results and discussion
Here we compare MAX-DOAS observations performed in Japan and China in 2006– 5
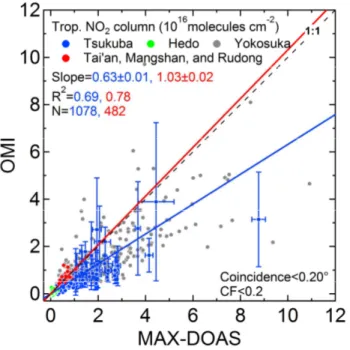
2011 with all three types of satellite products in a consistent manner. In Fig. 2, com-parisons between MAX-DOAS and OMI tropospheric NO2column data are made only if the center of the OMI pixel is within 0.20◦ latitude and longitude of an MAX-DOAS observation point. This coincidence criterion is hereinafter denotedx. Two regression
lines are shown in Fig. 2. The one shown in blue has been drawn from comparisons 10
for Tsukuba, Yokosuka, and Hedo. The regression line shown in red was obtained from comparisons for three Chinese sites (Tai’an, Mangshan, and Rudong) and Hedo. The respective cases are called hereafter the Tokyo case and China case. The slopes for the Tokyo cases are controlled mainly by comparisons over Tsukuba and Yokosuka, which are both located around Tokyo, and for the China case the three Chinese sites, 15
as their data are distributed over a wide range of NO2 value. For comparisons over Hedo (shown in green), which is located in a remote area, both satellite and MAX-DOAS data show reasonable, very small NO2 VCD values, compared to the other sites. The same features were seen for all the other cases investigated in this study. Considering this, the regression analysis has been made with the intercept forced to 20
be zero, in order to simplify the interpretation of changes in the bias estimated from the slope of the regression line under various conditions.
In Fig. 2, we find excellent agreement for the China case; the slope (±its 1σstandard
deviation) is almost unity at 1.03±0.02. On the other hand, the slope for the Tokyo case is only 0.63±0.01. For both cases, correlation coefficients (R2) are as high as 0.78 and
25
AMTD
5, 3953–3971, 2012First quantitative bias estimates for tropospheric NO2
columns
H. Irie et al.
Title Page
Abstract Introduction
Conclusions References
Tables Figures
◭ ◮
◭ ◮
Back Close
Full Screen / Esc
Printer-friendly Version Interactive Discussion
Discussion
P
a
per
|
Dis
cussion
P
a
per
|
Discussion
P
a
per
|
Discussio
n
P
a
per
|
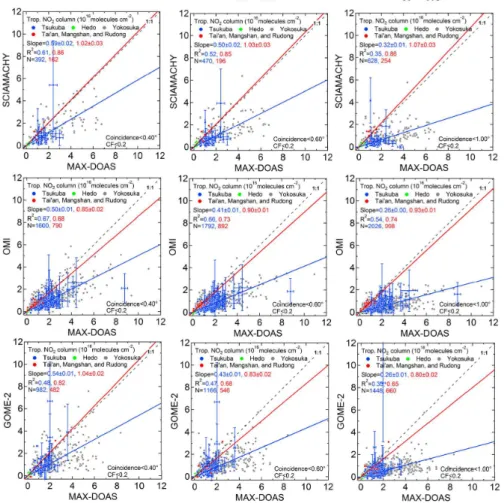
To investigate the cause of the difference, we make comparisons with various coin-cidence criteria. We test 15 different coincidence criteria:x=0.05◦, 0.10◦, 0.15◦, 0.20◦,
0.25◦, 0.30◦, 0.35◦, 0.40◦, 0.45◦, 0.50◦, 0.60◦, 0.70◦, 0.80◦, 0.90◦, and 1.00◦. The results forx=0.40◦, 0.60◦, and 1.00◦ are highlighted in Fig. 3. Variations of the slope and R2
overx are summarized in Figs. 4 and 5 for the Tokyo and China cases, respectively.
5
For the Tokyo case, we find that the slopes of the regression lines tend to be smaller when a looser coincidence criterion is used, for all comparisons with SCIAMACHY, OMI, and GOME-2. As can be seen in Fig. 1, tropospheric NO2VCD values in the sur-rounding areas of Yokosuka and Tsukuba sites usually drop quickly, owing to limited NOx source regions. For a largerx, there is a higher probability that the satellite
foot-10
prints include clean air masses, and this tends to lower both the slope andR2(Fig. 4).
The Yokosuka site is surrounded by industrial facilities, ocean (Tokyo Bay), heavy ship activity, etc., resulting in a large range of tropospheric NO2 VCD but more scatter in the correlation, compared to the Tsukuba data (Figs. 2 and 3). To better address such influences of spatial inhomogeneity in a satellite pixel, validation observations covering 15
several points in a satellite pixel at the same time would be desirable (e.g., Piters et al., 2012).
In Fig. 5, results of the estimated slopes andR2for the China case are shown.
Re-sults with an insufficient number of comparisons (less than 3) at Chinese sites have been omitted. It can be seen that the slopes slowly vary withx but the variations are
20
not as systematic as those of the Tokyo case.R2 values are greater than 0.6 for all
comparisons and usually higher than those for the Tokyo case (Figs. 4 and 5). These suggest that the spatial distributions of tropospheric NO2 VCDs around the Chinese sites during the observation periods were rather homogeneous and therefore appropri-ate for bias estimappropri-ates.
25
All the slopes estimated from comparisons over China range from 0.8 to 1.2. By simply averaging the slopes over the entirex range, the biases with respect to
AMTD
5, 3953–3971, 2012First quantitative bias estimates for tropospheric NO2
columns
H. Irie et al.
Title Page
Abstract Introduction
Conclusions References
Tables Figures
◭ ◮
◭ ◮
Back Close
Full Screen / Esc
Printer-friendly Version Interactive Discussion
Discussion
P
a
per
|
Dis
cussion
P
a
per
|
Discussion
P
a
per
|
Discussio
n
P
a
per
|
to the uncertainty in the MAX-DOAS NO2retrieval, as mentioned above. It is expected, however, that the validation comparison can be more precise using a stricter coinci-dence criterion owing to the increased probability of observing the same air masses by a satellite sensor and MAX-DOAS. Considering this, our best estimates of the biases from slopes at a strictxrange below 0.50◦are−5±14 %,−10±14 %, and+1±14 % for 5
SCIAMACHY, OMI, and GOME-2, respectively (Table 2). Thus, our study confirms the hypothesized high-quality KNMI products retrieved with the new method of Boersma et al. (2011).
5 Conclusions
To quantify the biases in the tropospheric NO2VCD data from SCIAMACHY, OMI, and 10
GOME-2 in a consistent manner, we created a single data set from MAX-DOAS obser-vations performed at three sites in Japan and three sites in China in 2006–2011. Re-gression analysis between satellite and MAX-DOAS tropospheric NO2VCDs showed that the slope of the regression line tends to be biased by the distance between MAX-DOAS and satellite observation points, due to a difference in the spatial representa-15
tiveness between MAX-DOAS and satellite observations under loose coincidence cri-teria. This feature is more clearly seen around Tokyo with strong spatial gradients in air pollution. These results serve as a guideline for future satellite validation, in terms of the choice of coincidence criteria and validation sites. We recommend conducting validation observations under relatively homogeneously polluted conditions. From the 20
slopes of the regression lines for strict coincidence criteria, we estimated biases in SCIAMACHY, OMI, and GOME-2 data to be −5±14 %, −10±14 %, and +1±14 %,
respectively, compared to the MAX-DOAS data. Thus, we conclude that the biases are less than about 10 % and insignificant for all three data sets. Thus, with a consideration of these characteristics, the present study encourages the combination of these satel-25
AMTD
5, 3953–3971, 2012First quantitative bias estimates for tropospheric NO2
columns
H. Irie et al.
Title Page
Abstract Introduction
Conclusions References
Tables Figures
◭ ◮
◭ ◮
Back Close
Full Screen / Esc
Printer-friendly Version Interactive Discussion
Discussion
P
a
per
|
Dis
cussion
P
a
per
|
Discussion
P
a
per
|
Discussio
n
P
a
per
|
Acknowledgements. We thank PREDE, Co., Ltd for their technical assistance in developing the MAX-DOAS instruments. Observations at Tsukuba were supported by M. Nakazato and T. Na-gai. This work was supported by the Global Environment Research Fund (S-7) of the Ministry of the Environment, Japan, and by the Netherlands Organisation for Scientific Research, NWO Vidi grant 864.09.001.
5
References
Boersma, K. F., Eskes, H. J., and Brinksma, E. J.: Error Analysis for tropospheric NO2retrieval from space, J. Geophys. Res., 109, D04311, doi:10.1029/2003JD003962, 2004.
Boersma, K. F., Eskes, H. J., Veefkind, J. P., Brinksma, E. J., van der A, R. J., Sneep, M., van den Oord, G. H. J., Levelt, P. F., Stammes, P., Gleason, J. F., and Bucsela, E. J.: 10
Near-real time retrieval of tropospheric NO2from OMI, Atmos. Chem. Phys., 7, 2103–2118, doi:10.5194/acp-7-2103-2007, 2007.
Boersma, K. F., Jacob, D. J., Eskes, H. J., Pinder, R. W., Wang, J., and van der A, R. J.: Intercomparison of SCIAMACHY and OMI tropospheric NO2 columns: Observing the di-urnal evolution of chemistry and emissions from space, J. Geophys. Res., 113, D16S26, 15
doi:10.1029/2007JD008816, 2008.
Boersma, K. F., Jacob, D. J., Trainic, M., Rudich, Y., DeSmedt, I., Dirksen, R., and Eskes, H. J.: Validation of urban NO2 concentrations and their diurnal and seasonal variations observed from the SCIAMACHY and OMI sensors using in situ surface measurements in Israeli cities, Atmos. Chem. Phys., 9, 3867–3879, doi:10.5194/acp-9-3867-2009, 2009.
20
Boersma, K. F., Eskes, H. J., Dirksen, R. J., van der A, R. J., Veefkind, J. P., Stammes, P., Huijnen, V., Kleipool, Q. L., Sneep, M., Claas, J., Leit ˜a o, J., Richter, A., Zhou, Y., and Brun-ner, D.: An improved tropospheric NO2column retrieval algorithm for the Ozone Monitoring Instrument, Atmos. Meas. Tech., 4, 1905–1928, doi:10.5194/amt-4-1905-2011, 2011. Bovensmann, H., Burrows, J. P., Buchwitz, M., Frerick, J., Noel, S., Rozanov, V. V., Chance, 25
K. V., and Goede, A. H. P.: SCIAMACHY – Mission objectives and measurement modes, J. Atmos. Sci., 56, 127–150, doi:10.1175/1520-0469(1999)056¡0127:SMOAMM¿2.0.CO;2, 1999.
Callies, J., Corpaccioli, E., Eisinger, M., Hahne, A., and Lefebvre, A.: GOME-2- Metop’s second-generation sensor for operational ozone monitoring, ESA Bull., 102, 28–36, 2000.
AMTD
5, 3953–3971, 2012First quantitative bias estimates for tropospheric NO2
columns
H. Irie et al.
Title Page
Abstract Introduction
Conclusions References
Tables Figures
◭ ◮
◭ ◮
Back Close
Full Screen / Esc
Printer-friendly Version Interactive Discussion
Discussion
P
a
per
|
Dis
cussion
P
a
per
|
Discussion
P
a
per
|
Discussio
n
P
a
per
|
H ¨onninger, G. and Platt, U.: Observations of BrO and its vertical distribution during surface ozone depletion at Alert, Atmos. Environ., 36, 2481–2489, 2002.
H ¨onninger, G., von Friedeburg, C., and Platt, U.: Multi axis differential optical absorption spectroscopy (MAX-DOAS), Atmos. Chem. Phys., 4, 231–254, doi:10.5194/acp-4-231-2004, 2004.
5
Irie, H., Kanaya, Y., Akimoto, H., Iwabuchi, H., Shimizu, A., and Aoki, K.: First retrieval of tro-pospheric aerosol profiles using MAX-DOAS and comparison with lidar and sky radiometer measurements, Atmos. Chem. Phys., 8, 341–350, doi:10.5194/acp-8-341-2008, 2008. Irie, H., Kanaya, Y., Takashima, H., Gleason, J. F., and Wang, Z.: Characterization of OMI
tropospheric NO2 measurements in East Asia based on a robust validation comparison, 10
SOLA, 5, 117–120, doi:10.2151/sola.2009-030, 2009.
Irie, H., Takashima, H., Kanaya, Y., Boersma, K. F., Gast, L., Wittrock, F., Brunner, D., Zhou, Y., and Van Roozendael, M.: Eight-component retrievals from ground-based MAX-DOAS observations, Atmos. Meas. Tech., 4, 1027–1044, doi:10.5194/amt-4-1027-2011, 2011. Levelt, P. F., van den Oord, G. H. J., Dobber, M. R., Malkki, A., Visser, H., de Vries, J., Stammes, 15
P., Lundell, J., and Saari, H.: The Ozone Monitoring Instrument, IEEE, Trans. Geo. Rem. Sens., 44, 5, 1093–1101, doi:10.1109/TGRS.2006.872333, 2006.
Lin, J.-T., McElroy, M. B., and Boersma, K. F.: Constraint of anthropogenic NOx emissions in China from different sectors: a new methodology using multiple satellite retrievals, Atmos. Chem. Phys., 10, 63–78, doi:10.5194/acp-10-63-2010, 2010.
20
Piters, A. J. M., Boersma, K. F., Kroon, M., Hains, J. C., Van Roozendael, M., Wittrock, F., Abuhassan, N., Adams, C., Akrami, M., Allaart, M. A. F., Apituley, A., Beirle, S., Bergwerff, J. B., Berkhout, A. J. C., Brunner, D., Cede, A., Chong, J., Cl ´emer, K., Fayt, C., Frieß, U., Gast, L. F. L., Gil-Ojeda, M., Goutail, F., Graves, R., Griesfeller, A., Großmann, K., Hemerijckx, G., Hendrick, F., Henzing, B., Herman, J., Hermans, C., Hoexum, M., van der Hoff, G. R., Irie, 25
H., Johnston, P. V., Kanaya, Y., Kim, Y. J., Klein Baltink, H., Kreher, K., de Leeuw, G., Leigh, R., Merlaud, A., Moerman, M. M., Monks, P. S., Mount, G. H., Navarro-Comas, M., Oetjen, H., Pazmino, A., Perez-Camacho, M., Peters, E., du Piesanie, A., Pinardi, G., Puentedura, O., Richter, A., Roscoe, H. K., Sch ¨onhardt, A., Schwarzenbach, B., Shaiganfar, R., Sluis, W., Spinei, E., Stolk, A. P., Strong, K., Swart, D. P. J., Takashima, H., Vlemmix, T., Vrekoussis, 30
AMTD
5, 3953–3971, 2012First quantitative bias estimates for tropospheric NO2
columns
H. Irie et al.
Title Page
Abstract Introduction
Conclusions References
Tables Figures
◭ ◮
◭ ◮
Back Close
Full Screen / Esc
Printer-friendly Version Interactive Discussion
Discussion
P
a
per
|
Dis
cussion
P
a
per
|
Discussion
P
a
per
|
Discussio
n
P
a
per
|
design, execution, and early results, Atmos. Meas. Tech., 5, 457–485, doi:10.5194/amt-5-457-2012, 2012.
Roscoe, H. K., Van Roozendael, M., Fayt, C., du Piesanie, A., Abuhassan, N., Adams, C., Akrami, M., Cede, A., Chong, J., Cl ´emer, K., Friess, U., Gil Ojeda, M., Goutail, F., Graves, R., Griesfeller, A., Grossmann, K., Hemerijckx, G., Hendrick, F., Herman, J., Hermans, C., Irie, 5
H., Johnston, P. V., Kanaya, Y., Kreher, K., Leigh, R., Merlaud, A., Mount, G. H., Navarro, M., Oetjen, H., Pazmino, A., Perez-Camacho, M., Peters, E., Pinardi, G., Puentedura, O., Richter, A., Sch ¨onhardt, A., Shaiganfar, R., Spinei, E., Strong, K., Takashima, H., Vlemmix, T., Vrekoussis, M., Wagner, T., Wittrock, F., Yela, M., Yilmaz, S., Boersma, F., Hains, J., Kroon, M., Piters, A., and Kim, Y. J.: Intercomparison of slant column measurements of NO2 10
and O4by MAX-DOAS and zenith-sky UV and visible spectrometers, Atmos. Meas. Tech., 3, 1629–1646, doi:10.5194/amt-3-1629-2010, 2010.
Takashima, H., Irie, H., Kanaya, Y., and Akimoto, H.: Enhanced NO2at Okinawa Island, Japan caused by rapid air-mass transport from China as observed by MAX-DOAS, Atmos. Environ., 45, 2593–2597, 2011a.
15
Takashima, H., Irie, H., Kanaya, Y., and Syamsudin, F.: NO2 observations over the western Pacific and Indian Ocean by MAX-DOAS on Kaiyo, a Japanese research vessel, Atmos. Meas. Tech. Discuss., 4, 6069–6095, doi:10.5194/amtd-4-6069-2011, 2011b.
Vandaele, A. C., Hermans, C., Simon, P. C., Carleer, M., Colin, R., Fally, S., M ´erienne, M. F., Jenouvrier, A., and Coquart, B.: Measurements of the NO2 absorption cross-section from 20
AMTD
5, 3953–3971, 2012First quantitative bias estimates for tropospheric NO2
columns
H. Irie et al.
Title Page
Abstract Introduction
Conclusions References
Tables Figures
◭ ◮
◭ ◮
Back Close
Full Screen / Esc
Printer-friendly Version Interactive Discussion
Discussion
P
a
per
|
Dis
cussion
P
a
per
|
Discussion
P
a
per
|
Discussio
n
P
a
per
|
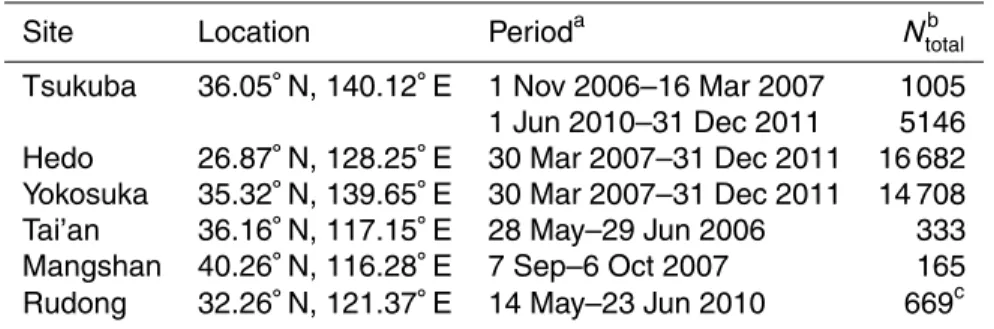
Table 1.Site information for MAX-DOAS observations.
Site Location Perioda Nb
total Tsukuba 36.05◦N, 140.12◦E 1 Nov 2006–16 Mar 2007 1005 1 Jun 2010–31 Dec 2011 5146 Hedo 26.87◦N, 128.25◦E 30 Mar 2007–31 Dec 2011 16 682 Yokosuka 35.32◦N, 139.65◦E 30 Mar 2007–31 Dec 2011 14 708 Tai’an 36.16◦N, 117.15◦E 28 May–29 Jun 2006 333 Mangshan 40.26◦
N, 116.28◦
E 7 Sep–6 Oct 2007 165
Rudong 32.26◦N, 121.37◦E 14 May–23 Jun 2010 669c
aMeasurements were not always made continuously in the period, for example, due to
cloudy conditions.
bThe total number of NO
2VCD data points available in the period. cFor two MAX-DOAS instruments directed to di
AMTD
5, 3953–3971, 2012First quantitative bias estimates for tropospheric NO2
columns
H. Irie et al.
Title Page
Abstract Introduction
Conclusions References
Tables Figures
◭ ◮
◭ ◮
Back Close
Full Screen / Esc
Printer-friendly Version Interactive Discussion
Discussion
P
a
per
|
Dis
cussion
P
a
per
|
Discussion
P
a
per
|
Discussio
n
P
a
per
|
Table 2.Estimated biases in satellite tropospheric NO2products for different coincidence crite-rion thresholds.
Sensor x≤0.5◦
x≤1.0◦ SCIAMACHY −5±14 % 0±14 %
AMTD
5, 3953–3971, 2012First quantitative bias estimates for tropospheric NO2
columns
H. Irie et al.
Title Page
Abstract Introduction
Conclusions References
Tables Figures
◭ ◮
◭ ◮
Back Close
Full Screen / Esc
Printer-friendly Version Interactive Discussion
Discussion
P
a
per
|
Dis
cussion
P
a
per
|
Discussion
P
a
per
|
Discussio
n
P
a
per
|