1.Instituto de Estudos Avançados – São José dos Campos/SP – Brazil
Author for correspondence: André Carlos Fraile Jr | Instituto de Estudos Avançados – Divisão de Aerotermodinâmica e Hipersônica | Trevo Coronel Aviador José Alberto Albano do Amarante, 1 | CEP 12.228-001 São José dos Campos/SP – Brazil | E-mail: [email protected]
Received: 03/12/12 | Accepted: 10/04/13
ABSTRACT: This work presents a numerical analysis of the gas dynamic problem of localized and steady energy addition to uniform high-speed airlows. Firstly, the general effects caused by a localized energy deposition on the low were investigated, then an extensive parametric analysis concerning the effects of energy deposition rate and dispersion for different free stream low speeds was performed. As a general result, localized and steady energy deposition generates compression waves and constant property low stream tube downstream to the source. The parametric analysis results have shown that either increasing the rate or decreasing dispersion in the orthogonal direction to the low of the deposited energy has the effect of enhancing property low changes, which is even more pronounced for lower low speeds. In contrast, energy dispersion in the low direction has presented very little effect on the low changes. The results of this numerical analysis should be very helpful in studies of energy addition applications in hypersonic.
KEYWORDS: High speed low, Energy addition, Flow control, Numerical analysis.
A Numerical Investigation of Localized
and Steady Energy Addition to High
Speed Airlows
André Carlos Fraile Jr1, Mauricio Antoniazzi Pinheiro Rosa1
INTRODUCTION
he need of aerospace vehicles for high speeds discloses a series of aerodynamics problems, such as large pressure drag forces and strong shock waves. It is known that, for a blunt body at supersonic speeds, a physical spike placed at its nose modiies the structure of the strong shock wave, which can reduce wave drag in an efective way, although this structure also requires an undesirable additional cooling system (Riggins et al., 1999, Riggins and Nelson, 1999, Knight, 2003).
Another way to control high speed lows, which has also been considered for the reduction of aerodynamic drag of aerospace vehicles, corresponds to energy deposition in a small region of the airlow upstream to the vehicle. his is similarly capable of modifying the properties and path of the luid elements and consequently of reducing the strength of the vehicle shock wave by modifying its shape (Riggins et al., 1999, Riggins and Nelson, 1999, Knight, 2003). Besides this application, energetic techniques for high-speed low control have been recently widely studied with several other purposes, such as inlet mass capture increase by scramjet engines operating at of design speeds, attitude control of supersonic vehicles, scramjet isolator shortening, among others. Deposition of energy to airlows has been experimentally accomplished by several diferent means, such as plasma arcs, laser pulse, microwave, electron beam, glow discharges, and so on (Oliveira, 2008c).
experimental studies previously performed at the IEAv, with respect to the addition of laser energy pulses to investigate vehicle drag and heat transfer (Minnuci et al., 2005, Oliveira, 2008a, 2008b, 2008c, Salvador et al., 2005, 2007, 2008), has shown the need of numerical analyses to obtain a better understanding of the phenomena generally observed and also to support new experiments. h erefore, in this work, which focused on understanding the properties of an energized l ow without the presence of bodies, it is presented a numerical investigation of a localized steady energy addition to high-speed airl ows, by varying the energy deposition rate and the spatial dispersion for dif erent free stream airl ow speeds (Fraile Jr., 2011). While this subject has already been studied, this paper presents a series of results showing airl ow variables — such as velocity, density, pressure, and temperature — when several conditions were modii ed, and these results can provide information to another ongoing numerical study at IEAv related to wave drag reduction of blunt bodies in supersonic l ows using energy addition. Herein, energy addition to high-speed l ows is studied from thermodynamics and gas dynamics standpoints by considering that the energy addition ef ectively represents the direct energy transfer to the air translational (thermal) mode. h erefore, no plasma ef ects are considered and localized energy addition to the l ow is simply treated as a volumetric heat source.
METHODOLOGY
h e schematic shown in Fig. 1 represents the numerical problem treated in this work. h e analysis performed takes
into account a two-dimensional representation in space by considering axial symmetry. h e physical (computational) domain, also shown in Fig, 1, contains a cylindrical volumetric heat source representing a localized steady energy deposition in a supersonic uniform airl ow. h is cylindrical heat source is aligned with the l ow.
h e Navier-Stokes equations (Eq. 1), with a volumetric source term representing the energy addition, were used in this work (FLUENT INC., 2006, Fraile Jr., 2011):
(
ρv) +
·(
ρvv) = −
p + ·(
τ)
(
ρE) +
·[
v(
ρE + p)] =
·[
k T +(
τ · v)] + Q
+ · ∆
(
ρv)
= 0∆
∆ ∆ ∆ ∆ ∆
дt дρ
дt д
дt д
=
=
⎧⎨
⎩ ⎜ ⎜
⎜ ⎜ ⎜ ⎜
(1)
where ρ is the l ow density, p is the pressure,v is the velocity,
τ represents the inl uence of viscosity on momentum and energy equations, k is the thermal conductivity, E is the energy per mass unit, and Q is the energy source term (per time and volume unit). Also, a small region of the domain receives energy and the term Q is the mathematical way employed to deposit energy to the airl ow.
h e tensor τ can be written as in Eq. 2 (FLUENT INC., 2006, Fraile Jr., 2011):
τ = µ
∆ v
+
v ∆ T− ∆
=
23 ·vI (2)
where µ is the molecular viscosity and I isthe unit tensor.
h e gas is considered ideal, therefore it can be written as in Eq. 3:
p = ρ RT (3)
where R is the gas constant.
h e energy per mass can be dei ned as Eq. 4 (FLUENT INC., 2006; Fraile Jr., 2011):
E = h − p ρ
v2
2
+ (4)
where dh = cpdT .
Figure 1. Physical (computational) domain employed for calculation of a steady heat source in a supersonic l ow.
x y pressure far field
pressure far field
pressure outlet
he numerical solution to this problem is obtained by using the Fluent®
solver (FLUENT INC., 2006) for the Navier-Stokes equations, with the conditions of laminar low and ideal gas, in a square grid that is well suitable for the geometry shown in Fig. 1. Since the numerical domain is axisymmetric, the Navier-Stokes equations are solved in cylindrical coordinates (FLUENT INC., 2006, Tannehill et al., 1997).
he equations are discretized in accordance with an implicit method and a irst order upwind spatial scheme. A “pressure-based” numerical method is used with an algorithm of coupling between the pressure and velocity named “coupled”, for which the equations of continuity and momentum are solved simultaneously, and then the other ones of the model are solved separately. he boundary conditions employed to solve the problem are also presented in Fig. 1. he addition of energy to the low in a region of the computational domain is modeled through a user-deined function (UDF), which is an available tool of the solver. he steady-state solution for the problem is sought since only steady energy depositions in the low are considered (FLUENT INC., 2006).
he supersonic free stream lows from let to right with a static pressure of p∞ = 1,0x10⁵ Pa and a temperature
of T∞ = 300K. While it is intended to use the results of this work for better understanding the efects of energy addition on supersonic airlow, they have been also used to study the efects of energy addition on blunt body wave drag reduction. his fact justiies some of the variables used herein, like the heat source dimensions, which have the same magnitude (millimeters) of those used in shock tunnels, and also of the heat power presented in the following sections, which have been used in recent works at the IEAv.
RESULTS AND DISCUSSION
his section presents the results concerning the modiication of a uniform low due to the presence of an energy source conined to a small low region in order to understand how the source afects the low properties.
GENERAL CHARACTERISTICS OF THE FLOW WITH LOCALIZED STEADY ENERGY ADDITION
In order to identify the key changes of the properties of a uniform low caused by the addition of energy to a small
region in space, the physical domain shown in Fig. 1 is used to perform numerical calculations. It is considered that energy is steadily deposited uniformly in a small cylindrical region (length l0 = 1.0 mm and radius r0 = 0.5 mm), which is centered at the origin of the reference axes, with total power of 471 W, in a uniform Mach 4 free stream low. he square grid used in all calculations is 20 cells/mm, which has yielded good accuracy results. he data used to validate this grid will be presented in this section ater some basic efects of energy addition to the airlow have been discussed. he results corresponding to the scalar ields of the low properties, such as pressure (p), temperature (T), density (ρ), as well as the low movement quantities such as Mach number (M), axial (Vx) and radial velocities (Vy) are presented in Fig. 2. Figure 3 presents the outcomes for the low variables along the symmetry axis (lower boundary in Fig. 1) and in a cross-sectional plane downstream to the heat source perpendicular to the free stream low direction (right-hand boundary in Fig. 1).
property stream tube, the temperature has doubled whereas the Mach number and density have reduced about 30 and 50%, respectively, of their free stream values. However, it should be noted that the laminar model used in this work does not take into account difusion and convection efects in lows far from walls, therefore it behaves as an inviscid one that justiies the later results. On the other hand, in real life lows are always at least somewhat turbulent, thus it is expected that the inluence of the source on the low — in terms of the distance from the source that all low properties return to their free stream values — is smaller than for laminar ones.
he results shown in this work were obtained with a square grid of 20 cells/mm (each millimeter along the source
axis or the direction perpendicular to it is divided into 20 parts), which can be validated through comparison with others of diferent resolutions. Figure 4 presents some low variables (pressure, temperature, Mach number, and density) along the source symmetry axis when the resolution of the square grid is modiied.
Even with the 10 cells/mm mesh, it is already possible to capture the main efects discussed herein, and it is also clear that the use of more reined meshes provides more accurate results. herefore, it was chosen the 20 cells/mm mesh, instead of the higher resolution one, because this yields enough accurate results, for the present purpose, without being so computationally costly.
Figure 2. Scalar ields for a Mach 4 free stream and a 471 W heat source, of: (a) pressure; (b) temperature; (c) density; (d) Mach; (e) axial velocity; and (f) radial velocity.
-8 -4 0 4 8 12 16 20 24 28 32 20
16
12
8
4
0
x/r0
y/r
0
p (Pa) 2.5x10+05 2.2x10+05 1.9x10+05 1.7x10+05 1.4x10+05 8.0x10+05
(a)
-8 -4 0 4 8 12 16 20 24 28 32 20
16
12
8
4
0
x/r0
y/r
0
T (K)
782 710 639 567 495 423 352 280
(b)
-8 -4 0 4 8 12 16 20 24 28 32 20
16
12
8
4
0
x/r0
y/r
0
ρ (kg/m3)
1.49 1.32 1.14 0.97 0.80 0.62 0.45
(c)
-8 -4 0 4 8 12 16 20 24 28 32 20
16
12
8
4
0
x/r0
y/r
0
M
4.00 3.75 3.50 3.25 3.00 2.75 2.50
(d)
-8 -4 0 4 8 12 16 20 24 28 32 20
16
12
8
4
0
x/r0
y/r
0
Vx(m/s) 1460 1431 1402 1373 1343 1314 1285
(e)
-8 -4 0 4 8 12 16 20 24 28 32 20
16
12
8
4
0
x/r0
y/r
0
Vy(m/s) 160 131 102 73 42 14 -15
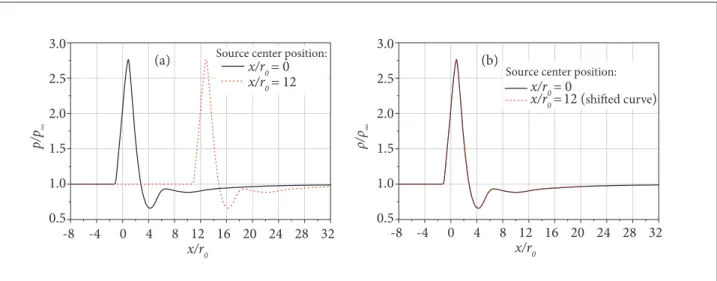
In order to show that the boundary condition of free stream near the energy source is not affecting the results, it is possible to analyze the airflow when the distance between the source center and the left pressure far field boundary shown in Fig. 1 is increased. Figure 5 presents the pressure distribution along the symmetry axis for a Mach 4 free stream and a 471 W heat source when it is centered in the same position of all results of this paper, x/r0 = 0, and when it is centered 12 units of r0 away from its original position.
When the pressure distribution for x/r0 = 12 is graphically shited 12 units to the let along the x/r0 axis (Fig. 5b), both distributions are approximately coincident, which indicates that the far ield boundary condition is not afecting the solution. he same analysis was performed for other low properties (temperature, density, and Mach number) and they showed the same behavior presented in Fig. 5.
In the next sections, the efects of energy deposition rate and dispersion as well as the free stream velocity in supersonic lows are analyzed based on the luid behavior nearby, inside the source and also in both regions downstream to the source mentioned before, which actually are of more interest for practical applications.
EFFECTS OF ENERGY
DEPOSITION RATE (HEAT SOURCE POWER)
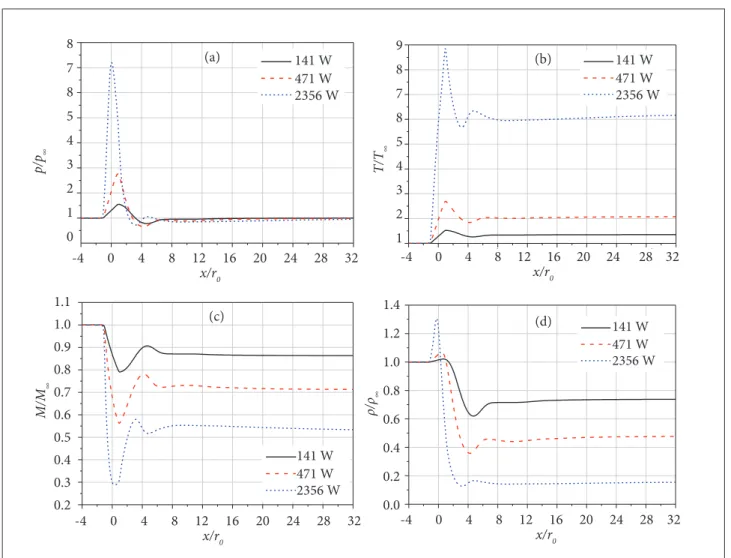
When the effects of energy addition to high speed flows are analyzed, it is also of interest to study how the rate of energy deposition changes the flow properties. Figure 6 presents results of the flow properties along the symmetry axis whereas Fig. 7 shows results in a downstream perpendicular plane to the symmetry axis for three different values of energy deposition rate (heat source power).
Figure 3. Normalized low properties for a Mach 4 free stream and a 471 W heat source, along the (a) lower (symmetry axis) and (b) right-hand boundaries of the domain in Fig. 1.
!" !# $ # " % & % ' & $ & # & " ( & $ )* % )$ % )* & )$ & )* ( )$ p/p , T /T x/r0 p/p T/T
!" !# $ # " % & % ' & $ & # & " ( & $ )( $ )# $ )* $ )' $ )+ $ )" $ ), % )$ % )% / , M/ M , V /V x/r 0 - / -M/M -V/V
! " # $ % & ! & " & # ! '# ! '( ! '$ ! ') ! '% ! '* & '! & '& y/r0 / , M/ M , V /V + / +M/M +V/V
! " # $ % & ! & " & # ! '% & '! & '" & '# & '$ & '% " '! " '" y/r 0 p/p , T/T p/p T/T -8 p/p ∞ , T/T ∞ ρ/ρ ∞ , M/M ∞, V/V ∞ ρ/ρ ∞ , M/M ∞, V/V ∞ V/V∞ 0.5 0.3 0.4 0.5 0.6 0.7 0.8 0.9 1.0 1.1 0.4 0.5 0.6 0.7 0.8 0.9 1.0 1.1 1.0 1.5 2.0 2.5 3.0
-4 0 4 8 12 16
x/r0 20 24 28 32 -8 -4 0 4 8 x/r12 160
y/r0
20 24 28 32
0 2 4 6 8 10 12 14
p/p∞ T/T∞ ρ/ρ∞ M/M∞ ρ/ρ ∞ , T/T ∞ 0.8 1.0 1.2 1.4 1.6 1.8 2.0 2.2
0 2 4 6 8 10 12
y/r0 14
Figure 4. Changes in low properties for different grids (Mach 4 free stream and 471 W heat source): (a) p/p∞; (b) T/T∞ ;
(c) M; (d) ρ/ρ∞ .
!" !# $ # " % & % ' & $ & # & " ( & $ )* % )$ % )* & )$ & )* ( )$ p/p
x/r0 !" !# $ # " % & % ' & $ & # & " ( & $ )" % )$ % )& % )# % )' % )" & )$ & )& & )# & )' & )" T/T x/r0
!" !# $ # " % & % ' & $ & # & " ( & & )$ & )& & )# & )' & )" ( )$ ( )& ( )# ( )' ( )" # )$ # )& M
x/r 0 !" !# $ # " % & % ' & $ & # & " ( & $ )( $ )# $ )* $ )' $ )+ $ )" $ ), % )$ % )% / x/r0 (a) (c) (b) (d) p/p ∞ ρ/ρ ∞ T/T ∞ M 0.5
-8 -4 0 4 8 12
Mesh:
16 20 24
x/r0 28 32 -8 -4 0 4 8 12 16 20 24x/r0 28 32
-8 -4 0 4 8 12 16 20 24
x/r0 28 32
-8 -4 0 4 8 12 16 20 24
x/r0 28 32
1.0 1.5 2.0 2.5 3.0 0.8 1.0 1.2 1.4 1.6 1.8 2.0 2.2 2.4 2.6 2.8 2.0 2.2 2.4 2.6 2.8 3.0 3.2 3.4 3.6 3.8 4.0 4.2 0.3 0.4 0.5 0.6 0.7 0.8 0.9 1.0 1.1 10 cells/mm 20 cells/mm 40 cells/mm Mesh: 10 cells/mm 20 cells/mm 40 cells/mm Mesh: 10 cells/mm 20 cells/mm 40 cells/mm Mesh: 10 cells/mm 20 cells/mm 40 cells/mm
Figure 5. Pressure along the symmetry axis (Mach 4 free stream and 471 W) for different source center positions:
(a) original distributions; (b) distribution when source center in x/r0=12 is shifted 12 units of x/r0 to the left.
!" !# $ # " % & % ' & $ & # & " ( & $ )* % )$ % )* & )$ & )* ( )$ p/p x/r0
!" !# $ # " % & % ' & $ & # & " ( & $ )* % )$ % )* & )$ & )* ( )$ p/p x/r0 p/p ∞ ρ/ρ ∞ -8 3.0 2.5 2.0 1.5 1.0 0.5 3.0 2.5 2.0 1.5 1.0 0.5
-4 0 4 8 12 16
Source center position:
20 24 28 32 x/r0
x/r0 = 0 Source center position:
x/r0 = 0 x/r0 = 12
x/r0 = 12 ( )
-8 -4 0 4 8 12 16 20 24 28 32
x/r0
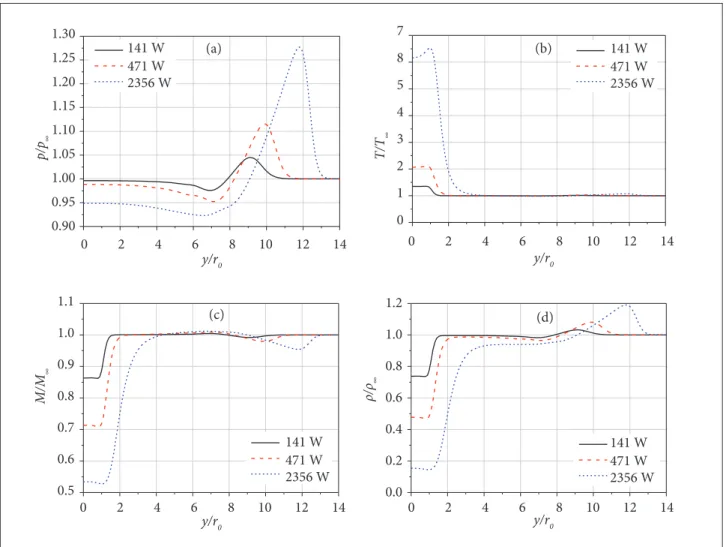
It is observed in Fig. 6 that the higher the heat source power the more pronounced the efects on the low properties, as previously discussed. In other words, increasing the source power, the pressure, temperature, and density also increase inside the heat source, making the low compression higher and consequently diverting more low obliquely to the symmetry axis. Furthermore, by increasing the source power, the expansion of the low is more pronounced (higher variable changes) in the region immediately downstream to the source, although its length is not much afected by the source power for the same free stream velocity. Considering the efects on the low for distances beyond the downstream expanding region, that is, where the pressure along the symmetry axis has already basically returned to its free stream value, it can be inferred from Figs. 6 and 7 that by increasing the power the axial length
of the irst region behind the source, where the low properties are still changing, is not much afected (Fig. 6). he changes in temperature, Mach number and density get more pronounced inside the low stream tube (Figs. 6 and 7), the radius of the stream tube gets only slightly bigger (Fig. 7), and the wave fronts get stronger and slightly faster (Figs. 7a and d).
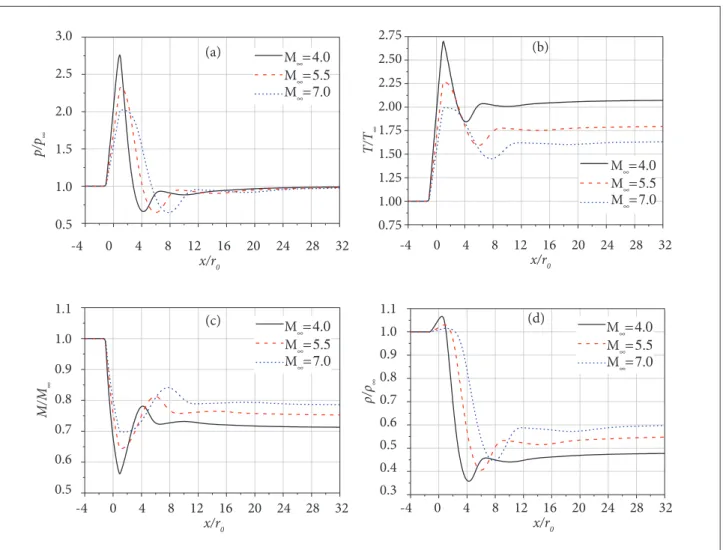
EFFECT OF FREE STREAM FLOW SPEED
Another aspect to be considered in this study is the efect of the free stream low speed on the low properties with localized steady energy addition to the low. Figures 8 and 9 show their results along, respectively, the symmetry axis and the right-hand boundary in Fig. 1, corresponding to three values for M∞ (for the same free stream sound speed) and 471 W power added to the low.
# " $ % & % ' & # & " & $ # " $ % & % ' & # & " & $ ( &
p/p
∞
ρ/ρ
∞
T/T
∞
M/M
∞
8
7
8
5
4
3
2
1
0
1.1 1.0 0.9 0.8 0.7 0.6 0.5 0.4 0.3 0.2
1.4
1.2
1.0
0.8
0.6
0.4
0.2
0.0 9
8
7
8
5
4
3
2
1
-4 0 4 8 12 16
(a)
20 24 28 32
x/r0
-4 0 4 8 12 16 20 24 28 32
x/r0
-4 0 4 8 12 16 20 24 28 32
x/r0
-4 0 4 8 12 16 20 24 28 32
x/r0 141 W
471 W 2356 W
141 W 471 W 2356 W
141 W 471 W 2356 W
(b)
(c) (d)
141 W 471 W 2356 W
Figure 6. Changes in low properties with the power (M∞ = 4,0) along the symmetry axis: (a) p/p∞; (b) T/T∞; (c) M/M∞;
Figure 7. Change of low properties (M∞= 4.0) along the cross section plane at the right-hand boundary as a function of power:
(a) p/p∞; (b) T/T∞ ; (c) M/M∞; (d) ρ/ρ∞.
p/p
∞
ρ/ρ
∞
T/T
∞
M/M
∞
1.30
1.25
1.20
1.15
1.10
1.05
1.00
0.95
0.90
1.1
1.0
0.9
0.8
0.7
0.6
0.5
1.2
1.0
0.8
0.6
0.4
0.2
0.0 7
8
5
4
3
2
1
0
0 2 4 6 8 10 12 14
0 2 4 6 8 10 12 14 0 2 4 6 8 10 12 14
(a) 141 W
471 W 2356 W
y/r0 y/r0
y/r0 y/r0
141 W 471 W 2356 W
141 W 471 W 2356 W
141 W 471 W 2356 W (b)
(c) (d)
0 2 4 6 8 10 12 14
The results in Fig. 8 confirm the trend already observed that the most significant variations of the flow properties occur basically inside the heat source and in a small distance downstream from it. Also, in Fig. 8, it can be seen that the expansion region is elongated for higher Mach numbers, due to the increase in the flow speed, which corresponds to the transport of changes in flow property to greater distances from the source before reaching almost constant values. When the free stream Mach number is higher, due to an increase in the free stream speed, the fluid residence time inside the heat source decreases and so does the rate of temperature change inside the source (lower peak) resulting in smaller alterations to the other flow properties not only inside the source but also downstream of it. For instance (Fig. 8), the Mach number and density reductions
Figure 8. Flow properties (471 W heat source) along the symmetry axis as a function of free stream low velocity: (a) p/p∞;
(b) T/T∞ ; (c) M/M∞ ; (d) ρ/ρ∞.
p/p
∞
ρ/ρ
∞
T/T
∞
M/M
∞
3.0
2.5
2.0
1.5
1.0
0.5
1.1
1.0
0.9
0.8
0.7
0.6
0.5
1.1 1.0 0.9 0.8 0.7 0.6 0.5 0.4 0.3 2.75
2.50
2.25
2.00
1.75
1.50
1.25
1.00
0.75
-4 0 4 8 12 16
(a)
20 24 28 32
M∞= 4.0
M∞= 5.5
M∞= 7.0
M∞= 4.0
M∞= 5.5
M∞= 7.0
M∞= 4.0
M∞= 5.5
M∞= 7.0
M∞= 4.0
M∞= 5.5
M∞= 7.0
x/r0
-4 0 4 8 12 16 20 24 28 32
x/r0
-4 0 4 8 12 16 20 24 28 32
x/r0
-4 0 4 8 12 16 20 24 28 32
x/r0 (b)
(c) (d)
EFFECTS OF ENERGY DEPOSITION DISPERSION (HEAT SOURCE SIZE)
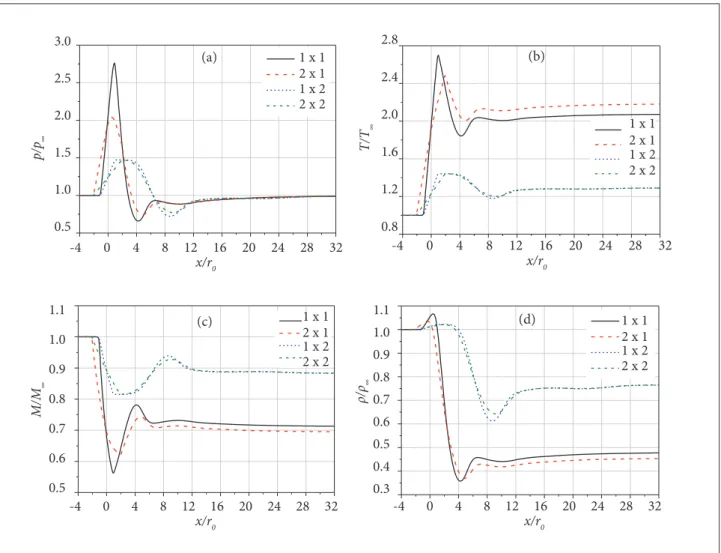
his section presents the overall results of a study about the efects of the energy deposition dispersion on a supersonic low. his will be treated here by considering diferent heat source sizes, that is, by varying the radius (r) and length (l) of the cylindrical source, taking as reference the heat source used in the previous sections (l0=1.0 mm and r0=0.5 mm; 471 W total power). For the sake of clarity, the cylindrical source size (length and radius) will be written in the normalized form (l/l0×r/r0). Four diferent cases have been considered: the reference source (1×1); the double length (2×1); the double radius (1×2); and the double length and radius (2×2). In terms of the source volumetric heat rate, considering that the reference source is q0, then the others are q0/2, q0/4 and q0/8, respectively.
Figures 10 and 11 show the low property results along, respectively, the symmetry axis and the right-hand boundary in Fig. 1, corresponding to the four cases mentioned for a Mach 4 free stream and 471 W source total power.
Figure 9. Flow properties (471 W heat source) along the cross-sectional plane at the right-hand boundary in Fig. 1 as a
function of free stream low velocity: (a) p/p∞ ; (b) T/T∞ ; (c) M/M∞ ; (d) ρ/ρ∞ .
p/p
∞
ρ/ρ
∞
T/T
∞
M/M
∞
2.2
2.0
1.8
1.6
1.4
1.2
1.0
0.8 1.15
1.10
1.05
1.00
0.95
0.90
1.05
1.00
0.95
0.90
0.85
0.80
0.75
0.70
1.2
1.1 1.0
0.9
0.8
0.7
0.6
0.5
0.4
0 2 4 6 8 10 12 14
0 2 4 6 8 10 12 14 0 2 4 6 8 10 12 14
(a)
M∞= 4.0
M∞= 5.5
M∞= 7.0
M∞= 4.0
M∞= 5.5
M∞= 7.0
M∞= 4.0
M∞= 5.5
M∞= 7.0
M∞= 4.0
M∞= 5.5
M∞= 7.0
y/r0 y/r0
y/r0 y/r0
(b)
(c) (d)
0 2 4 6 8 10 12 14
low stream tube radius is still about the source radius; and the wave fronts gain in strength but with unchangeable wave speed. In conclusion, energy deposition dispersion in the low direction (x-direction) has little efect on the low, except for small radial dispersion whereas dispersion in the radial direction (y-direction) has major impact on the low.
COMMENTS AND CONCLUSIONS
his work has shown the efects on the low structure of a localized and steady energy addition to uniform supersonic airlows, based only on thermodynamics and gas dynamics standpoints. he knowledge obtained here about the high-speed low changes due to localized energy addition certainly
will be of great importance for the subsequent studies related to the applications of energetics in hypersonics at the IEAv.
Figure 10. Flow properties (M∞ = 4,0) along the symmetry axis of the energy source as a function of source geometry:
(a) p/p∞ ; (b) T/T∞ ; (c) M/M∞ ; (d) ρ/ρ∞ .
p/p
∞
ρ/ρ
∞
T/T
∞
M/M
∞
3.0
2.5
2.0
1.5
1.0
0.5
1.1
1.0
0.9
0.8
0.7
0.6
0.5
1.1
1.0
0.9
0.8
0.7
0.6
0.5
0.4
0.3 2.8
2.4
2.0
1.6
1.2
0.8
-4 0 4 8 12 16
(a)
20 24 28 32
1 x 1 2 x 1 1 x 2 2 x 2
1 x 1 2 x 1 1 x 2 2 x 2
1 x 1 2 x 1 1 x 2 2 x 2 1 x 1
2 x 1 1 x 2 2 x 2 x/r0
-4 0 4 8 12 16 20 24 28 32
x/r0
-4 0 4 8 12 16 20 24 28 32
x/r0
-4 0 4 8 12 16 20 24 28 32
x/r0 (b)
(c) (d)
Actually, this latter region is characterized by a long constant low property stream tube aligned to the symmetry axis, of about the same source radius, with lower density and Mach number and higher temperature than their respective free stream values. Between these two regions and the wave fronts, the low remains very close to the free stream one.
he outcomes have also shown that either increasing energy deposition rate, or reducing free stream speed as well as decreasing radial dispersion, has the efect of increasing the changes in the low properties inside the source and in both mentioned regions around the symmetry axis. In contrast, axial dispersion has presented little efect on the low, mainly when the radial dispersion is comparable or higher than the axial one. Another important parameter is the irst region length, which increases substantially by increasing the
free stream speed or source radius. Another interesting result is that for a ixed free stream speed, the length of this region is always given by a ixed number of source radius, for instance, for a Mach 4 free stream, this region length is approximately six times the source radius. Also, it is important to mention that the constant property stream tube radius has always approximately the source radius and is not much afected by source power, free stream speed, or axial dispersion.
Figure 11. Flow properties (M∞ = 4,0) in a cross-sectional plane at the right-hand boundary in Fig. 1 as a function of source
geometry: (a) p/p∞ ; (b) T/T∞ ; (c) M/M∞ ; (d) ρ/ρ∞.
p/p
∞
ρ/ρ
∞
T/T
∞
M/M
∞
2.4
2.2
2.0
1.8
1.6
1.4
1.2
1.0
0.8
1.15
1.10
1.05
1.00
0.95
0.90
1.05 1.00
0.95
0.90 0.85
0.80
0.75 0.70
0.65
1.1
1.0
0.9
0.8
0.7
0.6
0.5
0.4
0 2 4 6 8 10 12 14
0 2 4 6 8 10 12 14 0 2 4 6 8 10 12 14
(a) 1 x 1
2 x 1 1 x 2 2 x 2
1 x 1 2 x 1 1 x 2 2 x 2
1 x 1 2 x 1 1 x 2 2 x 2
1 x 1 2 x 1 1 x 2 2 x 2
y/r0 y/r
0
y/r0 y/r0
(b)
(c) (d)
0 2 4 6 8 10 12 14
REFERENCES
FLUENT INC., 2006, “FLUENT 6.3 User’s Guide”, Retrieved in May 03, 2013, from http://cdlab2.luid.tuwien.ac.at/LEHRE/TURB/ Fluent.Inc/luent6.3.26/help/html/ug/main_pre.htm
Fraile Jr., A.C., 2011, “Um estudo numérico da redução de arrasto em corpos rombudos por adição de energia em escoamentos de altas velocidades” (In Portuguese), Thesis, Instituto Tecnológico de Aeronáutica, 128 p.
Knight, D., 2003, “Survey of Aerodynamic Flow Control at High Speed by Energy Deposition”, 41st AIAA Aerospace Sciences Meeting and Exhibit, 19 p.
Minucci, M.A.S. et al., 2005, “Laser-supported directed-energy
‘airspike’ in hypersonic low”, Journal of Spacecraft and Rockets, Vol. 42, No. 1, pp. 51-57.
Oliveira, A.C. et al., 2008a, “Bow shock wave mitigation by
laser-plasma energy addition in hypersonic low”, Journal of Spacecraft and Rockets, Vol. 45, No. 5, pp. 921-927.
Oliveira, A.C. et al., 2008b, “Drag Reduction by Laser-Plasma Energy
Addition in Hypersonic Flow”, Fifth International Symposium on Beamed Energy Propulsion, Vol. 997, pp. 379-389.
Oliveira, A.C., 2008c, “Investigação experimental da adição de
energia por laser em escoamento hipersônico de baixa densidade” (In Portuguese), Thesis, Instituto Nacional de Pesquisas Espaciais, 202 p.
Riggins, D.W. et al., 1999, “Blunt-body wave drag reduction using focused energy deposition”, AIAA Journal, Vol. 37, No. 4, pp. 460-467.
Riggins, D.W., Nelson, H.F., 1999, “Hypersonic low control using upstream focused energy deposition”, Aerospace Sciences Meeting & Exhibit, 37, Reno.
Salvador, I.I. et al., 2005, “Experimental Analysis of Heat Flux to a
Blunt Body in Hypersonic Flow with Upstream Laser Energy Deposition Preliminary Results”, 4th International Symposium on Beamed Energy Propulsion, Vol. 830, pp. 163-171.
Salvador, I.I. et al., 2007, “Surface Heat Flux and Pressure Distribution on a Hypersonic Blunt Body with DEAS”, Fifth International Symposium on Beamed Energy Propulsion, Vol. 997, pp. 367-37.
Salvador, I.I. et al., 2008, “Experimental Analysis of Heat Flux to a Blunt Body in Hypersonic Flow with Upstream Laser Energy Deposition”, Fifth International Symposium on Beamed Energy Propulsion, Vol. 997, pp. 379-389.
Tannehill, J.C. et al., 1997, “Computational luid mechanics and heat