Materials Research, Vol. 8, No. 3, 257-259, 2005 © 2005
*e-mail: [email protected]
The Characterization of Step Index Single Mode Silica
Fiber for Long Haul Signal Communication
Vivek Kudea, Rajendra Khairnarb*
a
Department of Applied Physics, MGM College of Engineering, Nanded-431605, India
b
School of Physical Sciences, Swami Ramanand Teerth Marathwada University,
Vishnupuri, Nanded 431606, India
Received: September 3, 2004; Revised: March 16, 2005
The optical properties of single mode fibers, which are drawn from the silica preform made by MCVD technique, have been studied. The properties such as cutoff wavelength, chromatic dispersion, and polarization mode dispersion (PMD) were studied for 2.3 km length of single mode fiber (SMF). The cutoff wavelength was measured by fiber optic test procedure (FOTP)-80 which was found to be 1179 nm. The chromatic dispersion was measured by FOTP-169 at various wavelengths, the zero dispersion being observed at 1503 nm. The PMD was measured by interferometric method, and exhibited the magnitude of 0.07 ps at 1550 nm. The results are discussed to assess the suitability of these fibers for long haul communication systems.
Keywords:optical fiber, cutoff wavelength, chromatic dispersion, polarization mode dispersion
1. Introduction
There is ever increasing demand for larger capacity of transmis-sion of signal through optical fiber. With advent of recent technique, large number of processes has been developed1,2 in characterization
of single mode fibers (SMF). Much stress is given to the fact that these fibers should have stable transmission characteristics in long lengths3,4 with maximum reproducibility. Therefore,
characteriza-tion of the fibers plays a crucial role for optical signal transmission, which is carried out mainly by observing attenuation using optical time domain reflectometer (OTDR), mode field diameter and core clad geometry5. Beside these factors, cutoff wavelength, chromatic
dispersion and polarization mode dispersion also play an important role to define the properties of single mode optical fiber. Previously numerous techniques6 have been reported for measurement of
cut-off wavelength. The measured effective cutcut-off wavelength7 differs
slightly from theoretical cutoff wavelength, calculated from the core diameter and refractive index profile. Chromatic dispersion factor is mainly applied for modern high bit rate transoceanic, terrestrial and telecommunication systems. In single mode fiber, chromatic dispersion results from the interplay of two effects viz; the material and waveguide dispersion. Different types of techniques are used for measuring chromatic dispersion such as phase shift method and differential phase shift method8. Polarization mode dispersion (PMD)
is one of the major limiting factors of ultrahigh bit rate optical fiber communication systems. Currently, PMD is a big concern while up-grading the installed fiber network to higher bit rate capacity of more
than 10 Gb/s, wherein the maximum acceptable amount3 of PMD
is 10 ps. This is one of the drawbacks for long link communication system, which degrades the signal eminence of SMF. PMD arises in fibers when the cylindrical symmetry is broken due to noncircular symmetric stress and it is the division of signal energy into orthogo-nal polarization modes with different speeds of propagation. PMD is considered as a bandwidth limiting factor. The various methods such as four wave mixing9, poincare sphere, polarimetric methods10
have been reported for measuring the PMD. In this paper we report the characterization of single mode silica fibers that were made by MCVD technique5 described by us previously. The optical properties
reported in this paper are useful in assessing the drawn fibers5 for
long haul communication systems.
2. Preform Fabrication and Fiber Drawing
Numerous techniques are developed for fabrication of glass fibers so as to get better optical properties suitable for optical com-munication, and also to combat with ever increasing demand of fiber in diverse application areas. First, preform fabrication5 was carried
out by means of conventional MCVD technique by using various dopants such as SiCl4, GeCl4, POCl3, and CCl2F2 (freon 12). After fabrication, this preform was subjected to fiber drawing process. The performance of optical fibers, specifically the transmission losses, bandwidth and strength, is strongly influenced by the fiber drawing and coating process. Fiber drawing proceeds5 by heating the tip of
the preform to a molten state and allowing it to extend under the force of gravity downward into a fine-diameter filament without the use of any die mechanism whereas pulling and winding mechanism sustains a drawing force. Then it immediately enters into the coating applicator. Polymer coating is applied concentrically in sufficient thickness and later solidified instantly using ultra-violet radiation curing technique.
3. Characterization
3.1. Cutoff wavelength
The cutoff wavelength is an important parameter for single mode fiber as it determines the wavelength range of its operation as a single mode. It is defined as
λc = [(2π)/V] (an1)√(2∆) (1)
where a is the radius of core, n1 is therefractive index of core, V is normalized frequency.
258 Kude & Khairnar Materials Research
fibers. However, for practical SMF, the cutoff wavelength is not a well defined wavelength as equation (1) suggests. Cutoff wavelength defines the borderline between the presence and the absence of the LP11 mode as the wavelength is varied. The measurement of this borderline depends on the power in the LP11 mode as it approaches the cutoff wavelength. However, its power is spread largely beyond the core and is easily lost due to even small imperfections in the fiber structure due to bends and microbends. Thus in practice, the LP11 mode ceases to exist in the fiber at substantially lower wavelength than actual λc.
3.2. Chromatic dispersion
The direct consequence of chromatic dispersion is that the re-fractive index of a medium is a function of wavelength. In a fiber, a pulse gets broadened due to the dispersion in silica medium, and this material dispersion changes drastically as the wavelength varies and in fact, it vanishes for a wavelength around 1.274 µm. However, material dispersion is not the only contribution to pulse broadening in a single mode fiber. Even if the refractive index is assumed constant over a range of wavelengths, the propagation constant (β) of the mode changes with wavelength contributing to pulse broadening. This contribution to dispersion is thus due to the waveguiding property of the fiber and hence, is termed as the waveguide dispersion. The total dispersion due to both the material and waveguide effects is called the chromatic dispersion. For a small refractive index change of 0.1 per-cent, the wavelength dispersion is 1 to 2 orders of magnitude smaller than the material dispersion. However, it should be noted that the two different dispersions are of different signs. Thus the dispersion as-sociated with the material of fabrication and the dispersion asas-sociated with the waveguide structure can be balanced near a zero dispersion wavelength where maximum data transmission is achieved.
3.3. Polarization mode dispersion
Polarization doesn’t matter in multimode fibers, but it can be important in single mode fibers. The reason is that single mode fibers actually carry two modes with orthogonal polarizations. From the waveguide theory, the two modes are degenerate, i.e., they are func-tionally identical, so light can shift easily between the two polarization modes. Polarizations have little practical impact for communication, if the circular symmetry of the fiber is perfect. However, the fiber symmetry is never absolutely perfect. In addition, the forces affecting the fiber are never applied symmetrically around the fiber. Due to this fact, the two polarization modes experience different travel conditions with slightly different speeds resulting in differential group delay.
4. Experimental
4.1. Cutoff wavelength
In experimental part, the cutoff wavelength was measured using bend reference technique described by fiber optic test procedure (FOTP)-80, on a 2 meter single mode fabricated silica fiber using the experimental setup viz; GN-Nettest Model 2200. Initially the fiber is bend in circular manner with a bend radius of 140 mm. The fiber having 140 mm bend radius gives the spectral output power Ps(λ) consisting of LP01 and LP11 mode. Without changing this arrange-ment, an additional loop of 30 mm was inserted so as to suppress LP11 mode, and the bending power Pb(λ) was measured. At this point cutoff wavelength (only LP01 mode) was detected by calculating the bend attenuation Ab(λ) using the following equation.
Ab(λ) = 10 log [Ps(λ)/ Pb(λ)] (2)
Figure 1 shows the power spectral plot for cutoff wavelength, which clearly signifies the cutoff wavelength of 1179 nm.
4.2. Chromatic dispersion
The chromatic dispersion was measured by phase shift method (GN Nettest Model S-18). The test fiber was linked between source and detector. The tunable edge emitting LED source (1270 nm – 1625 nm) was used which modulates high frequency. The modulation frequency was supplied to LED and then directly to a reference of the receiver circuit using a coupler. The source was placed in a controlled temperature. The precise control of temperature is necessary because the value of the λ0 is temperature dependent. The detected optical signal was amplified by low noise amplifier. This signal was applied to phase comparator where it compares with reference signal and gives the corresponding phase change. The dispersion measurement was performed by recording the phase from phase comparator while tuning the LED over the wavelength region of interest. Each data point consists of wavelength value and its corresponding phase. The group delay of the fiber is measured using the calculation of phase delay changes with wavelength according to equation (3). The wavelength at which zero phase difference was observed is considered as zero dispersion wavelength. Figure 2 shows the dispersion plot and the slope S0 of single mode optical fiber is obtained by the three term sellimeir expression. The measured zero chromatic dispersion was
5
4
3
2
1
0
- 1
0.80 1.00 1.20 1.40
Wavelenght ( m)
dB
Figure 1. The power spectral cutoff plot using bend reference technique.
1210 1304 1398 1492 1586 1680
15.00
6.00
0.00
- 3.00
- 12.00
- 21.00
- 30.00
Dispersion (ps/nm/km)
Wavelenght (nm)
Vol. 8, No 3, 2005 The Characterization of Step Index Single Mode Silica Fiber for Long Haul Signal Communication 259
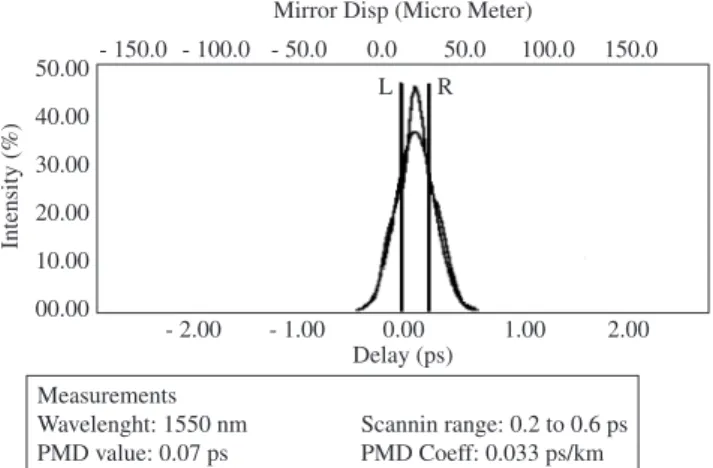
of the central and either of the outer peaks L and R, is the differential group delay of the device. PMD in relation to the coherence time of the source was noted as 0.07 ps at 1550 nm.
5. Conclusions
The fabricated single mode fiber is characterized for cutoff wavelength, chromatic dispersion, and PMD. The cutoff wavelength for fabricated single mode fiber is 1179 nm. The zero chromatic dispersion wavelength is 1503 nm and the slope S0 at 1550 nm is 0.08 ps/nm2 km, where as polarization mode dispersion is found
to be 0.07 ps at 1550 nm. These parameters show the suitability of fabricated fibers for long haul signal communication network with very high bit rate.
Acknowledgments
The authors are thankful to Prof. (Dr) D. B. Yedekar, SRTM University, Nanded for constant encouragement. One of the authors (V P K) gratefully acknowledges Sterlite Optical Technology Ltd., Aurangabad,(M.S.), India, for providing experimental facilities.
References
1. Chen X, Li M, Nolan DA. Polarization mode dispersion of spun fibers: an analytical solution. Optics Letters. 2000; 27(5): 294-296.
2. Heffner BL, Hernday R. Measurement of polarization-mode dispersion.
Journal of Hewlett-packard. 1995; 46(1): 27-33.
3. Allen C, Kondamuri PK, Richards DL, Hague DC. Analysis and compari-son of measured DGD data on buried single mode fibers. In: Williams P A, Day G W, editors. 12th Biennial symposium on optical fiber measure-ments; 2002 Sept 24-26; Boulder, CO, USA; NIST Special publication 988; 2002. p. 195-198.
4. Allen C, Kondamuri PK, Richards DL, Hague DC. Measured temporal and spectral PMD characteristics and their implications for network-level mitigation approaches. Journal of Lightwave Technology. 2003; 21(1): 79-86.
5. Kude VP, Khairnar RS, Fabrication of silicon based glass fibers for optical communication. Bulletin of Materials Science. 2004; 27(1): 73-77. 6. Allard FC, editor. Fiber optics handbook for engineers and scientist. New
York; McGraw Hill Publishing Company; 1990. p. 4.1.
7. Frazen DL. Determining the effective cutoff wavelength of single-mode fibers: an interlaboratary comparison. Journal of Lightwave Technology. 1985; 3(1): 128-134.
8. Mechels SE, Schlager JB, Franzen DL. Accurate measurements of the zero dispersion wavelength in optical fibers. Journal of research of the National Institute of Standards and Technology. 1997; 103(3): 333-347. 9. Song S, Allen CT, Kenneth R, Demarest KR. A novel method for
meas-uring polarization mode dispersion using four-wave mixing. Journal of Lightwave Technology. 1999; 17(12): 2530-2534.
10. Song S, Allen CT, Kenneth R, Demarest KR. A poincare sphere method for measuring polarization mode dispersion using four wave mixing (FWM) in single model optical fiber. In: Williams P A, Day G W, editors. 12th Biennial symposium on optical fiber measurements; 2002 Sept 24-26; Boulder, CO, USA; NIST Special publication 988; 2002. p. 79-82.
11. Obserson P. Juliard K. Gisin N. Passy R. Weid J. Interferometric polariza-tion mode dispersion measurement with femtoseconds sensitivity. Journal of Lightwave Technology. 1997; 15(10): 1852-1857.
50.00
40.00
30.00
20.00
10.00
00.00
Intensity (%)
- 2.00 - 1.00 0.00 1.00 2.00
- 150.0 - 100.0 - 50.0 0.0 50.0 100.0 150.0 Mirror Disp (Micro Meter)
Measurements
Wavelenght: 1550 nm Scannin range: 0.2 to 0.6 ps PMD value: 0.07 ps PMD Coeff: 0.033 ps/km
Delay (ps)
L R
Figure 3. The differential group delay in PMD using interferometric method.
observed at 1503 nm. In addition, the slope S0 obtained at 1550 nm is 0.08 ps/nm2 km.
T(λ) = T(λ0) + [λ-(λ02 /λ)]2 (S
0 / 8) (3)
Here T(λ0) is the relative group delay minimum at zero dispersion wavelengths, S0 is the zero dispersion slope, and λ0 is the wavelength at which the chromatic dispersion value goes to zero.
4.3. Polarization mode dispersion
The PMD was measured using interferometric method2,11. In