Luís Filipe Almeida Baltazar
Comparing different methods to measure
biofilm thickness. The techniques are:
Optical Coherence Tomography, Confocal
Laser Scanning Microscopy and Low Load
Compression Test
Outubro de 2015
Universidade do Minho
Escola de Engenharia
Luís Filipe Almeida Baltazar
Comparing different methods to measure
biofilm thickness. The techniques are:
Optical Coherence Tomography, Confocal
Laser Scanning Microscopy and Low Load
Compression Test
Dissertação de Mestrado
Mestrado Integrado em Engenharia Biomédica
Ramo em Engenharia Clínica
Trabalho realizado sob a orientação da
Professora Doutora Lígia Marona Rodrigues
Universidade do Minho
e da
Professora Doutora Henny C. van der Mei
University Medical Center Groningen
Outubro de 2015
Universidade do Minho
Escola de Engenharia
Nome: Luís Filipe Almeida Baltazar
Endereço Electrónico: [email protected] Telefone: +351 917860342 Número do Cartão de Cidadão: 13498895
Título da Dissertação: Comparing different methods to measure biofilm thickness. The
techniques are: Optical Coherence Tomography, Confocal Laser Scanning Microscopy and Low Load Compression Test
Orientador: Professora Doutora Lígia Marona Rodrigues e Professora Doutora Henny C. van der Mei
Ano de Conclusão: 2015
Designação do Mestrado: Mestrado Integrado em Engenharia Biomédica Área de Especialização: Engenharia Clínica
Escola: de Engenharia
Departamento: de Engenharia Biológica
DE ACORDO COM A LEGISLAÇÃO EM VIGOR, NÃO É PERMITIDA A REPRODUÇÃO DE QUALQUER PARTE DESTA DISSERTAÇÃO
Universidade do Minho, ___ /___ /______
iii
ACKNOWLEDGEMENTS
Though this work is a personal accomplishment it only could be done with the help, encouragement and guidelines of many others. I take this opportunity to extend my gratitude to the people who have been instrumental in the successful completion of this project.
First of all, I would like to thank Prof. Dr Henk Busscher and Prof. Dr. Henny van der Mei for the opportunity to develop my experimental work at the Biomedical Engineering Department (BME) of University Medical Centre of Groningen (the Netherlands). To Prof. Dr. Henny van der Mei I would like to thank for providing me intellectual stimulus, constant challenges, wise advices during all the process and for help me to deal with the frustration when experiments do not go as we expected.
I also would like to thank Prof. Dr. Lígia Rodrigues for all the support, dedication and advices that she gave me during the writing of my thesis, they were essential to the conclusion of this project.
A special thanks to Gésinda and Jelly for teaching me how to work with the techniques and for all the assistance and teachings in the laboratory. Also a special thanks to Willem for being always available to help when I had questions and problems in the laboratory.
I also would like to say thanks to all the people that work in the BME who were always very kind and friendly, which made this experience much easier.
A special thanks to the good friends that I made in Groningen, they were essential for such a nice stay and of course a special thanks to Carolina and Susana, whose friendship and support help me a lot in this experience abroad.
Last, but not least, I thank to my family, my support in life! Thanks for the unconditional love and for being always present when I most need.
v
ABSTRACT
Biofilm formation remains a serious concern in industry and in the medical field. They are responsible for huge economical losses in many industrial sectors and for serious infections associated with biomaterial implants and medical devices. These infections are hard to treat because bacteria within the biofilm are more resistant to antibiotics and to the host immune system. Therefore, studying biofilm properties and mechanisms is of utmost relevance to develop efficient approaches to deal with this drawback.
Biofilm thickness is an important parameter in biofilm characterization. The main purpose of this thesis was to assess the suitability of Optical Coherence Tomography (OCT) to measure biofilm thickness by comparing the results with the values obtained with the Low Load Compression Test (LLCT) and Confocal Laser Scanning Microscopy (CLSM). OCT is a non-destructive technique, which is increasingly applied on the medical field and allows the acquisition of images in real-time, in situ and with high resolution. Biofilms were grown onto glass slides and the measurements were done in the following order: first OCT, since it is a non-destructive technique, second LLCT and last CLSM. In order to study if slime could influence the measurements, different strains and bacteria exhibiting distinct extracellular polymeric substance (EPS) production capacities were used. Staphylococcus aureus ATCC 12600 is an EPS producer, while Staphylococcus aureus 5298 is not and Streptococcus mutans use extracellular glucans in the presence of sucrose to build its protective matrix, so different treatments with different percentages of sucrose were used in the growth medium during biofilm development. The results obtained proved that OCT is suitable to measure biofilm thicknesses and the presence of slime does not influence the results. In contrast, LLCT measurements showed to be affected by slime and biofilm density. CLSM showed limitations relatively to stain and laser penetration. Additionally, the results obtained emphasize the potential applicability of OCT to investigate the mesoscopic structure of the biofilm.
vii
RESUMO
A formação de biofilmes é um problema sério na industria e na área médica, sendo responsáveis por enormes prejuízos económicos em muitos sectores industriais e por sérias infeções associadas a implantes e dispositivos médicos. Estas infeções são difíceis de tratar, visto que as bactérias quando presentes no biofilme ganham maior resistência a antibióticos e ao sistema imunitário. Por este motivo, estudar as propriedades e mecanismos dos biofilmes é de extrema importância para conseguir desenvolver abordagens eficazes que permitam ultrapassar estes problemas.
A espessura dos biofilmes é um parâmetro importante para a sua caracterização. O principal objectivo desta tese foi avaliar a adequação do OCT para medir a espessura dos biofilmes, comparando os resultados com os valores medidos com o LLCT e CLSM. O OCT é uma técnica não destrutiva que tem sido utilizada na área da medicina e permite a aquisição de imagens em tempo real, in-situ e com elevada resolução. Os Biofilmes cresceram em lâminas de vidro e as medições foram feitas na seguinte ordem: primeiro OCT, visto ser uma técnica não destrutiva, seguido do LLCT e por fim o CLSM. Neste trabalho também foi estudado se a presença de EPS pode influenciar as medições em alguma destas técnicas. Para isso foram utilizadas diferentes bactérias e estirpes com capacidades distintas de produção de matrizes extracelulares. A Staphylococcus aureus ATCC 12600 tem capacidade de produzir EPS naturalmente, ao contrário da Staphylococcus aureus 5298. Por outro lado a Streptococcus mutans usa glucanos extracelulares para construir a sua matriz extracelular quando o meio de crescimento possui sacarose. Deste modo foram utilizadas diferentes percentagens deste glícido com o objectivo de obter diferentes tipos de matrizes. Os resultados obtidos provam que o OCT é uma técnica que pode ser usada para medir a espessura de biofilmes. Por outro lado as medições obtidas pelo LLCT são afectadas pela matriz extracelular dos biofilmes e pela sua densidade. O CLSM mostrou limitações relativas a capacidade de penetração do laser e dos corantes. Adicionalmente os resultados obtidos sublinham o potencial do OCT para estudar a estrutura do biofilme ao nível da mesoescala.
TABLE OF CONTENTS
ACKNOWLEDGEMENTS iii ABSTRACT v RESUMO vii LIST OF FIGURES xiLIST OF TABLES xiii
ABBREVIATIONS xv
SCOPE AND AIMS xvii
CHAPTER 1-GENERAL INTRODUCTION
1.1. Biofilm formation and development 3
1.1.1. Biofilm structure and function 4
1.1.2. Biofilm development 7
1.2. Importance and impact of biofilms in industry and on the medical Field 9
1.3. Methods to study biofilms 13
1.3.1. Optical coherence tomography 13
1.3.2. Low Load Compression Test 14
1.3.3. Confocal Laser Scanning Microscopy 16
CHAPTER 2 - MATERIAL AND METHODS
2.1. Bacterial strains, growth conditions and quantification 21
2.2. Glass slides preparation and coating 22
2.3. Biofilm formation 22
2.4. Measurements of biofilm thickness 23
2.4.1. OCT measurements 23 2.4.2. LLCT measurements 23 2.4.3. CLSM measurements 24 2.5. Statistically analysis 24 CHAPTER 3 - RESULTS 3.1. OCT measurements 27 3.2. LLCT measurements 30 3.3. CLSM measurements 32
3.4. Biofilm thickness measured with OCT, LLCT and CLSM 34
CHAPTER 4 - DISCUSSION 37
CHAPTER 5 - CONCLUSIONS AND RECOMMENDATIONS 43
xi
LIST OF FIGURES
C
HAPTER1
Figure 1.1 Schematic representation of the steps involved in biofilm formation. Taken from [20]. ... 7 Figure 1.2 Techniques used to study the biofilm structure at different scales. The resolution decreases from left to right whereas the field of view increases. Mesoscopic structures (dimension in millimeters range) filled the gap between microscale and macroscale. SEM, Scanning Electron Microscopy; CLSM, Confocal Laser Scanning Microscopy; OCT, Optical Coherence Tomography. Taken from [6].. ... 14 Figure 1.3 Frontal view of the LLCT illustrating the main components of the system. ... 15
C
HAPTER3
Figure 3.1 Optical coherence tomography (OCT) images showing a vertical section of 48 h biofilms that grown under steady conditions. (a) Staphylococcus aureus ATCC 12600 biofilm. Scale bar = 25µm. (b) Staphylococcus aureus 5298 biofilm. Scale bar = 25µm. (c) Streptococcus mutans ATCC 25175 biofilm grown with 3% sucrose. Scale bar = 50µm. (d) Streptococcus mutans ATCC 25175 biofilm grown with 1.8% sucrose. Scale bar = 50µm. (e) Streptococcus mutans ATCC 25175 biofilm grown with 0.6% sucrose. Scale bar = 50µm. .... 28 Figure 3.2 Optical coherence tomography (OCT) 3D images of 48 h biofilms grown under static conditions. (a) Staphylococcus aureus ATCC 12600 biofilm. (b) Staphylococcus aureus 5298 biofilm. (c) Streptococcus mutans ATCC 25175 biofilm grown with 3% sucrose. (d) Streptococcus mutans ATCC 25175 biofilm grown with 1.8% sucrose. (e) Streptococcus mutans ATCC 25175 biofilm grown 0.6% sucrose. Units of axes are in mm. ... 29 Figure 3.3 Thickness of Staphylococcus aureus ATCC 12600 and Staphylococcus aureus 5298 biofilms measured with LLCT with a touch load of 0.01g and 0.005g. Data represent mean ± standard error (n=5 for S. aurerus ATCC 12600 with touch load of 0.01g; n=4 for S. aureus ATCC 12600 with touch load of 0.005g; n=4 for S. aureus 5298 with touch load 0.01g and 0.005g). ... 30
xii
Figure 3.4 Representative Confocal Laser Scanning Microscopy (CLSM) images of 48 h biofilms grown under static conditions. Scale bars = 50µm. (a) Staphylococcus aureus ATCC 12600 biofilm. (b) Staphylococcus aureus 5298 biofilm. (c) Streptococcus mutans ATCC 25175 biofilm grown with 3 % sucrose. (d) Streptococcus mutans ATCC 25175 biofilm grown with 1.8 % sucrose. (e) Streptococcus mutans ATCC 25175 biofilm grown with 0.6 % sucrose. Biofilms were stained with LIVE/ DEAD BacLight viability stain and Calcfluor White. The green colour represents live bacteria, red dead bacteria and blue represents the slime in the biofilm. ... 33 Figure 3.5 Thicknesses of bacterial biofilms measured with OCT, LLCT and CLSM for bacterial strains Staphylococcus aureus ATCC 12600 and Staphylococcus aureus 5298. Data represent mean ± standard error (OCT: n=7 for S. aurerus ATCC 12600 and S. aureus 5298; LLCT: n=5 for S. aurerus ATCC 12600 with touch load of 0.01g; n=4 for S. aureus ATCC 12600 with touch load of 0.005g; n=4 for S. aureus 5298 with touch load 0.01g and 0.005g; CLSM: n=5 S. aurerus ATCC 12600 and n=3 for S. aureus 5298). ... 35 Figure 3.6 Thicknesses of bacterial biofilms measured with OCT, LLCT and CLSM for bacterial strains Streptococcus mutans ATCC 25175 biofilm grown with different percentages of sucrose. Data represent mean ± standard error (OCT: n=7 for S. mutans ATCC 25175 for all treatments; LLCT: n=5 for S. mutans ATCC 25175 3% sucrose with touch load of 0.01g; n=4 for S. mutans ATCC 25175 3% sucrose with touch load of 0.005g; n=5 for S. mutans ATCC 25175 1.8% sucrose with touch load 0.01g; n=3 for S. mutans ATCC 25175 1.8% sucrose with touch load 0.005g; n=6 for S. mutans ATCC 25175 0.6% sucrose with touch load 0.01g; n=3 for S. mutans ATCC 25175 0.6% sucrose with touch load 0.005g; CLSM: n=3 for all concentrations of sucrose). ... 35
xiii
LIST OF TABLES
C
HAPTER1
Table 1.1 Functions of EPS, their relevance in biofilms and the components involved. Taken from [5]. ... 5 Table 1.2 Microorganisms most commonly isolated from infection sites on different medical devices. Taken from [21]. ... 11 Table 1.3 Advantages and disadvantages of the techniques used in the current study to analyse biofilms. ... 17
C
HAPTER2
Table 2.1 Bacterial strains and growth media used and different growth conditions. ... 21
C
HAPTER3
Table 3.1 Average thicknesses of several biofilms measured by Optical Coherence Tomography. ... 27 Table 3.2 Average thicknesses of Streptococcus mutans ATCC 25175 biofilms with the different growth conditions used measured with the Low Load Compression Test technique with the touch loads of 0.01g and 0.005g. ... 31 Table 3.3 Average thicknesses of biofilms of all bacteria used in this study measured with the Confocal Laser Scanning Microscopy technique. ... 32
xv
ABBREVIATIONS
OCT Optical Coherence Tomography
LLCT Low Load Compression Test
CLSM Confocal Laser Scanning Microscopy BAI Biomaterial Associated Infections EPS Extracellular Polymeric Substances
DMSO Dimethylsulphoxide
TSB Tryptic Soy Broth
xvii
SCOPE AND AIMS
Nowadays, given the technological development there are a number of new opportunities favouring microbial colonization and subsequent biofilm formation in many industrial and medical sectors. Current medical care is highly dependent of biomaterial implants and medical devices, thus providing surfaces and preferential sites for bacterial adhesion followed by biofilm formation, which results in infections, normally difficult to treat with high costs, both economical and for the patient quality of life. Additionally, in industry the biofilms can also have a negative impact. In food industry, with bigger and complex facilities, the niches for microorganism’s colonization increased, being the water systems and heat exchangers critical spots in this matter. Despite all advances in science and technology there is still a long way to go for the development of efficient strategies to stop and prevent the formation of biofilms.
The main purpose of this thesis was to assess the suitability of OCT for evaluating biofilms thickness. OCT is a technique derived from the medical field and its use in biofilm science is still relatively recent. The results obtained with this technique will be compared with the values measured with LLCT and CLSM, which are techniques that have been commonly used for this purpose, especially CLSM that is considered a novel technique to study biofilms. Additionally, it will also be studied if slime can influence the measurements using any of these techniques. The knowledge of the biofilm thickness is important for the calculation of diffusion rates of antimicrobials or nutrients through the biofilm, as well as for the evaluation of mechanical properties, which will help discovering and developing better approaches to prevent biofilm formation. In this work, the capacity of OCT to analyse the structure of biofilm will also be evaluated, as well as limitations and advantages of all the techniques used.
C
HAPTER
1
G
ENERAL
I
NTRODUCTION
CHAPTER 1 - GENERAL INTRODUCTION
3
1.1. Biofilm formation and development
Biofilm science is a technical discipline that involves the collaboration between scientists from multidisciplinary fields given that the study and evaluation of biofilms covers the development of new analytical tools in experimental and computer science fields. The use of a variety of microscopy and physical methods in combination with new chemical and molecular biology approaches led to a better understanding about the complexity of microbial biofilms [1].
In the 17th century, Antonie van Leeuwenhoek commented in a report to the Royal Society
of London “that the vinegar, with which I wash my teeth, killed only those Animals which were on the outside of the scurf, but did not pass through the whole substance of it”. This was the first report on the existence of biofilms in nature and it was also the first observation that it is difficult to penetrate biofilms with antimicrobial agents [2]. In 1943, the marine microbiologist Claude Zobell documented the formation of biofilms. He discovered that the number of free-living microorganisms in fresh sea water decreased when the water was kept in a glass bottle, while the number of attached microorganisms to the bottle walls increased [3]. Other studies revealed that the adhesion effect was more pronounced in a medium with lack of nutrients compared with other nutrient-enriched medium, suggesting that adhesion is a strategy of the microorganisms to survive in hostile environments [4]. However, it took more than 30 years after this report and the work from Costerton and collaborators (1978) to be generally accepted that the majority of microorganisms live attached to surfaces within a structured biofilm ecosystem, instead of living as pure cultures of disperse single cells [3,5].
Biofilms can be defined as communities of microorganisms that live attached to surfaces and house themselves in a matrix of extracellular polymeric substances (EPS) [6]. This structure confers a lot of advantages to the microbial community, i.e. the biofilm. Among these advantages, the environmental protection, better nutrient availability and metabolic cooperativity can be highlighted. Biofilms are also known for their capacity to increase the resistance of microorganisms against chemical and natural antibacterial substances, and environmental bacteriophages. This occurs because biofilms act as a barrier, limiting the antimicrobial agent penetration and also because cells are embedded in a polymeric matrix that provides an ideal niche for the transfer of mobile genetic elements, that might encode
CHAPTER 1 - GENERAL INTRODUCTION
4
traits, such as resistance to antibiotics. Altogether, these factors explain the ubiquity of biofilms in nature and also why the majority of microorganisms do not live in planktonic phase [7–9].
1.1.1. Biofilm structure and function
Nowadays, it is well-recognised that biofilms have a heterogeneous structure organized in communities containing microcolonies of microorganisms from different species or single-species that are encased in an EPS matrix. These microcolonies are connected by water channels and voids that are responsible for the transport of nutrients, oxygen, genes and antimicrobial agents [10].
In a first stage, microorganisms adhere to the surface and begin to grow relatively quickly forming a microcolony that continues to grow in volume. Cells in the proximity of the surface have difficulties in gaining access to nutrients from the external environment. Additionally, those located in upper layers have easier access and therefore, are able to multiply continuously [11]. This situation gives metabolic differences within the biofilm population. A logical assumption is that biofilms are dynamic structures where cells can grow at different rates and where there are gradients of nutrients, waste products and signalling factors [9, 12]. In most biofilms, the microorganisms represent 10% of the dry mass and the remaining 90% is water and EPS, mostly produced by microorganisms [5]. The EPS forms the scaffold for the three-dimensional architecture of the biofilm and enhances the adhesion to the surface and cohesion in the biofilm [13-14]. In table 1.1 are summarized some main functions of this matrix, as well as its relevance for biofilms and the EPS components involved, according to the general knowledge in this field to date.
CHAPTER 1 - GENERAL INTRODUCTION
5 Table 1.1 Functions of EPS, their relevance in biofilms and the components involved. Taken from [5].
Function Relevance for biofilms EPS components
involved Adhesion
Allows the initial steps in the colonization of surfaces by planktonic cells and enhances the attachment of the whole biofilm to surfaces
Polysaccharides, proteins, DNA and amphiphilic
molecules Aggregation of bacterial cells Enables bridging between cells, the development of
high cell densities and cell-cell recognition
Polysaccharides, proteins and DNA Cohesion of biofilms
Forms a hydrated polymer network, mediating the mechanical stability of biofilms, determining biofilm architecture and cell-cell communication
Neutral and charged polysaccharides, proteins,
and DNA Retention of water
Maintains a highly hydrated microenvironment around biofilm organisms, leading to their tolerance of desiccation in water- deficient environments
Hydrophilic polysaccharides and possibly, proteins Protective barrier
Confers resistance to nonspecific and specific host defences during infection and confers tolerance to various antimicrobial agents
Polysaccharides and proteins Sorption of organic compounds
Allows the accumulation of nutrients from the environment and the sorption of xenobiotics (thus contributing to environmental detoxification)
Charged or hydrophobic polysaccharides and
proteins Sorption of inorganic ions
Promotes polysaccharide gel formation, ion exchange, mineral formation and the accumulation of toxic metal ions (thus contributing to
environmental detoxification)
Charged polysaccharides and proteins
Enzymatic activity
Enables the digestion of exogenous
macromolecules for nutrient acquisition and the degradation of structural EPS, allowing the release of cells from biofilms
Proteins
Nutrient source
Provides a source of carbon, nitrogen and
phosphorus containing compounds for utilization by the biofilm community
Potentially all EPS components Exchange of genetic information Facilitates horizontal gene transfer between biofilm
cells DNA
Export of cell components Releases cellular material as a result of metabolic turnover
Membrane vesicles containing nucleic acids,
enzymes, lipopolysaccharides and phospholipids
CHAPTER 1 - GENERAL INTRODUCTION
6
As mentioned, EPS is a complex mixture of polysaccharides, proteins, glycoproteins, glycolipids, DNA, and humic acid substances and, although the precise interactions of all these components and their contribution to matrix integrity are not completely understood, [15-16] it is known that the EPS content of a biofilm can change as a result of several environmental factors, such as high levels of oxygen, limited availability of nitrogen, desiccation, low temperature, low pH and nutrient deprivation [17].
The cells within the biofilm are surrounded and immobilized by EPS allowing them to be in close proximity in order to communicate with each other and develop a synergistic microconsortia [12,18]. The presence of extracellular enzymes in the EPS promotes an “external digestive system”. The dissolved nutrients in the water phase are degraded by these enzymes, enabling their use as energy sources by the organisms in the biofilm [5].
EPS influence the biofilm architecture. The structure of biofilms depends on the concentration, cohesion, charge, sorption capacity, specificity and nature of the individual components of the EPS matrix. Additionally, it also depends on the three-dimensional architecture of the matrix (the dense areas, pores and channels). These factors can be translated in different biofilm morphologies that can result in smooth and flat, rough, fluffy or filamentous biofilms and can also affect the degree of porosity and the formation of mushroom-like structures [5-19].
Briefly, it is possible to say that a biofilm is a dynamic complex system largely because of the EPS that enables the cells to function similarly to multicellular organisms.
CHAPTER 1 - GENERAL INTRODUCTION
7
1.1.2. Biofilm development
The development of a biofilm is a dynamic process of growth and detachment of bacterial cells and aggregates characterized by a series of well-regulated events (Figure 1.1.), namely (1.) Pre-conditioning of the adhesion surface; (2.) Transport of planktonic cells; (3.) Adsorption of cells at the surface; (4.) Desorption of reversibly adsorbed cells; (5.) Irreversible adsorption of bacterial cells at a surface; (6.) Production of cell-cell signalling molecules; (7.) Transport of substrates to and within the biofilm; (8.) Substrate metabolism by biofilm-bound cells and transport of products out of the biofilm. In this process, the maturation of biofilm with cell growth, replication and EPS production is also visible; and (9.) Biofilm removal by detachment or sloughing [20].
Figure 1.1 Schematic representation of the steps involved in biofilm formation. Taken from [20].
Before bacterial adhesion, a conditioning film containing adsorbed macromolecular organic components, such as proteins and organic molecules, coats the substratum surface [10,20,21]. These molecules can facilitate the adhesion of microorganisms (bacteria are the first microorganisms adhering onto a surface) to the surfaces since adhesion is mediated by generic physicochemical interaction forces, as well as by specific interaction forces between cell surface structures and molecular groups of the substratum surface [2,22]. Other factors can influence adhesion of microorganisms such as roughness and hydrophobicity of the surfaces and hydrodynamics and properties of aqueous medium. It is known that rougher and hydrophobic surfaces promote cell adhesion, as well as an increase in flow velocity, water
CHAPTER 1 - GENERAL INTRODUCTION
8
temperature or nutrient concentration. The presence of fimbriae and flagella can also promote cell-adhesion. In this phase, the contact between bacterial cells and the substratum is characterized by weak interactions, therefore the adhesion can be reversible and some microbial cells can easily be removed by fluid shear forces and return to the planktonic state [20,23,24,25,26,27]. After the initial adhesion, the attached microorganisms start to produce EPS, which allows the development of cell-to-cell bridges that, in turn, cement the biofilm and lead to a strong irreversible attachment to the surface [21]. The irreversible adhered bacterial cells grow and divide, forming microcolonies that are considered to be the basic organizational units of a biofilm. Other planktonic bacteria are anchored due to the development of EPS resulting in a multi-layered mature biofilm [24]. The last step is the detachment of individual bacteria or aggregates and it is crucial to the dissemination of an infection and to the contamination in both clinical and public health settings [28-29]. It can be distinguished into three different physical mechanisms: sloughing, erosion and abrasion. Sloughing is apparently random loss of large pieces of biofilm. Erosion refers to the continuous loss of single cells or small cell clumps due to physical forces or cell cycle mediated events. Abrasion is the removal of biofilm due to the collision of particles on the biofilm surface [30]. Recent studies have suggested that the detachment is an active process that is highly regulated by the attached cell populations as a proactive defence strategy against the lack of space and nutrients [31].
CHAPTER 1 - GENERAL INTRODUCTION
9
1.2. Importance and impact of biofilms in industry and in the
medical field
This section intends to demonstrate the impact of biofilms in the economy and human life. With the technological development, human interference in nature and change in living conditions, new opportunities have been created for the colonization and growth of microorganisms and subsequent formation of biofilms [32]. For instance, biomaterial implants and medical devices are indispensable to current medical practices and are highly susceptible to contamination [33]. Additionally, in the food industry processing equipment, cooling water towers and heat exchangers are niches that allow the colonization of microorganisms and formation of biofilms, which can cause the loss of efficiency of these systems [3,34,35]. Hence, biofilms are often considered problematic from a human perspective.
In industry, biofilms generally have a negative economic impact. For example in the food processing environments, bacteria can attach on contact surfaces and contaminate food, resulting in serious hygienic and safety problems and economic losses [36]. In other industrial processes, biofilms can be responsible for energy losses in heat transfer equipment, blockages in flow systems and microbial induced corrosion. For instance, on ships, biofilms are responsible for an increase in the surface roughness of the hull which, in turn, causes increased frictional resistance and fuel consumption and decreased top speed and range [35,37,38,39]. Clearly, the economic losses associated with biofilm formation in industrial systems are huge. Azis and collaborators refer that is it estimated that the marine industry have associated costs of 10 billion pounds a year to eliminate the problems arising from biofilm formation [38]. In addition, Mueller-Steinhagen et al., indicate that the costs related with the general fouling (including biofilm formation) in heat exchangers represent 0.25% of the Gross Domestic Product in industrialized countries [40]. Another important example of the negative impact of biofilms is in the drinking water distribution systems. The formation of biofilms leads to a decrease of water velocity and carrying capacity, due to the blockage of the distribution pipes, resulting in an increase of energy utilization and decrease of the process efficiency. The development of biofilms in distribution water pipes is mainly because of the existence of residual nutrients in the water and the inefficiency of the disinfectants used in water treatment [35]. Nowadays, it has been given special attention to hot water distribution
CHAPTER 1 - GENERAL INTRODUCTION
10
systems and cooling towers because in addition to providing enabling favourable environment for the growth of biofilms [41-43], these systems produce aerosols that can be a transmission path of harmful microorganisms, such as Legionella pneumophila, which is an opportunistic waterborne germ responsible for the Legionnaires’ disease, a common life-threatening atypical pneumonia in humans [44-46]. In some particular cases, biofilms can be beneficial. For instance, mixed-species biofilms are used in wastewater treatment plants for the removal of organics and heavy metals. Also, in lakes or rivers, the maintenance of water quality is assured by biofilms, since the bacteria present in the biofilm biodegrade many toxic compounds. Biofilms are also used in biochemical production, for instance of biofungicides, in pharmaceutical, fine chemicals and food fermentation industries [47-50].
On the medical field, biofilms have a critical role because they are the source of persistent infections that can be up to 1000-fold more resistant to antibiotic treatment than bacteria grown planktonically [12]. With the technological developments in medicine and long life expectations, the use of implants such as joint prostheses, heart valves, catheters, vascular graphs, contact lenses, pacemakers and voice prostheses are central to the current medical practices, being used by millions of people worldwide [33,51]. Although these devices are intended to give people a better quality of life and a longer survival perspectives, they are also highly susceptible to microbial colonization and biofilm formation, thus leading often to the occurrence of biomaterial associated infections (BAI) which is a actual threat in modern health care [51-52]. Biofilms are also associated to chronic infections occurring on native tissues, such as lung infections in cystic fibrosis patients [53]. Overall, it is thought that up to 60% of nosocomial infections are due to biofilms. These biofilm-based infections have a high economic impact in health care institutions and also lead to a high rate of associated mortality. Also, they can increase hospital stays by 2 to 3 days with an associated cost upwards to 1 billion dollars per year [9,32,54]. Meng et al. refer that each year about 250000-500000 primary blood-stream infections occur among the 150 million intravascular devices implanted in the US and the treatment can increase from $4000 to $56000 for each infection [55]. Microorganisms commonly responsible for biofilm formation on indwelling medical devices include yeasts (Candida species), gram-positive (Enterococcus faecalis, Staphylococcus aureus, Staphylococcus epidermidis, Streptococcus viridans) and gram-negative (Escherichia coli, Klebsiella pneumonia, Proteus mirabilis, Pseudomonas aeruginosa) bacteria (Table 1.2) [21].
CHAPTER 1 - GENERAL INTRODUCTION
11 Table 1.2 Microorganisms most commonly isolated from infection sites on different medical devices. Taken from [21].
Indwelling medical devices Organisms
Central venous catheter Coagulase-negative staphylococci, Staphylococcus aureus, Enterococcus faecalis, Klebsiella pneumonia, Pseudomonas aeruginosa, Candida albicans
Prosthetic heart valve Streptococcus viridans, coagulase-negative staphylococci, enterococci, Staphylococcus aureus
Urinary catheter Staphylococcus epidermidis, Escherichia coli, Klebsiella pneumonia, Enterococcus faecallis, Proteus mirabilis
Artificial hip prosthesis
Coagulase-negative staphylococci, β- hemolytic streptococci, enterococci, Proteus mirabilis, Bacterioides species, Staphylococcus aureus, Streptococcus viridans, Escherichia coli, Pseudomonas aeruginosa
Artificial voice prosthesis
Candida albicans, Candida tropicalis, Streptococcus mitis, Streptococcus salivarius, Rothia dentrocariosa, Streptococcus sobrinus, Staphylococcus epidermis, Stomatococcus mucilaginous
Intrauterine device
Staphylococcus epidermidis, Corynebacterium species, Staphylococcus aureus, Micrococcus species, Lactobacillus plantarum, group B streptococci, Enterococcus species, Candida albicans
The incidence of infections depends on the probability of a given microorganism to reach the biomaterial surface and this is related with the type of implant and the surface characteristics. Urinary catheters are placed in an environment rich in microorganisms and organic fluids, therefore the risk of infection is higher (100% after 3 weeks) than for instance for a hip prostheses implant (4%) [56]. There are many ways by which microorganisms can contact the biomaterials surface. The most common is by direct contact during its insertion with microorganisms that are present in the operating theatre or with microorganisms that are present on the skin (commensal microflora) [57-58]. Since the contamination of implants starts when microorganisms are able to reach the surface and adhere to it, understanding microbial adhesion and infection mechanisms, as well as developing coatings able to prevent microbial colonization are crucial processes that ultimately lead to the prevention of BAIs [51]. Nonetheless, the progress in improving biomaterial surfaces and the design of new coatings
CHAPTER 1 - GENERAL INTRODUCTION
12
has shown limited success. The development of strategies that block the production of EPS are also critical to combat biofilms, since it enables microorganisms to evade antibiotics and host immune responses, giving them the ability to be in a dormant state for several years before awakening to more virulent modes [56]. Likewise, the progresses in this area have also been limited. As a consequence, the resulting infections cause morbidity and discomfort to patients and lead to unsuccessful attempts to treat them with antibiotics. Frequently, the only solution is the surgical removal and replacement of the implant. These failures in clinical treatment, as well as the necessary revision surgeries increase significantly the health care costs. The understanding of mechanisms underlying the biofilm development is one of the most important subjects of modern science, since the impact that biofilms have in industry and on the medical field is very significant, both economically and in the people’s lives [51].
CHAPTER 1 - GENERAL INTRODUCTION
13
1.3. Methods to study biofilms
In recent years, experimental methods used to study biofilms have advanced greatly. The frequently used methods include techniques for controlled in vitro biofilm growth, quantification of biofilm mass or thickness, assessment of microbial activities within biofilms, visualization of biofilms and their components by labelling and microscopy, and study of their mechanical properties [59]. This section focuses in three techniques/methodologies that can be used for studying biofilms, namely the Optical Coherence Tomography technique (OCT), Confocal Laser Scanning Microscopy (CLSM) and Low Load Compression Test (LLCT).
1.3.1.
Optical Coherence Tomography
OCT is a technique derived from the medical field, invented in 1991 by Huang et al. [59] as a versatile tool for medical imaging [60]. It has been used in areas such as cardiology, ophthalmology and generally in the biomedical field [61]. Examples of applications in these areas include the rapid volumetric imaging of cortical vasculature [62], visualization of characteristic kidney anatomic structures [63], imaging of retinal, anterior segment and full eye [64] and help imaging support in diagnostic of aborted acute myocardial infarction [65]. In biofilm science, it is a relatively recent technique and it has been shown to be suitable to characterize the biofilm growth, detachment and structural heterogeneity [66-67]. OCT is an interferometric technique typically operating with near infrared light that analyses the backscattered light allowing the acquisition of two or three-dimensional images and the visualization of biofilms structure at a mesoscale level with high axial and spatial resolutions in the lower µm-range (< 20µm) [6,60]. The mesoscale is assumed to be in the range of millimeters. Figure 1.2 illustrates different scales and corresponding techniques to analyse the biofilm structure. Analysing biofilms at a mesoscale level allows characterizing biofilm processes, such as mass transfer and detachment [6]. The use of relatively long wavelength light allows deep penetration into the biofilm [68-69]. The devices, in contrast for instance with CLSM, are characterized by their compactness, mobility and ease of use [6].
CHAPTER 1 - GENERAL INTRODUCTION
14
Figure 1.2 Techniques used to study the biofilm structure at different scales. The resolution decreases from left to right whereas the field of view increases. Mesoscopic structures (dimension in millimeters range) filled the gap between microscale and macroscale. SEM, Scanning Electron Microscopy; CLSM, Confocal Laser Scanning Microscopy; OCT, Optical Coherence Tomography. Taken from [6].
OCT is able to capture optical signal during contact-free and non-invasive operation. This means for instance that it is possible to visualize and record biofilm development without its damaging the biofilms and without using stains [69]. This technique has been used to investigate biofilm structures in water and membrane filtration systems, in capillary flow cells [70], and in crossflow filtration systems under laminar[6,60], transient and turbulent flow conditions. The advantages and disadvantages of this technique in comparison with other techniques are summarized in Table 1.3 at the end of this section.
1.3.2. Low Load Compression Test
LLCT is a method based on a principle of uniaxial compression. The device has the following components: a linear positioning stage, an electronic analytical balance fixed on a stable granite base and a computer for control, signal acquisition, and data analysis [71]. A representation of the device is shown in Figure 1.3.
CHAPTER 1 - GENERAL INTRODUCTION
15
Figure 1.3 Frontal view of the LLCT illustrating the main components of the system.
The deformation is carried by the linear positioning stage and the resulting force is measured by the electronic analytical balance that is linked to the computer [72]. This device has been used in biofilm science to measure its thickness and determine its mechanical properties. LLCT allows the determination of an apparent modulus of elasticity and the yield stress, parameters that are useful to study the mechanical stability of a biofilm [71-72]. Another biofilm property that can be evaluated with LLCT is the viscoelasticity, which is an important property to assess the antimicrobial penetration in the biofilm [73]. In contrast with the OCT, this is a destructive technique, i.e. it disrupts the biofilm. On the other hand, LLCT can be used to evaluate biofilms under physiological hydrated conditions, thus keeping the integrity of the biofilm and avoiding that shrinkage due to dehydration[71-72]. Depending on the biofilm studied (i.e. biofilm that grows in a flow chamber), this could be an advantage because it allows measuring with LLCT on one part of the biofilm and performing other studies with a different technique in another area of the biofilm. The main advantage of this technique is that it has no depth limitation; therefore it can be used for measuring a wide range of biofilm thicknesses. Additionally, it allows the analysis of a big area of the biofilm, almost 2 orders of magnitude larger than the area that can be analysed by microscopic methods, which leads to a more accurate determination of the biofilm thickness [72]. The advantages and disadvantages of this technique are also gathered in Table 1.3.
CHAPTER 1 - GENERAL INTRODUCTION
16
1.3.3.
Confocal Laser Scanning Microscopy
CLSM has been considered the state-of-art technique to visualize biofilms three-dimensionally [6]. It allows the study of hydrated interfacial microbial communities at the microscale [1,74]. The core instrument of any CLSM is a conventional upright or inverted epi-fluorescence microscope, which is used for visual examination of the sample. This technique uses laser sources in the visible or UV range and can be set up for reflection and fluorescence mode. Emission signals are detected with conventional photomultipliers or new detector types having higher quantum efficiency. The set up of CLSM is advantageous for the assessment of biological samples, comprising a range of devices such as cover well chambers, coverslip chambers, flow cells and Petri dishes in combination with water immersion or dipping lenses [59]. This technique permits the optical sectioning of biological objects resulting in either 2D highly resolved single section or, in most applications, a series of highly resolved 2D sections at a defined step-size. In order to study biofilms with this technique, it is necessary to stain the sample using fluorescent dyes [75-76]. With different staining approaches it is possible to examine intracellular and extracellular domains within microbial biofilms. For instance, it is possible to assess the viability, distinguishing between live bacteria and those with a compromised membrane (Live/ dead staining), as well as to analyse the biofilm structure and overall biomass. CLSM also allows the study of the EPS using lectin-binding stains that enable the detection of glycoconjugate distribution in relation to bacterial cells, microcolonies and overall biofilm distribution. Although, in this field, additional approaches are required due to the complex biochemical makeup of the matrix [59]. Also, with the use of fluorescent stains it is possible that fluorescence quenching occurs during operation, which is one of the disadvantages of this technique [72]. Because of the density and thickness of some biofilms, stains and laser beams sometimes cannot penetrate through the whole biofilm, thus being the penetration depth another important disadvantage of this technique [77]. Table 1.3 summarizes the advantages and disadvantages of CLSM.
CHAPTER 1 - GENERAL INTRODUCTION
17 Table 1.3 Advantages and disadvantages of the techniques used in the current study to analyse biofilms.
Advantages OCT LLCT CLSM
Operates under hydrated conditions ✓ ✓ ✓
No Staining ✓ ✓
Deep penetration in biofilms ✓ ✓
Non destructive ✓
Allows in-situ measurements ✓
Allows online monitoring of the biofilm ✓
Allows the visualization of the mesoscale structure of the
biofilm ✓
Allows the acquisition of 2D and 3D images ✓ ✓
Allows to measure the thickness in a bigger area of the biofilm
compared with the CLSM ✓ ✓
No depth limitation ✓
Can be used to measure the thickness of biofilms grown on
solid-air interfaces ✓ ✓
Low cost system ✓ ✓
Allows seeing the presence of EPS and bacterial viability ✓
Allows to study of mechanical properties ✓
Disadvantages
Limited resolution ✓
Cannot reveal chemical information ✓ ✓
Does not allow imaging on a cellular level ✓ ✓
Destructive technique ✓ ✓
Does not allow the 3D visualization of the biofilm architecture ✓
Without staining imaging is generally not possible ✓
Not suitable for online monitoring of the biofilm ✓ ✓
Possible lost of fluorescence during operation ✓
Laser penetration is limited ✓
The stain can affect the structure of the biofilm ✓
References [6][60][68][69] [72][71] [72][77][18][78][79]
The combination of these three techniques allows studying biofilms from a molecular and cellular level to a mesoscopic scale, which is extremely useful to understand all the mechanisms involved in biofilm formation and detachment.
C
HAPTER
2
M
ATERIAL AND
M
ETHODS
CHAPTER 2 – MATERIAL AND METHODS
21
2.1. Bacterial strains, growth conditions and quantification
The bacterial strains used in this study are listed in table 2.1. They were stored at -80 °C in 7% dimethylsulphoxide (DMSO) and grown overnight on sheep blood agar plates at 37 °C. The plates were kept at 4 °C for a maximum of two weeks. For each experiment the bacteria were pre-cultured in 10 ml of tryptic soya broth (TSB, Oxoid, Basingstoke, UK) for 24 h at 37 °C and then used to inoculate a second culture of 50 mL at the same conditions overnight. After incubation, the cells were washed once in PBS. For that purpose, the main cultures were transferred to sterile centrifugation tubes and centrifuged (Beckman Coulter Avanti J-26S XP) at 5000 g at 10 °C for five minutes. The supernatants were removed and the pellets were ressuspended in 20 ml of phosphate buffered saline (PBS; 5mM K2HPO4, 5mM KH2PO4,
150mM NaCl, pH 7.0) and centrifuged again before final suspension in 8 ml of PBS. The final suspension was sonicated (Transsonic TP 690-A, Elma®, Germany) to break any possible
aggregates and then bacteria were enumerated using a Bürker Türk counting chamber.
Table 2.1 Bacterial strains and growth media used and different growth conditions.
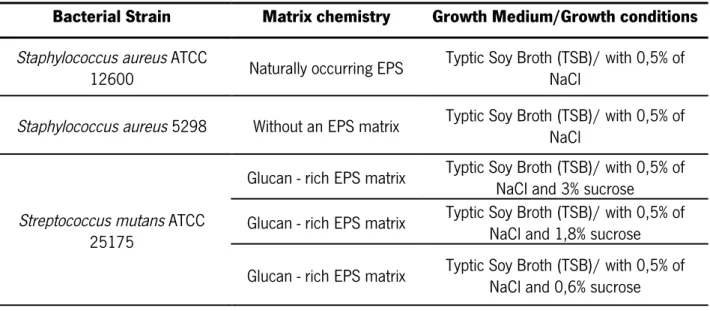
Bacterial Strain Matrix chemistry Growth Medium/Growth conditions Staphylococcus aureus ATCC
12600 Naturally occurring EPS Typtic Soy Broth (TSB)/ with 0,5% of NaCl Staphylococcus aureus 5298 Without an EPS matrix Typtic Soy Broth (TSB)/ with 0,5% of NaCl
Streptococcus mutans ATCC 25175
Glucan - rich EPS matrix Typtic Soy Broth (TSB)/ with 0,5% of NaCl and 3% sucrose Glucan - rich EPS matrix Typtic Soy Broth (TSB)/ with 0,5% of NaCl and 1,8% sucrose Glucan - rich EPS matrix Typtic Soy Broth (TSB)/ with 0,5% of NaCl and 0,6% sucrose
CHAPTER 2 – MATERIAL AND METHODS
22
2.2. Glass slides preparation and coating
Glass slides were cut in half and in order to coat their surfaces they were first cleaned by sonication for 5 min in 2% RBS 35 (Omnilabo, International BV, The Netherlands), then they were rinsed with tap water followed by demineralized water, methanol, and finally demineralized water again. After this procedure, the glass slides were wrapped in aluminium foil and were sterilized in the autoclave.
The glass slides were coated with Serum (PBS and 2% Fetal bovine Serum (FBS; Sigma, USA)). For that purpose, they were immersed in the solution for 1 h at room temperature and then placed in small petri dishes.
2.3. Biofilm formation
Streptococcus mutans biofilms were grown in the presence of different amounts of sucrose to vary the amount of glucans in the matrix [80-81]. Staphylococcus aureus ATCC 12600 and Staphylococcus aureus 5298 were selected as representatives of genera staphylococcus for their known ability to produce biofilms with or without an EPS matrix, respectively [82-84]. All biofilms were also grown in the presence of NaCl that is known to enhance the formation of biofilm [85]. Table 2.1 summarizes the chemical characteristics of the EPS matrix of the different biofilms.
The biofilms were cultivated on glass slides previously coated with serum in small petri dishes. To grow the biofilm a concentration of 1x10⁹ cells/ml was used. For the adhesion
phase, cells were maintained in PBS for 2 h with agitation at 60 rpm at 37 °C. After 2 h, the PBS containing the non-adhered cells was carefully removed and fresh growth medium was added with different percentages of sucrose (only for S. mutans strain) and 0.5% of NaCl for the respective strains (table 2.1). The biofilms were grown for 48 h in static conditions at 37 °C and the medium was refreshed after 24 h.
CHAPTER 2 – MATERIAL AND METHODS
23
2.4. Measurements of biofilm thickness
After 48 h the glass slides with the biofilm were removed from the medium and placed in new petri dishes with 10 ml of PBS. Since OCT is a non-destructive technique to measure biofilms it was the first technique used, follow by the LLCT and last CLSM.
2.4.1. OCT measurements
The OCT model used was the Thorlabs Ganymede - II 930 nm System with the following features: axial depth resolution (Air/ Tissue) 6µm /4.3µm, a lateral resolution of 8µm and a maximum field of view of 10 mm x 10 mm x 2.9 mm. For each biofilm three cross section images were taken and images were processed using ThorImage OCT that is a high-performance data acquisition software provided by Thorlabs. Thickness was measured from the top of the glass slide until the top of the biofilm in five spots of the cross-section image.
The OCT instrument is sensitive to the effective optical path length and this is dependent of the refractive index. Since in this study the biofilms were measured under hydrated conditions, the refractive index of water (1.33) was used.
2.4.2. LLCT measurements
Low load compression testing is a destructive technique, thus the measurements were done on one section of the glass side while the other side was used for the CLSM measurements. During all LLCT measurements, biofilms were kept hydrated with buffer. Biofilm thickness was measured by first moving the plunger of the LLCT (diameter 2.5mm) towards a clean, uncultured region of the glass slide until it touches the surface and the plunger position is registered (zero position). Then, the plunger moves slightly upward, the previous procedure was repeated for a biofilm covered region of the glass slide and the difference in positions of the plunger in both cases, were taken as the thickness of the biofilm. Two values of touch load, namely 0.01g and 0.005g, were used. For each value of touch load the thickness was measured three times per biofilm.
CHAPTER 2 – MATERIAL AND METHODS
24
2.4.3. CLSM measurements
After the measurement with LLCT, the buffer was carefully removed and the biofilms were stained with the bacterial Live/ Dead stain BacLight (Molecular Probes, Leiden, The Netherlands). The presence of slime was determined using Calcofluor White (Optical Brightener, Sigma – Aldrich), a polysaccharide–biding dye. Staining was done for 20 min for the Live/ Dead stain and 10 min for the Calcofluor White in the dark. After 20 min, the excess of stain was removed and 10 ml of PBS were gently added. CLSM image stacks were acquired using a Leica TCS SP2 (Leica Microsystems Heidelberg GmbH, Germany) to enable the study of the biofilm structure. A water immersible lens with a 40x magnification was used to acquire those image stacks. To determine the thickness, the biofilm was scanned. For that purpose, the bottom was settled when the screen was dark and there was no slime, live or dead cells. The top of the biofilm was settled in the same way scanning the biofilm from the bottom to the top. The images where acquired with 2 µm between stacks and five spots were measured for each biofilm.
To process the images the open-source platform for biological-image analysis named Fiji was used [86].
2.5. Statistical analysis
All data were averaged for each strain studied and technique used. S. aureus strains were compared by applying the Mann-Whitney Test using Graphpad Prism software. A one-way ANOVA and a post-test Tukey for multiple comparisons with a significance level of 95% was used. The same software was used for the experiments with S. mutans ATCC 25175 grown with different percentages of sucrose.
C
HAPTER
3
R
ESULTS
CHAPTER 3 - RESULTS
27
3.1. OCT measurements
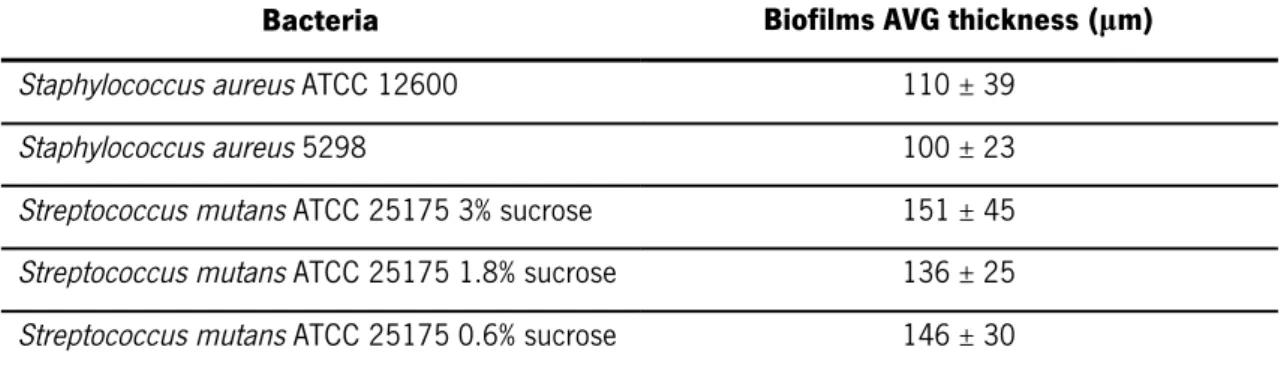
Biofilms of S. aureus ATCC 12600 and S. aureus 5298 reached an average thickness of 110 ± 39 µm and 100 ± 23 µm, respectively when measured with the OCT technique. There were no statistical significant differences in the biofilm thickness measured for the two strains (p > 0.05, Mann-Whitney Test). In the case of S. mutans ATCC 25175, growth with different sucrose percentages the differences in biofilms thicknesses were also not statistically significant (p > 0.05, one-way ANOVA). Table. 3.1 shows the thickness of the biofilms measured with OCT.
Table 3.1Average thicknesses of several biofilms measured by OCT.
Bacteria Biofilms AVG thickness (µm)
Staphylococcus aureus ATCC 12600 110 ± 39
Staphylococcus aureus 5298 100 ± 23
Streptococcus mutans ATCC 25175 3% sucrose 151 ± 45 Streptococcus mutans ATCC 25175 1.8% sucrose 136 ± 25 Streptococcus mutans ATCC 25175 0.6% sucrose 146 ± 30
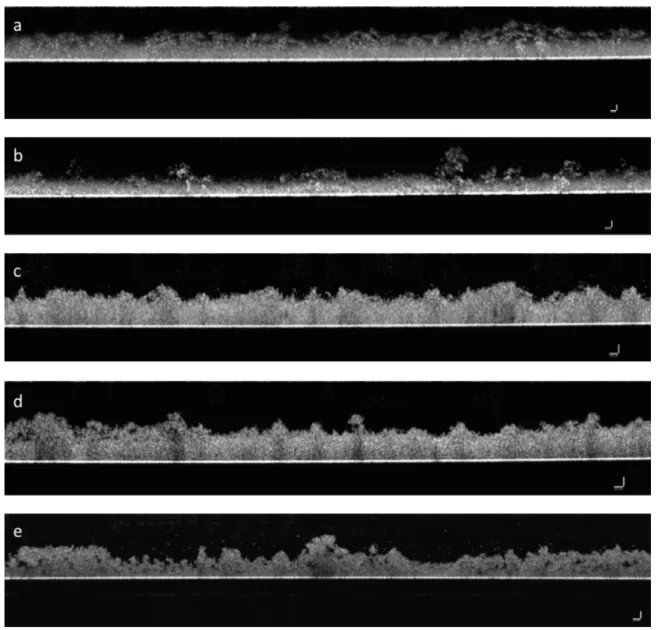
Figure 3.1 shows cross-section images of S. aureus (a and b) and S. mutans (c-e) biofilms used in this study. The glass surface is visible at the lower part of the image.
It is possible to see that biofilms do not possess a flat surface. On the contrary, the presence of mushroom-like structures is evident in Figure 3.1 - images (d) and (e). S. mutans biofilms are thicker and denser than the S. aureus biofilms and these seem more fluffy and smooth when compared with S. mutans biofilms. In Figure 3.1 images (a) and (b) some biofilm disruption is observed and in image (e) there are some black points in the structure of the biofilm which suggest the presence of channels in the biofilm structure.
Images in Figure 3.2 represent the 3D structure of S. aureus (a and b) and S. mutans (c– e) biofilms. The images show differences in surface topography, especially between biofilms from different bacteria. In images (c) and (e) the mushroom–like structure is perfectly visible.
CHAPTER 3 - RESULTS
28
Figure 3.1 Optical coherence tomography (OCT) images showing a vertical section of 48 h biofilms that grown under steady conditions. (a) Staphylococcus aureus ATCC 12600 biofilm. Scale bar = 25µm. (b) Staphylococcus aureus 5298 biofilm. Scale bar = 25µm. (c) Streptococcus mutans ATCC 25175 biofilm grown with 3% sucrose. Scale bar = 50µm. (d) Streptococcus mutans ATCC 25175 biofilm grown with 1.8% sucrose. Scale bar = 50µm. (e) Streptococcus mutans ATCC 25175 biofilm grown with 0.6% sucrose. Scale bar = 50µm.
CHAPTER 3 - RESULTS
29
Figure 3.2 Optical coherence tomography (OCT) 3D images of 48 h biofilms grown under static conditions. (a) Staphylococcus aureus ATCC 12600 biofilm. (b) Staphylococcus aureus 5298 biofilm. (c) Streptococcus mutans ATCC 25175 biofilm grown with 3% sucrose. (d) Streptococcus mutans ATCC 25175 biofilm grown with 1.8% sucrose. (e) Streptococcus mutans ATCC 25175 biofilm grown 0.6% sucrose. Units of axes are in mm.
CHAPTER 3 - RESULTS
30
3.2. LLCT measurements
LLCT measurements were done using two different touch levels (0.005 g and 0.01 g). Regarding the S. aureus ATCC 12600, the averages of the thickness of the biofilm were 45 ± 14µm with a touch load of 0.01g and 90 ± 12µm with a touch load of 0.005 g showing a significant increase (p < 0.05 Mann-Whitney Test) of the thickness when a lower touch load is applied (Figure 3.3). For S. aureus 5298, the biofilms thickness measured with a touch load of 0.01g and 0.005g were 60 ± 4µm and 64 ± 21µm, respectively (Figure 3.3). The use of different values of touch load did not significantly affect the thicknesses measured (p > 0.05, Mann-Whitney Test).
Figure 3.3 Thickness of Staphylococcus aureus ATCC 12600 and Staphylococcus aureus 5298
biofilms measured with LLCT with a touch load of 0.01g and 0.005g. Data represent mean ± standard error (n=5 for S. aurerus ATCC 12600 with touch load of 0.01g; n=4 for S. aureus ATCC 12600 with touch load of 0.005g; n=4 for S. aureus 5298 with touch load 0.01g and 0.005g).
CHAPTER 3 - RESULTS
31 Comparing the two strains, since the S. aureus ATCC 12600 is a strong EPS producer and S. aureus 5298 is not, the thickness measured with a touch load of 0.01 g was significantly lower (p < 0.05, Mann-Whitney Test) for the S. aureus ATCC 12600. On the other hand, when a touch load of 0.005 g was used there was no significant difference between the thicknesses measured (p > 0.05, Mann-Whitney Test).
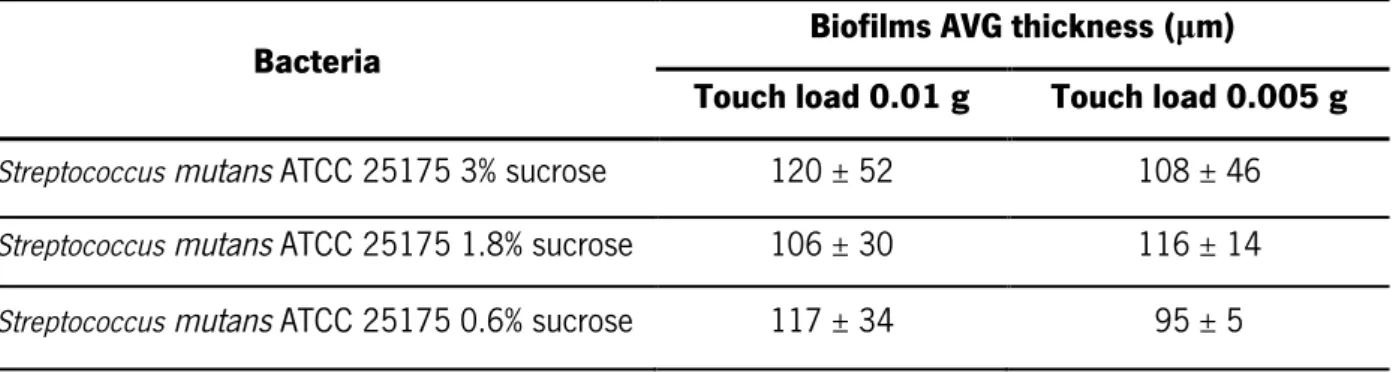
Regarding the S. mutans ATCC 25175, the average thicknesses are compiled in table 3.2. For all the treatments used, the differences in biofilm thickness when measured with a touch load of 0.01g were not statistically significant (p > 0.05, one-way ANOVA) and the same occurred with a touch load of 0.005g.
Comparing the biofilms thickness measured with the two touch loads for the S. mutans ATCC 25175 grown with 3% of sucrose, there was no significant difference in the thickness measured (p > 0.05, Mann-Whitney Test). For the other treatments (1.8 % and 0.6 % of sucrose) the differences were also not statistically significant.
Table 3.2 Average thicknesses of Streptococcus mutans ATCC 25175 biofilms with the different
growth conditions used measured with the Low Load Compression Test technique with the touch loads of 0.01g and 0.005g.
Bacteria Biofilms AVG thickness (µm)
Touch load 0.01 g Touch load 0.005 g Streptococcus mutans ATCC 25175 3% sucrose 120 ± 52 108 ± 46 Streptococcus mutans ATCC 25175 1.8% sucrose 106 ± 30 116 ± 14 Streptococcus mutans ATCC 25175 0.6% sucrose 117 ± 34 95 ± 5
CHAPTER 3 - RESULTS
32
3.3. CLSM measurements
The thickness of biofilms from S. aureus ATCC 12600 and S. aureus 5298 when measured with the CLSM were 104 ± 22µm and 107 ± 38µm, respectively showing no statistical significant difference (p > 0.05, Mann-Whitney Test) in thickness measured between strains. For S. mutans ATCC 25175, there was also no significant difference (p > 0.05, one-way ANOVA) in the thickness measured for the different treatments applied. Average thicknesses are shown in table 3.3.
Figure 3.4 shows CLSM representative images of all biofilms studied. Cross section images allow the visualization of the distribution of slime through the biofilms (images a, c-e) and also the morphology of the surface of the biofilm.
Table 3.3 Average thicknesses of biofilms of all bacteria used in this study measured with the Confocal Laser Scanning Microscopy technique.
Bacteria Biofilms AVG thickness (µm)
Staphylococcus aureus ATCC 12600 104 ± 22
Staphylococcus aureus 5298 107 ± 38
Streptococcus mutans ATCC 25175 3% sucrose 172 ± 24 Streptococcus mutans ATCC 25175 1.8% sucrose 157 ± 26 Streptococcus mutans ATCC 25175 0.6% sucrose 174 ± 54
CHAPTER 3 - RESULTS
33 Figure 3.4 Representative Confocal Laser Scanning Microscopy (CLSM) images of 48 h biofilms grown under static conditions. Scale bars = 50µm. (a) Staphylococcus aureus ATCC 12600 biofilm. (b) Staphylococcus aureus 5298 biofilm. (c) Streptococcus mutans ATCC 25175 biofilm grown with 3 % sucrose. (d) Streptococcus mutans ATCC 25175 biofilm grown with 1.8 % sucrose. (e) Streptococcus mutans ATCC 25175 biofilm grown with 0.6 % sucrose. Biofilms were stained with LIVE/ DEAD BacLight viability stain and Calcfluor White. The green colour represents live bacteria, red dead bacteria and blue represents the slime in the biofilm.
CHAPTER 3 - RESULTS
34
3.4. Biofilm thickness measured with OCT, LLCT and CLSM
Since the main objective of this study was to compare the thicknesses measured with the three techniques used, Figure 3.5 and 3.6 show the differences in the thickness measurements for S. aureus strains biofilms and for S. mutans ATCC 25175 biofilms grown with different sucrose concentrations, respectively.
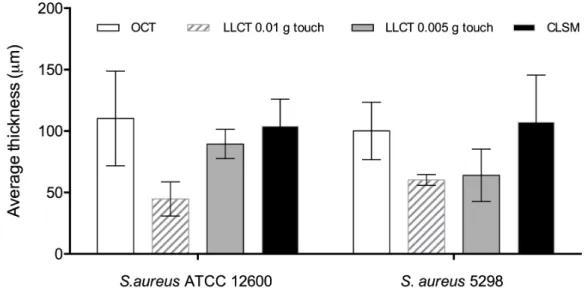
The results obtained for S. aureus ATCC 12600 show that there is a significant difference (p < 0.05, one-way ANOVA) in the thickness measured with the LLCT with a touch load of 0.01 g when comparing with the values measured with OCT and CLSM. On the other hand, the difference between the thicknesses obtained with OCT and CLSM are not significantly different (p > 0.05, one-way ANOVA). With a touch load of 0.005 g the measurements obtained with the LLCT are similar with the ones obtained with OCT and CLSM (p > 0.05, one-way ANOVA).
The measurements obtained from the biofilms of S. aureus 5298 are statistically similar when measured with the three techniques and with the two values of touch load used in the LLCT (p > 0.05, one-way ANOVA).
For the S. mutans ATCC 25175, the biofilm thickness is similar (p > 0.05, one-way ANOVA) when measured with the three techniques except the one with the treatment of 0.6% sucrose, where the thickness measured with the LLCT with a touch load of 0.005g is significant lower (p < 0.05, one-way ANOVA) than the one obtained with CLSM.
CHAPTER 3 - RESULTS
35
Figure 3.5 Thicknesses of bacterial biofilms measured with OCT, LLCT and CLSM for bacterial strains Staphylococcus aureus ATCC 12600 and Staphylococcus aureus 5298. Data represent mean ± standard error (OCT: n=7 for S.aurerus ATCC 12600 and S.aureus 5298; LLCT: n=5 for S.aurerus ATCC 12600 with touch load of 0.01g; n=4 for S.aureus ATCC 12600 with touch load of 0.005g; n=4 for S.aureus 5298 with touch load 0.01g and 0.005g; CLSM: n=5 S.aurerus ATCC 12600 and n=3 for S.aureus 5298).
Figure 3.6 Thicknesses of bacterial biofilms measured with OCT, LLCT and CLSM for bacterial strains Streptococcusmutans ATCC 25175 biofilm grown with different percentages of sucrose. Data represent mean ± standard error (OCT: n=7 for S.mutans ATCC 25175 for all treatments; LLCT: n=5 for S.mutans ATCC 25175 3% sucrose with touch load of 0.01g; n=4 for S.mutans ATCC 25175 3% sucrose with touch load of 0.005g; n=5 for S.mutans ATCC 25175 1.8% sucrose with touch load 0.01g; n=3 for S.mutans ATCC 25175 1.8% sucrose with touch load 0.005g; n=6 for S.mutans ATCC 25175 0.6% sucrose with touch load 0.01g; n=3 for S.mutans ATCC 25175 0.6% sucrose with touch load 0.005g; CLSM: n=3 for all concentrations of sucrose).
![Figure 1.1 Schematic representation of the steps involved in biofilm formation. Taken from [20]](https://thumb-eu.123doks.com/thumbv2/123dok_br/17612701.820400/27.892.137.765.521.794/figure-schematic-representation-steps-involved-biofilm-formation-taken.webp)